1. On Price
Price action of currencies, stocks, bonds, or financial markets in general, is a reflection of human nature. Price movement is determined by investors' decisions in response to a complex mix of psychological, sociological, political, economic and monetary factors. Charts allow us to plot and measure the strength of these moves and to forewarn of potential changes. As Edwards & Magee put it “Charting is the science of recording, usually in graphic form, the actual history of trading […] and then deducing from that pictured history the probable future trend”.
At any given time, the price of a financial asset is determined by the forces of supply and demand. Supply and demand indications are typically mirrored into transactions data. Again, in the words of Edwards & Magee “ The market price reflects not only the differing value opinions of many orthodox security appraisers, but also the hopes and fears and guesses and moods, rational and irrational, of hundreds of potential buyers and sellers, as well as their needs and the resources – in total, factors which defy analysis and for which no statistics are obtainable, but which are nevertheless all synthesized, weighted and finally expressed into one precise figure at which the buyer and seller get together and make a deal.”
It's tough to argue with Edwards & Magee. They gave a very precise definition that included the psychological aspect of human decision making. It was true back then (they wrote their book in the mid 20th century) just as it is today. From a Japanese Candlestick perspective, doji’s, spinning tops, hammers, engulfing candles, inside/outside candles all offer clues as to the probable (current) psychology of the market at these tiered levels up & down the ladder.
They answer the question: “right here, right now, what is everyone thinking about the current conditions and factors that drive this asset that I am looking at?” Match your observations with some complimentary information like market chatter, fundamentals, specific order flow flavors of the day and you can begin to build a picture of the state of mind that the market finds itself in.
2. Creating a valid “map”
Now here's where it gets interesting. The natural question that comes to mind would be “well then do I always have to watch candle action to know what's going on during the day? Isn't that time -consuming?”. Of course, that would be very inefficient. Have you ever been to a psychotherapist? Does the psychotherapist ask you every minute of the time “what you're thinking and how you're feeling”? Or does the therapist let you talk and stop you for assessments on how you feel only when something important comes around?
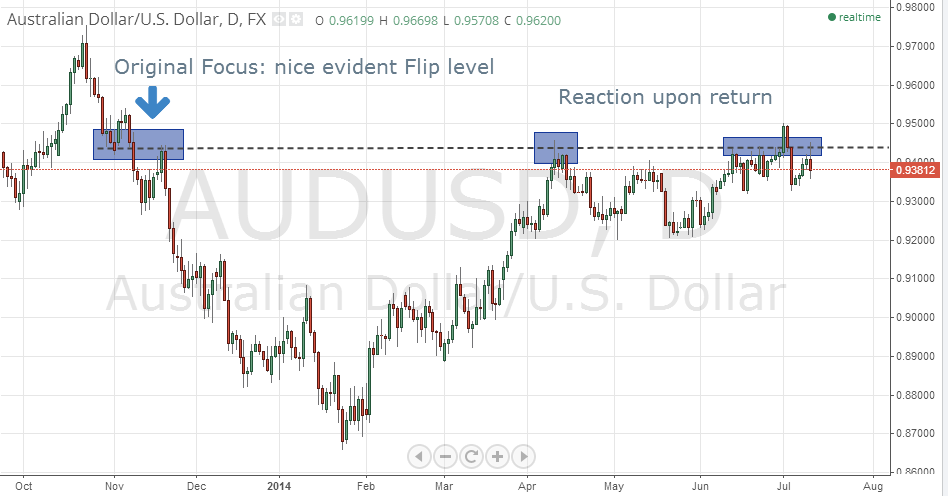
My point is that it's useless to sit in front of a screen constantly asking yourself what's happening. Just focus on some “points on the chart” that mean something. Only ask the questions when price is ready to tell you something important.

Source: Tradingview.com
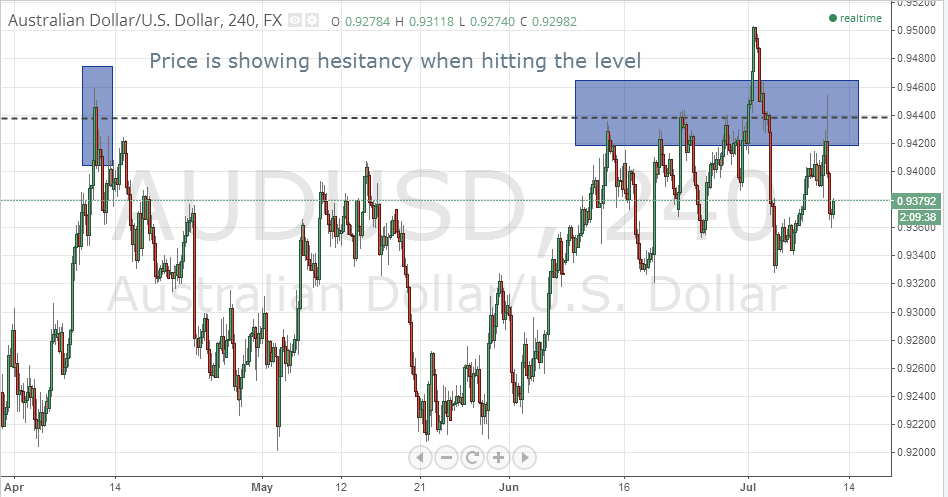
Dialling down a time frame (zooming in a little) you can see the same reaction:
 Source: Tradingview.com
So where exactly on the chart is it useful to “ask the market what it's thinking”? Some evident zones are:
- area’s where price action has previously reacted to demand or supply, showing some sort of imbalance;
- previous levels of agreement (or consolidation);
- round numbers(1.3500, 1.3600, etc.).
To sum up: we are always searching for eays to make our life easier as traders. One way is to remind ourselves that the market is made up of uncountable agendas, and all the emotions get displayed through the charts we use. By focusing on the larger time frames as price reaches prior levels of importance on the chart, we have a direct answer to “what the entire market is thinking right here, right now”. Price can help understand the market's perspective on things...you only know where and when to ask!
Good Luck!
REFERENCES
1. Orderflowtrading for fun and for profit – Daemon Goldsmith 2011
2. Market Mind Games – Denise Shull
3. Edwards & Mage – Technical Analysis of Stock Trends
Note: All information on this page is subject to change. The use of this website constitutes acceptance of our user agreement. Please read our privacy policy and legal disclaimer. Opinions expressed at FXstreet.com are those of the individual authors and do not necessarily represent the opinion of FXstreet.com or its management. Risk Disclosure: Trading foreign exchange on margin carries a high level of risk, and may not be suitable for all investors. The high degree of leverage can work against you as well as for you. Before deciding to invest in foreign exchange you should carefully consider your investment objectives, level of experience, and risk appetite. The possibility exists that you could sustain a loss of some or all of your initial investment and therefore you should not invest money that you cannot afford to lose. You should be aware of all the risks associated with foreign exchange trading, and seek advice from an independent financial advisor if you have any doubts.
Editors’ Picks
EUR/USD fluctuates near 1.0700 after US data

EUR/USD stays in a consolidation phase at around 1.0700 in the American session on Wednesday. The data from the US showed a strong increase in Durable Goods Orders, supporting the USD and making it difficult for the pair to gain traction.
USD/JPY refreshes 34-year high, attacks 155.00 as intervention risks loom

USD/JPY is renewing a multi-decade high, closing in on 155.00. Traders turn cautious on heightened risks of Japan's FX intervention. Broad US Dollar rebound aids the upside in the major. US Durable Goods data are next on tap.
Gold keeps consolidating ahead of US first-tier figures

Gold finds it difficult to stage a rebound midweek following Monday's sharp decline but manages to hold above $2,300. The benchmark 10-year US Treasury bond yield stays in the green above 4.6% after US data, not allowing the pair to turn north.
Worldcoin looks set for comeback despite Nvidia’s 22% crash Premium

Worldcoin price is in a better position than last week's and shows signs of a potential comeback. This development occurs amid the sharp decline in the valuation of the popular GPU manufacturer Nvidia.
Three fundamentals for the week: US GDP, BoJ and the Fed's favorite inflation gauge stand out Premium

While it is hard to predict when geopolitical news erupts, the level of tension is lower – allowing for key data to have its say. This week's US figures are set to shape the Federal Reserve's decision next week – and the Bank of Japan may struggle to halt the Yen's deterioration.
RECOMMENDED LESSONS
Making money in forex is easy if you know how the bankers trade!
Discover how to make money in forex is easy if you know how the bankers trade!
5 Forex News Events You Need To Know
In the fast moving world of currency markets, it is extremely important for new traders to know the list of important forex news...
Top 10 Chart Patterns Every Trader Should Know
Chart patterns are one of the most effective trading tools for a trader. They are pure price-action, and form on the basis of underlying buying and...
7 Ways to Avoid Forex Scams
The forex industry is recently seeing more and more scams. Here are 7 ways to avoid losing your money in such scams: Forex scams are becoming frequent. Michael Greenberg reports on luxurious expenses, including a submarine bought from the money taken from forex traders. Here’s another report of a forex fraud. So, how can we avoid falling in such forex scams?
What Are the 10 Fatal Mistakes Traders Make
Trading is exciting. Trading is hard. Trading is extremely hard. Some say that it takes more than 10,000 hours to master. Others believe that trading is the way to quick riches. They might be both wrong. What is important to know that no matter how experienced you are, mistakes will be part of the trading process.
