- Bitcoin tumbles to $30,000 in search of robust support after losing support at the 200 SMA.
- The SOPR is heading fast towards one, hinting at a continued breakdown.
- Bitcoin is likely to present a buy the dip opportunity, allowing more investors to join the market.
Bitcoin is trading sub $30,000 after a hurricane-like gust of wind swept across the cryptocurrency market. The flagship digital assets had been rejected at $38,000, giving way to losses that took a pit stop at $34,000. However, the bearish outlook grew stronger, forcing BTC to test former support at $30,000.
According to the Spent Output profit Ratio (SOPR), an on-chain metric by Glassnode, the correction is bound to continue. Price action below $30,000 could bring the support at $28,000 on the test, while declines are likely to extend to $25,000 as predicted on Thursday.
Bitcoin SOPR predicts extended breakdown
Markets are psychological, hence the need to understand why certain things occur. On-chain metrics have recently become fundamental tools for understanding bearish, consolidation, and bull periods.
The SOPR is an indicator measured from network spent outputs. It is arrived at by dividing the realized value (USD) by the value at creation (USD) of an output (price sold/price paid).
A SOPR value higher than one suggests that all holders of spent outputs are transacting at a profit. On the other hand, any other value means that they are at a loss at the time of transacting. Usually, people sell when they are in profit.
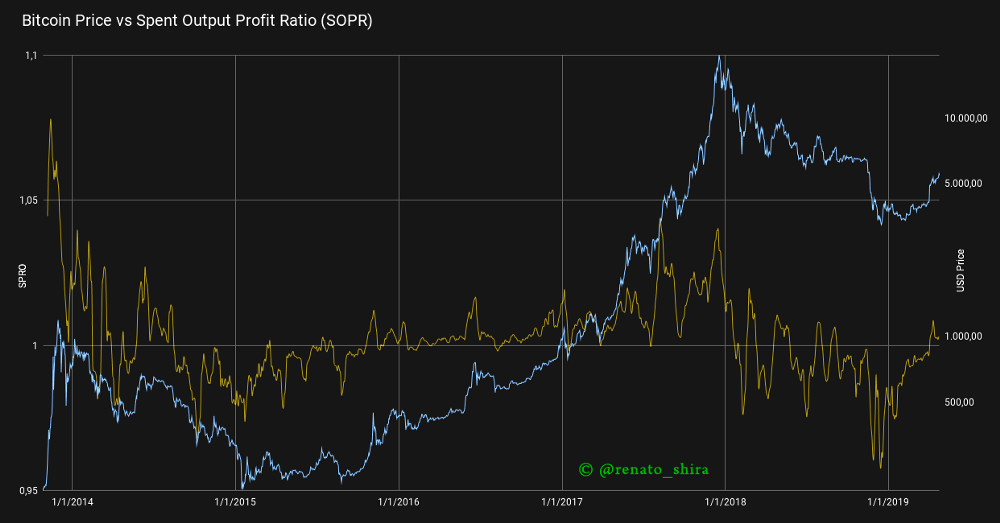
Bitcoin SOPR chart
Currently, the SOPR is declining towards one, which means less BTC is being transacted on-chain at extreme profits. The SOPR is likely to continue with the pullback eyeing the midline.
As explained recently, Bitcoin could also be nearing a reversal and would present a buy the dip opportunity. Realize that a SOPR of less than one in bull markets pushes the supply down, which leads to an increase in the price.
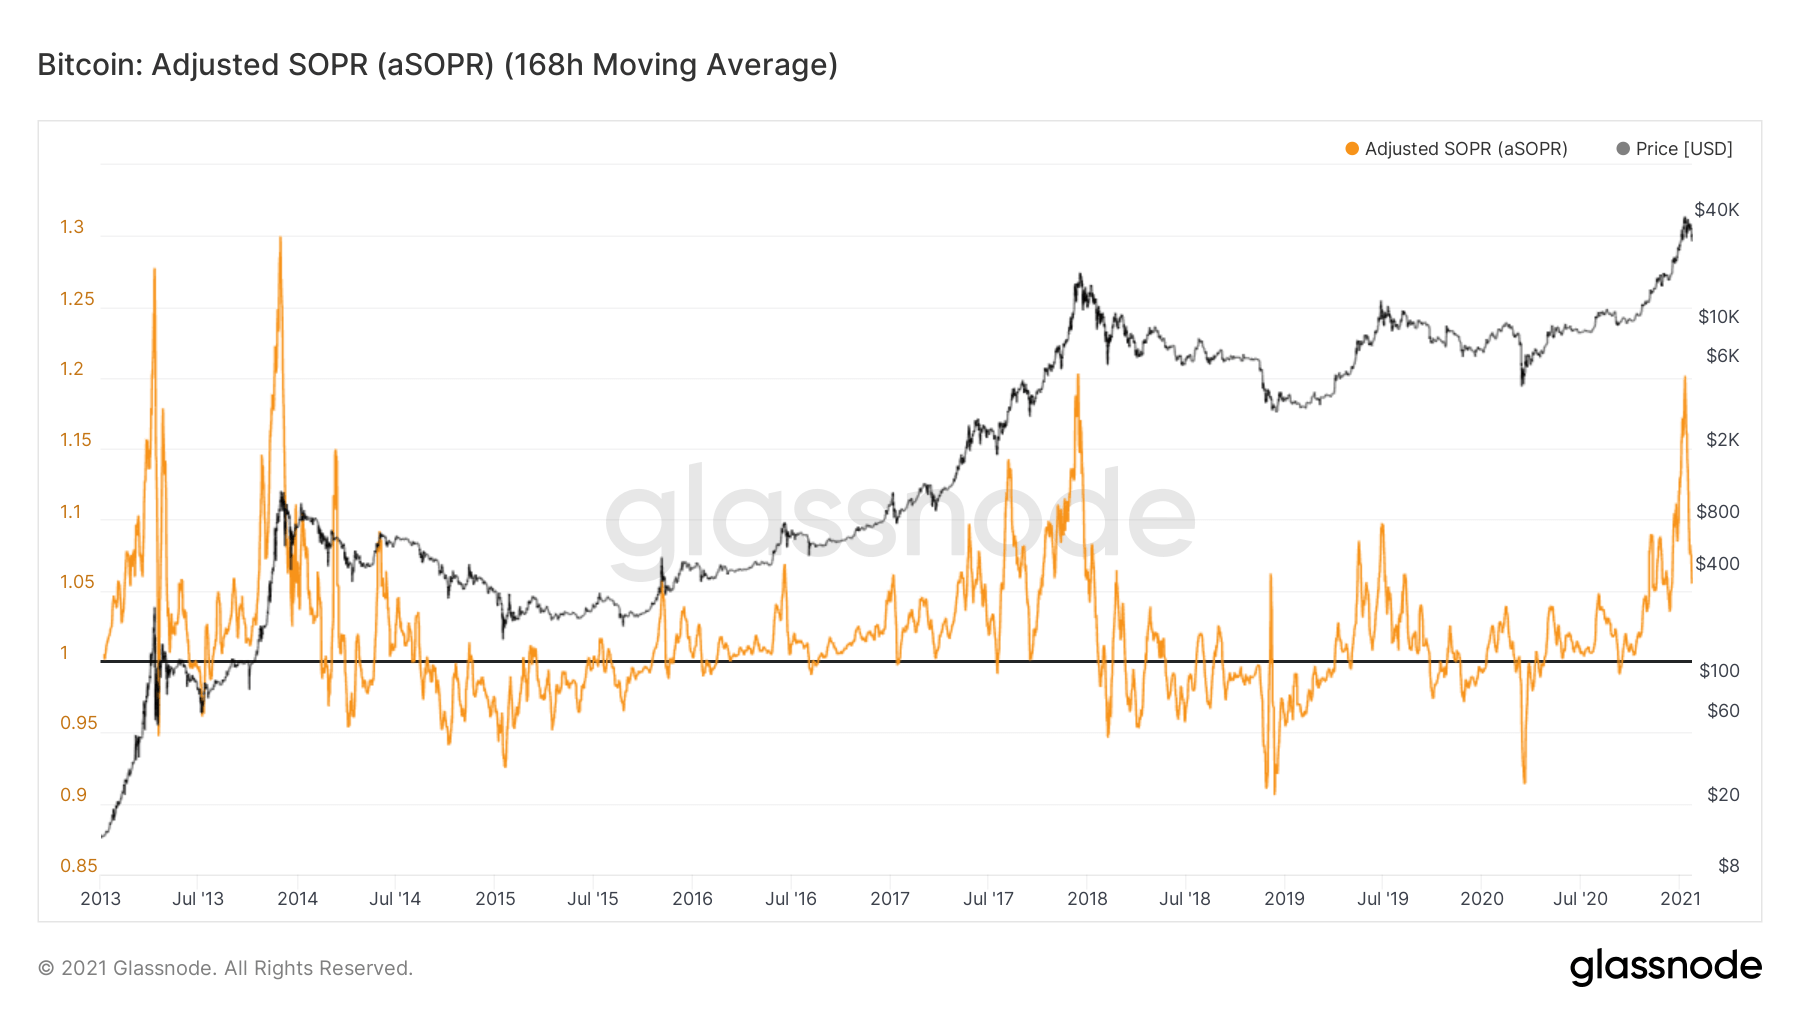
Bitcoin Adjusted SOPR chart
Bitcoin is exchanging hands at $30,500 after testing the former buyer congestion zone at $30,000. Various critical support levels have already been lost, including the symmetrical triangle support and the 200 Simple Moving Average on the 4-hour chart.
A breakdown under the lower trendline of the triangle precisely point’s Bitcoin to $25,000, as predicted on Thursday. Therefore, the technical perspective concurs with the SOPR, hinting at a continued correction before a significant reversal comes into the picture.
%20-%202021-01-22T061414.809-637468827355631325.png)
BTC/USD 4-hour chart
It is essential to realize that Bitcoin is trading under all the applied moving averages. Therefore, overhead pressure is likely to soar as odds for a bearish impulse surge.
Simultaneously, the Moving Average Convergence Divergence or MACD adds credibility to the bearish outlook by first diving into the negative region. Secondly, the 12-day moving average slipped below the 26-day moving average.
On the contrary, holding above $30,000 is likely to call for stability in the market, giving investors and bulls ample time to buy the dip. An increase in buying pressure would eventually catapult Bitcoin in a trajectory heading to $40,000.
Information on these pages contains forward-looking statements that involve risks and uncertainties. Markets and instruments profiled on this page are for informational purposes only and should not in any way come across as a recommendation to buy or sell in these assets. You should do your own thorough research before making any investment decisions. FXStreet does not in any way guarantee that this information is free from mistakes, errors, or material misstatements. It also does not guarantee that this information is of a timely nature. Investing in Open Markets involves a great deal of risk, including the loss of all or a portion of your investment, as well as emotional distress. All risks, losses and costs associated with investing, including total loss of principal, are your responsibility. The views and opinions expressed in this article are those of the authors and do not necessarily reflect the official policy or position of FXStreet nor its advertisers. The author will not be held responsible for information that is found at the end of links posted on this page.
If not otherwise explicitly mentioned in the body of the article, at the time of writing, the author has no position in any stock mentioned in this article and no business relationship with any company mentioned. The author has not received compensation for writing this article, other than from FXStreet.
FXStreet and the author do not provide personalized recommendations. The author makes no representations as to the accuracy, completeness, or suitability of this information. FXStreet and the author will not be liable for any errors, omissions or any losses, injuries or damages arising from this information and its display or use. Errors and omissions excepted.
The author and FXStreet are not registered investment advisors and nothing in this article is intended to be investment advice.
Recommended Content
Editors’ Picks
Ripple wipes out weekly gains, experts comment on role of Ripple stablecoin

Ripple declined to $0.52 on Thursday, erasing all gains registered earlier this week. Ripple SVP Eric van Miltenburg’s comments on the firm’s stablecoin, and how it is expected to benefit the XRP Ledger and native token XRP have raised concerns among crypto experts.
Hedera HBAR slips nearly 10% after air is cleared on mistaken link with giant BlackRock
HBAR price is down nearly 10% on Thursday, partly erasing gains inspired by the misinterpreted link with BlackRock. Despite the recent correction, Hedera’s price is up 44% in the past seven days.
The reason behind Bonk’s 105% rise and if you should buy now Premium

Bonk price has shot up 105% in the past five weeks. A retracement into $0.0000216 or the $0.0000152 to $0.0000186 imbalance would be a good buying opportunity. Patient investors can expect double-digit gains from BONK that could extend up to 70%.
Injective price weakness persists despite over 5.9 million INJ tokens burned
Injective price is trading with a bearish bias, stuck in the lower section of the market range. The bearish outlook abounds despite the network's deflationary efforts to pump the price. Coupled with broader market gloom, INJ token’s doomed days may not be over yet.
Bitcoin: BTC post-halving rally could be partially priced in Premium

Bitcoin (BTC) price briefly slipped below the $60,000 level for the last three days, attracting buyers in this area as the fourth BTC halving is due in a few hours. Is the halving priced in for Bitcoin? Or will the pioneer crypto note more gains in the coming days?