Jack Steiman, On Greed Changing to Fear? (SwingTradeOnline.com)
The bears can finally celebrate a day for themselves. It has been rare, although the market has been basically whipsawing about quite some time as those bears have been fighting a bit harder recently. As of Monday evening they deserve their little party. They didn't allow the bulls to fill the gap down, which led to a gap-and-run day for the most part on Monday. It wasn't straight down with force, but the bulls rarely made a move to get things on their side. Whenever the market rallied a bit, the bears said "not today, boys and girls! Not today!"
Gap-and-run can change psychology, and on Monday the bears did just that. You could feel the bulls giving up as the day went along. A rare time when things weren't reversed back up after an attempt to sell. The game has been, and always will be, about psychology. Fear is harder than greed, and requires mental energy. The bulls don't want to use their brains. They want to simply follow the herd and let things rise. They're used to that. When things change you know they're feeling the heat. Greed can change to fear in a day. We shall see if that formula starts to take hold.
It will if the bears can finally eradicate those key 50-day exponential moving averages. The loss of the 50's are all that matter to both the bulls and the bears. In bull markets you worry only when that level is removed. The 20's are important, but since the 20's are above the 50's in a bull market, it's not unusual to back test from the top of those critical 50's of support. So only when the 50's are gone do you make the connection that a real selling episode is upon us. Not a moment before. Then you have to back test over time, and if that back test fails, then you know the bull is over for some time to come. Lose the 50's, back test them, and then back down and you're golden if you're a bear.
So the levels to watch are 1977 on the S&P 500 and 4493 on the S&P 500 and Nasdaq, respectively. Markets can look very ugly when they're selling off the top and coming down for 50-day tests. It can feel like a bear market from above the 50's, yet it's not. So please don't get too bearish too early on in the game. We only know that Monday was a down day in a still existing bullish handle. That's all we know for sure.
Mike Paulenoff, On Massive Top in Russell 2000 Chart (MPTrader.com)
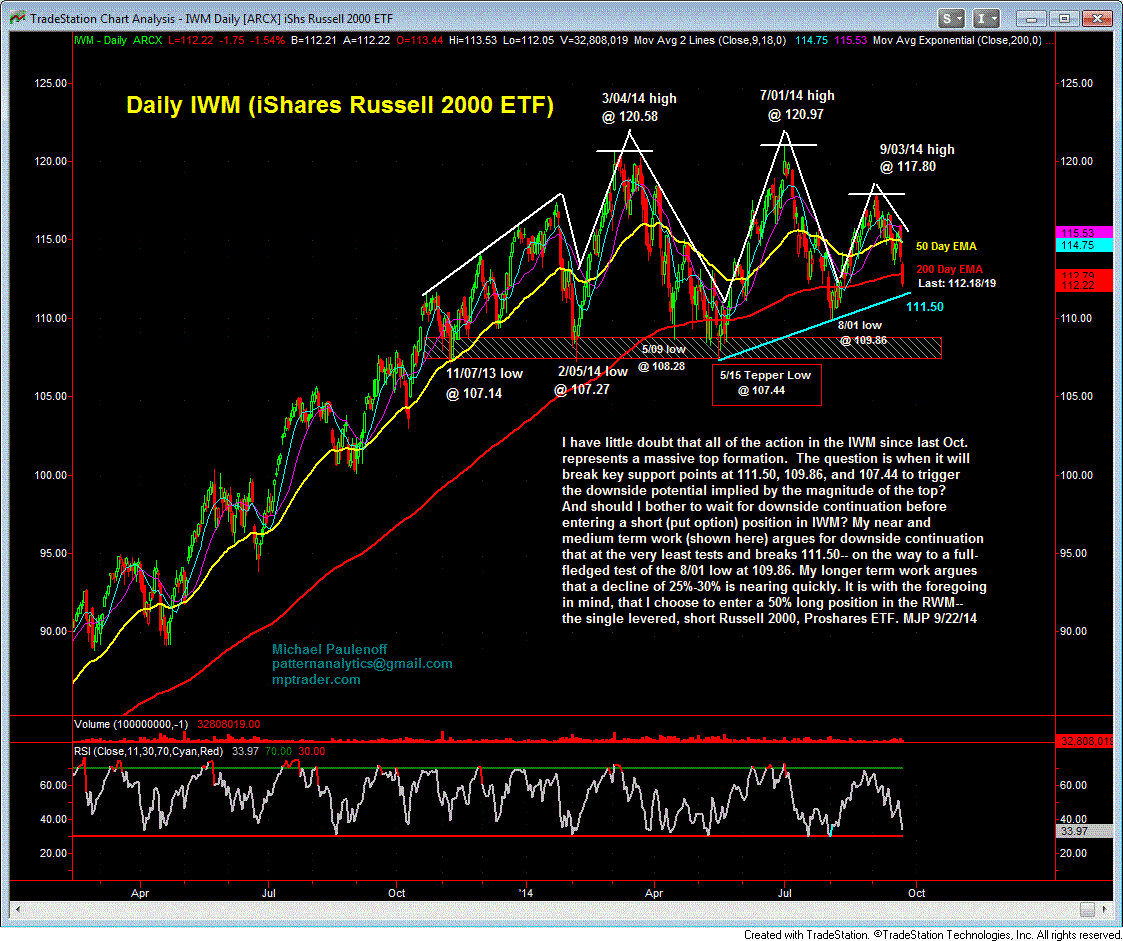
I have little doubt that all of the action in the iShares Russell 2000 ETF (IWM) since last October represents a massive top formation. The question is when it will break key support points at 111.50, 109.86 and 107.44 to trigger the downside potential implied by the magnitude of the top.
And should I bother to wait for downside continuation before entering a short (put option) position in the IWM?
My near- and intermediate-term work argue for downside continuation that at the very least tests and breaks 111.50 on the way to a full-fledged test of the August 1 low at 109.86.
My longer-term work argues that a decline of 25-30% is nearing quickly.
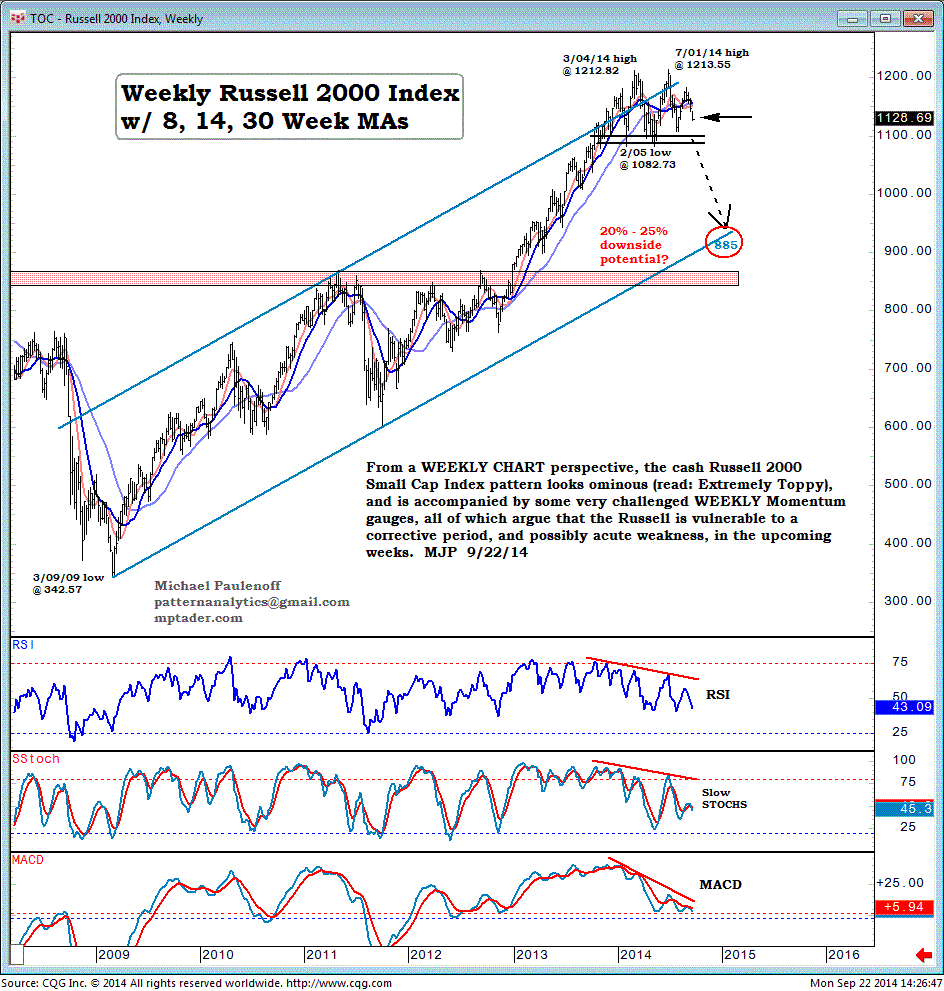
From a weekly chart perspective, the cash Russell 2000 Small Cap Index pattern looks ominous (read: Extremely Toppy), and is accompanied by some very challenged weekly momentum gauges that argue the Russell is vulnerable to a corrective period, and possibly acute weakness, in the upcoming weeks.
It is with the foregoing in mind that we add the ProShares Short Russell2000 (RWM) to our short-term model portfolio.
Avi Gilburt, On Tale of Two Ugly Counts (ElliottWaveTrader.net)
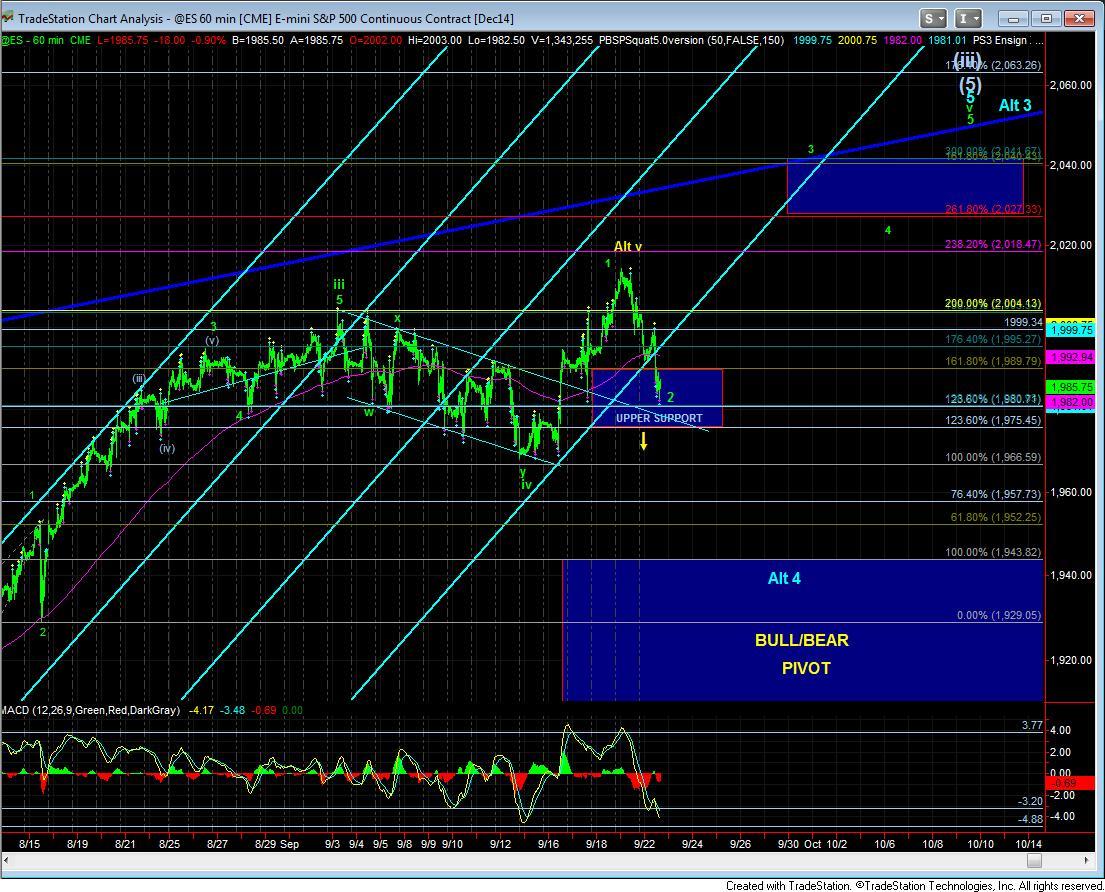
With the drop below 1983ES today, the market has invalidated the 1-2, a-b set up in wave 3 I noted over the weekend. So, where does that leave us?
Well, I said over the weekend that I do not like the wave v top in yellow for several reasons, and one of which was that it is very hard to get a solid 5 wave structure off the lows in that rally. Well, for the same reason now, I don't like the bullish structure we are forced to adopt if we are heading to a bigger move higher this week.
One fact that supports a top being in place is that wave v would be equal to the size of wave i. That is a standard we usually see between waves i and v. Furthermore, it is not unusual to see a top struck at a major market event which elicits significant bullishness, such as the Alibaba IPO.
However, we have come up very short of our Fibonacci Pinball extension targets, which always makes it hard for me to consider a top being in place, especially without taking out any levels of upper support.
So, for now, I will continue to look up as long as we do not break upper support. Moreover, should this be a 1-2 set up -- I am not going to expect it will meander the rest of the week. It will have to begin to prove itself as a wave 3 within the next 24-48 hours, or I am going to be moving more and more into the "topped" camp.
Lastly, this 1-2 set up does have higher projections over the 2040ES region, and can take us up to the next higher Fibonacci extension in the 2063ES region. So, I am going to wait and see where wave 3 tops before I consider us heading over 2040ES.
Harry Boxer, On 2 Longs & 2 Shorts to Watch (TheTechTrader.com)
With the market in a precarious state, we're going to go over some shorts as well as longs.
Starting on the long side, ReWalk Robotics Ltd. (RWLK) is a new stock, so we'll take a look at the 15-minute chart. It had a slow run-up and then a slow declining channel. The earlier pop on Monday reached 32.00. The overall structure is good, and potentially, it could be forming an ascending channel very nicely. There's a platform going on, with sideways consolidation, and it looks like it wants to break out of it. It may very well gap up Tuesday. The overall look is that it came down in a 4-day decline, and popped out on Monday. There's a little bit of resistance at 32 3/4. The target is the 37-38 zone.
GoPro, Inc. (GPRO) is still looking good. After it came down, it was in a consolidation-type pattern. This stock twice held key support around 63 1/4-3/4, but it has to get through 71 1/2. It needs to get running, first into the high 70's, and then the mid 80's.
On the short side, Qihoo 360 Technology Co. Ltd. (QIHU) is very interesting. It has a very large, massive head-and-shoulders pattern that came down steadily for 4-5 weeks, and Monday morning it hit right under 73, and then rallied a little bit, but it was still down 1.69, or 2.2%. It's right on the 74.94 line. The next stop is 64.00.
Waddell & Reed Financial, Inc. (WDR) is another "Boxer Short." It broke through the bear flag last week, rallied for a couple days, and then rolled over. Watch the support at 51 1/4, and beyond that, this stock could go all the way down to the 45-7 zone.
Other on Harry's Charts of the Day are Ambarella, Inc. (AMBA), VASCO Data Security International (VDSI), Tekmira Pharmaceuticals Corp. (TKMR), MOBILEYE N.V. (MBLY), Direxion Daily Gold Miners Bear 3X Shrs (DUST), and Direxion Daily Jr Gld Mnrs Bear 3X ETF (JDST).
On the short side, stocks include Acxiom Corporation (ACXM), Ascent Capital Group, Inc. (ASCMA), CalAmp Corp. (CAMP), eHealth, Inc. (EHTH), Interactive Intelligence Group Inc. (ININ), Kindred Healthcare Inc. (KND), Michael Kors Holdings Limited (KORS), Silicom Ltd. (SILC), Terex Corp. (TEX), and Tupperware Brands Corporation (TUP).
Sinisa Persich, On Free Stock Pick: Shorting TSLA (TraderHR.com)
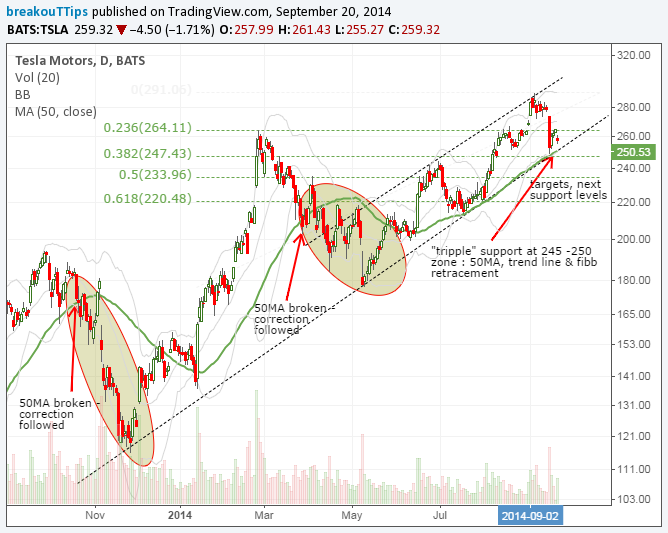
I noted over the weekend that after a sharp decline of almost 10% last Monday, Tesla Motors, Inc. (TSLA) was in a consolidation the rest of the week right above a very important technical level in 247-250 zone. That's where the 50-day moving average, 1-year trend line, and the Fibonacci retracement level together form strong support.
If broken, that is also potentially the inflection point that could lead to further decline toward 235 and 220 area. Accordingly, as I noted, I am looking for a trade setup once (if) last week low at 247 zone is broken, with an initial stop in the 265 zone.
With Monday's move down 9.29 (-3.5%) to 250.03, TSLA is very near that breaking point.
This Web site is published by AdviceTrade, Inc. AdviceTrade is a publisher and not registered as a securities broker-dealer or investment advisor either with the U.S. Securities and Exchange Commission or with any state securities authority. The information on this site has been obtained from sources considered reliable but we neither guarantee nor represent the completeness or accuracy of the information. In addition, this information and the opinions expressed are subject to change without notice. Neither AdviceTrade nor its principals own shares of, or have received compensation by, any company covered or any fund that appears on this site. The information on this site should not be relied upon for purposes of transacting securities or other investments, nor should it be construed as an offer or solicitation of an offer to sell or buy any security. AdviceTrade does not assess, verify or guarantee the suitability or profitability of any particular investment. You bear responsibility for your own investment research and decisions and should seek the advice of a qualified securities professional before making any investment.
Recommended Content
Editors’ Picks
EUR/USD clings to daily gains above 1.0650

EUR/USD gained traction and turned positive on the day above 1.0650. The improvement seen in risk mood following the earlier flight to safety weighs on the US Dollar ahead of the weekend and helps the pair push higher.
GBP/USD recovers toward 1.2450 after UK Retail Sales data

GBP/USD reversed its direction and advanced to the 1.2450 area after touching a fresh multi-month low below 1.2400 in the Asian session. The positive shift seen in risk mood on easing fears over a deepening Iran-Israel conflict supports the pair.
Gold holds steady at around $2,380 following earlier spike

Gold stabilized near $2,380 after spiking above $2,400 with the immediate reaction to reports of Israel striking Iran. Meanwhile, the pullback seen in the US Treasury bond yields helps XAU/USD hold its ground.
Bitcoin Weekly Forecast: BTC post-halving rally could be partially priced in Premium

Bitcoin price shows no signs of directional bias while it holds above $60,000. The fourth BTC halving is partially priced in, according to Deutsche Bank’s research.
Week ahead – US GDP and BoJ decision on top of next week’s agenda

US GDP, core PCE and PMIs the next tests for the Dollar. Investors await BoJ for guidance about next rate hike. EU and UK PMIs, as well as Australian CPIs also on tap.


