Harry Boxer, on 4 Top Stock Charts (TheTechTrader.com)
It was another bullish-trading session on Monday. Many of our stocks did very well, and it was a great trading day for many of our traders.
Achillion Pharmaceuticals, Inc. (ACHN) had a monster run in June, coiled for a couple months, broke out, formed a little flag, and on Monday, it popped out, up 1.02, or 10.45%, on 14 million shares. That's the second-best volume since June. There appears to be some resistance at 11 1/4, and then 12 1/2, which are the two targets going forward. Beyond that, this looks like a $13 stock. We may see 11 1/4-1/2 as early as Tuesday.
BioDelivery Sciences International, Inc. (BDSI), one of our swing trades, did okay on Monday. One of the declining tops lines broke, a little flag formed, and now there's a test of the major tops. It was up 43 cents, or 3.11%, on 1.3 million shares. It opened at 13.88, ran to a high of 14.44, before pulling back and closing at 14.25. If it gets through Monday's high at 14.44, look for it to run up to 18, and then 20.
Durata Therapeutics, Inc. (DRTX) is a stock we put a swing trade alert on during Monday's session because it's right across a double top. It was up 38 cents, or 2.4%, on 375,100 shares traded. That's not the best volume, so be looking for a pick-up in volume, and to test, or take out, the 17 1/4 range, then 18 1/4, and then 20.
Keryx Biopharmaceuticals Inc. (KERX) did very well on Monday, up 1.34, or 8.4%, on 3.6 million shares. It has a long, rising channel. If it can break out on Tuesday, the possibility is that it could get through minor resistance at 21, and now I'm looking at 23 to develop a potential swing-trade target.
Other on Harry's Charts of the Day are Advaxis, Inc. (ADXS), Autohome Inc. (ATHM), Abraxas Petroleum Corp. (AXAS), Bitauto Holdings Limited (BITA), Digital Ally Inc. (DGLY), Exact Sciences Corporation (EXAS), China HGS Real Estate Inc. (HGSH), J. C. Penney Company, Inc. (JCP), iKang Healthcare Group, Inc. (KANG), LRAD Corporation (LRAD), MobileIron, Inc. (MOBL), 21Vianet Group, Inc. (VNET), and Warren Resources Inc. (WRES).
Avi Gilburt, on Levels to Watch en Route to Top (ElliottWaveTrader.net)
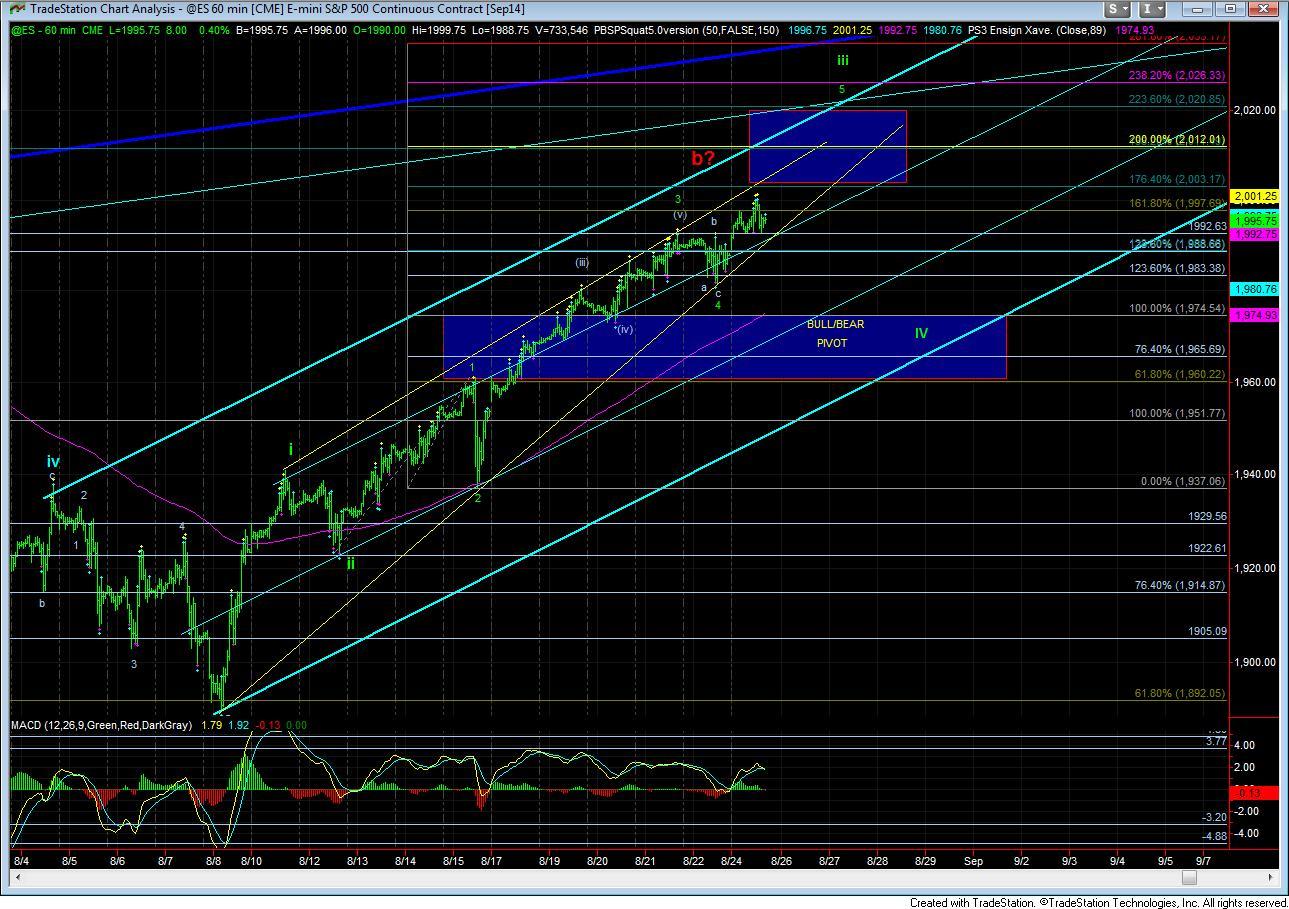
Has Wave III completed? In simple terms, I don't think so just yet.
There is an old adage that once resistance is broken, it then becomes support. We struggled for days within the 1990-1993ES region before we broke it to the upside on Monday. And now it looks like the market is testing that support.
As long as that region holds as support, then I will next look up towards at least the 2003ES region, but ideally to the 2012 region, which can finally have us top in our wave III as early as tomorrow.
From a larger perspective, note that the market has been following its script very well for the last few months. While the last decline did take us a few points lower than we ideally wanted to see to the 1890ES region, it did hold the 1890ES region as our last remaining support.
So, for now, I have no reason to believe we are not completing a 5 wave structure off that region, of which wave III should be topping in the near term.
Of course, once wave III does find its top, then we will likely see a multi-day wave IV, which can even take the better part of a week to complete.
So, those that are thinking of taking a longer long holiday weekend, well, that may not be a bad idea!
Mike Paulenoff, on Possible Changing Winds for Equities with Oil's Upturn? (MPTrader.com)
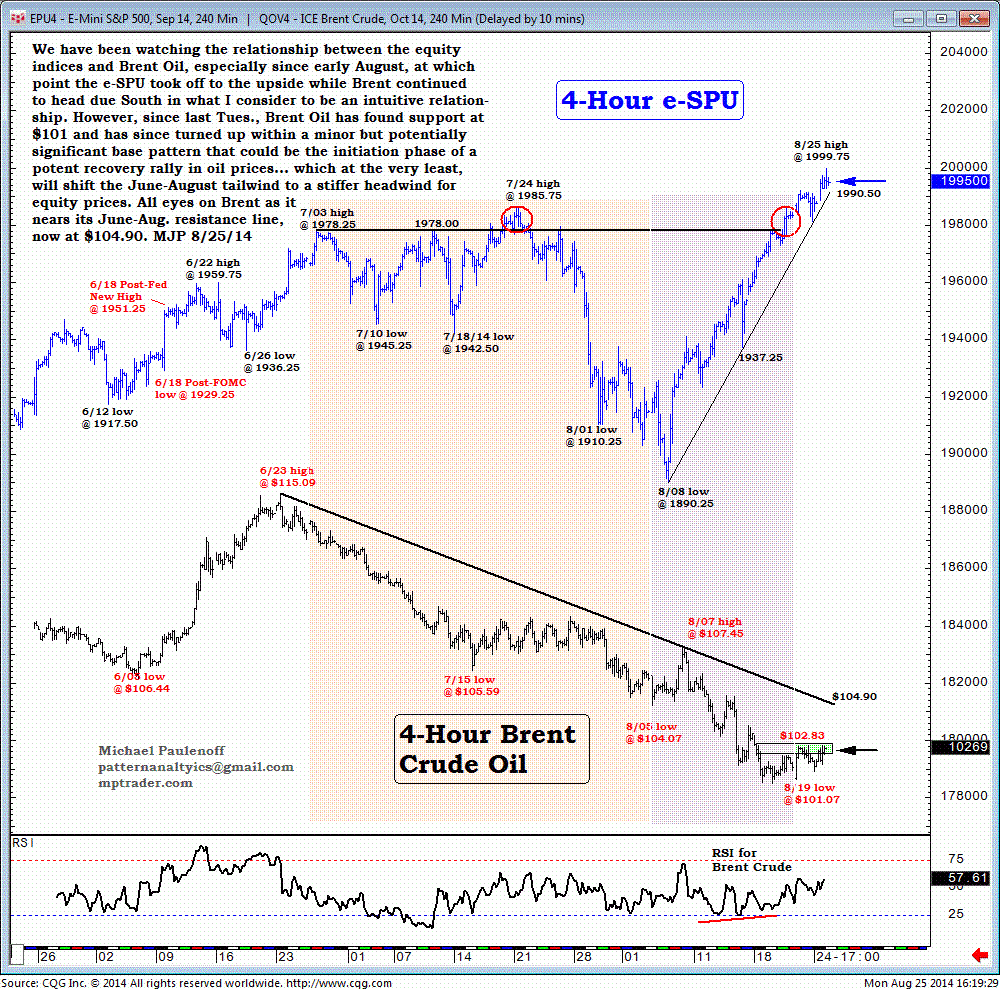
We have been watching the relationship between the equity indices and Brent Oil, especially since early August, at which point the Emini S&P 500 took off to the upside while Brent continued due south in what I consider to be an intuitive relationship.
However, since last Tuesday, Brent Oil has found support at $101 and has since turned up within a minor but potentially significant base pattern that would be the initiation phase of a potent recovery rally in oil prices.
This at the very least will shift the June-August tailwind to a stiffer headwind for equity prices.
All eyes on Brent as it nears its June-August resistance line, now at $104.90.
Sinisa Persich, on 3 Breakouts to Watch (TraderHR.com)
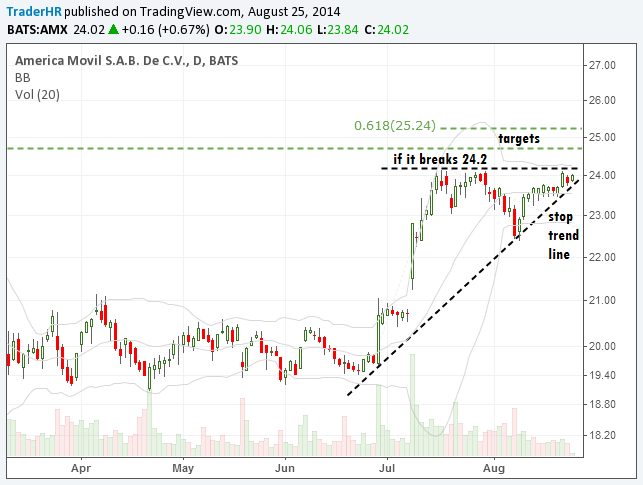
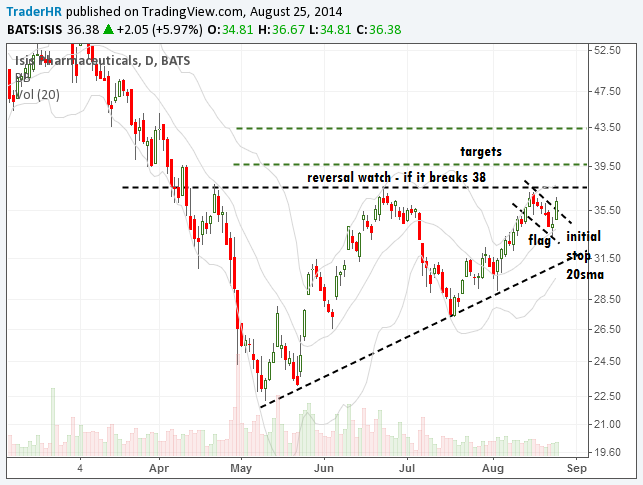
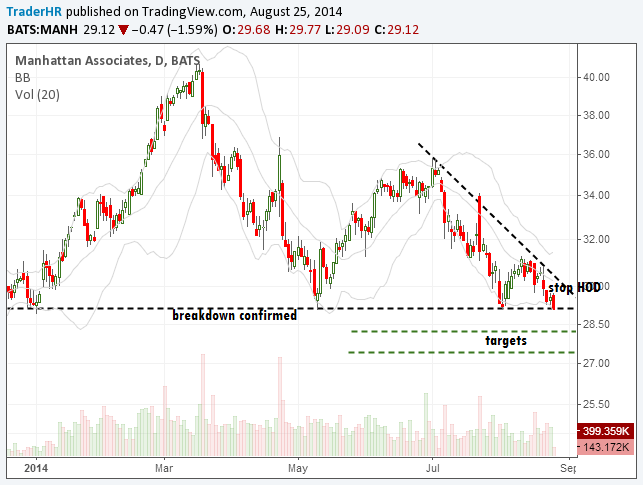
Here are three charts -- 2 longs and 1 short -- setting up to break out of their triangle patterns.
Watch for a break of 24.20 on AMX and 38 on ISIS, whose ascending triangles are pressuring lateral resistance, while MANH's descending triangle has a breakdown level of 29.
This Web site is published by AdviceTrade, Inc. AdviceTrade is a publisher and not registered as a securities broker-dealer or investment advisor either with the U.S. Securities and Exchange Commission or with any state securities authority. The information on this site has been obtained from sources considered reliable but we neither guarantee nor represent the completeness or accuracy of the information. In addition, this information and the opinions expressed are subject to change without notice. Neither AdviceTrade nor its principals own shares of, or have received compensation by, any company covered or any fund that appears on this site. The information on this site should not be relied upon for purposes of transacting securities or other investments, nor should it be construed as an offer or solicitation of an offer to sell or buy any security. AdviceTrade does not assess, verify or guarantee the suitability or profitability of any particular investment. You bear responsibility for your own investment research and decisions and should seek the advice of a qualified securities professional before making any investment.
Recommended Content
Editors’ Picks
AUD/USD remained bid above 0.6500

AUD/USD extended further its bullish performance, advancing for the fourth session in a row on Thursday, although a sustainable breakout of the key 200-day SMA at 0.6526 still remain elusive.
EUR/USD faces a minor resistance near at 1.0750

EUR/USD quickly left behind Wednesday’s small downtick and resumed its uptrend north of 1.0700 the figure, always on the back of the persistent sell-off in the US Dollar ahead of key PCE data on Friday.
Gold holds around $2,330 after dismal US data

Gold fell below $2,320 in the early American session as US yields shot higher after the data showed a significant increase in the US GDP price deflator in Q1. With safe-haven flows dominating the markets, however, XAU/USD reversed its direction and rose above $2,340.
Bitcoin price continues to get rejected from $65K resistance as SEC delays decision on spot BTC ETF options

Bitcoin (BTC) price has markets in disarray, provoking a broader market crash as it slumped to the $62,000 range on Thursday. Meanwhile, reverberations from spot BTC exchange-traded funds (ETFs) continue to influence the market.
US economy: slower growth with stronger inflation

The dollar strengthened, and stocks fell after statistical data from the US. The focus was on the preliminary estimate of GDP for the first quarter. Annualised quarterly growth came in at just 1.6%, down from the 2.5% and 3.4% previously forecast.
