Jack Steiman, On Not Yet Able to Stay Oversold (SwingTradeOnline.com)
The market started Monday with a gap up, and instead of giving that up, it ran higher until it tested the 20-day exponential moving average at 1947. The usual sellers came in at that level, but the bulls had created the gap they so badly needed and wanted. RSI's had gotten down to slightly below 30 on the Dow daily charts and a hair above 30 on the S&P 500 chart, setting up the market bounce.
In a bull market it takes a lot to stay below that 30 RSI, as on the first big sell down you usually get buyers. If, and when, we get down to those RSI's again, the market has a much better chance of staying oversold if not very oversold for an extended period of time. On the other hand, it can take more than two periods of getting oversold before things really stay oversold, so it's no slam dunk that we'll see a strong move down again once we get back to that 30 RSI level in the future.
Obey the laws of those RSI rules, but also recognize that sooner or later, meaning the more we test lower, the odds increase that we'll stay oversold. We're not there yet.
In the end, due to the gap in place, we now look for areas of support and resistance to be our guide. We have resistance on the S&P 500 daily chart at 1944 and 1947, which are the 50- and 20-day exponential moving averages, respectively. Below we have today's gap as strong support, or 1931. It's not easy here, folks, with all these gaps and areas of support and resistance. Unless the bears can remove the bottom of the gap on the S&P 500, you don't want to be too short, if short at all.
Failure from a higher level would be easier in terms of shorting. There is very little, if anything, to do right here. Keeping things extremely light is the way to go. The more you trade the harder it gets. These types of markets are best served being totally in cash or really, really close to that reality. Less is definitely more. Things will open up in time, but recognize what you're up against, if you're playing too much. Watch 1931 and 1947 short term. One day at a time for now.
Garrett Patten, On Follow-Through for Emini S&P 500 (ElliottWaveTrader.net)
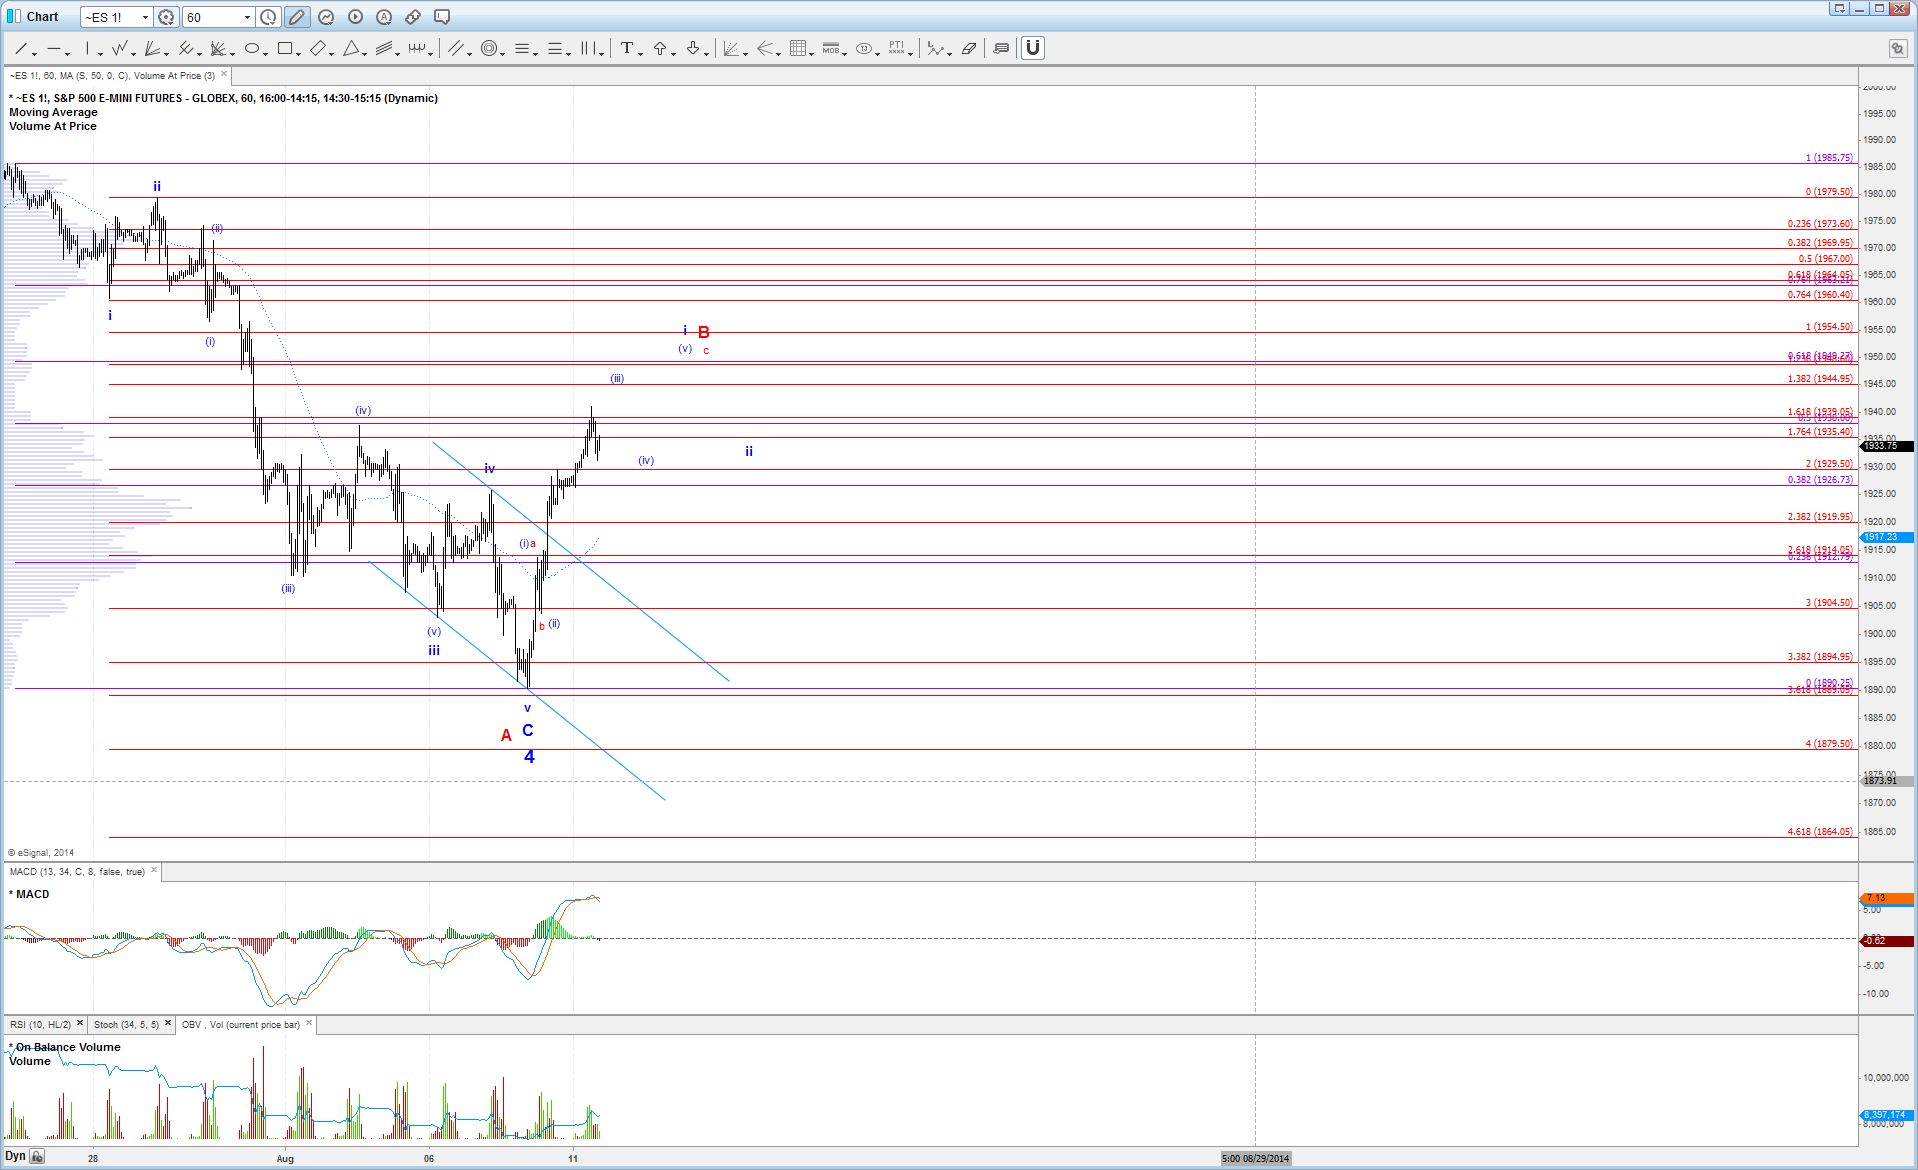
With the ES following through strongly on Monday, it has confirmed our expectation that a bottom was struck last week for a potential run to a new all-time high.
Under the bullish possibility that could take price to a new high, price should be close to completing or may have completed wave (iii) of i off the low (one more high tomorrow into the upper 1940s would be ideal to complete wave (iii) of i. 1929.50 followed by 1925.75 is micro support for this. Overall, wave i of 5 in the blue count should top between 1950 - 1960 before providing us with a pullback in wave ii. Keep in mind that almost every wave ii pullback this year has been very shallow (.236 - .382 retrace), so no reason to expect different this time.
1950 is important resistance though since it represents the .618 retrace of the decline off the July high. If we see this bounce fail there and turn down in impulsive fashion, then there will be concern that this rally was just a B-wave bounce in a larger 4th wave, and price is heading down to a new swing low in a C-wave.
However, until we see support break for the impulsive blue count, or other evidence that the market is not in the bullish posture that we think, assume that we are heading higher and eventually targeting a new all-time high from here.
Mike Paulenoff, On Relative Strength Work Favors GDX Over GLD (MPTrader.com)
The SPDR Gold Shares (GLD) vs Market Vectors Gold Miners ETF (GDX) ratio chart certainly looks like it has developed a 1-year top formation, which means that the relative strength in Gold (the metal) has peaked versus the Gold Miners.
Put another way, we can say that money increasingly is finding its way into the Gold Miners and out of Gold (within the gold sectors).
My sense from the chart is that the ratio line will head due South, suggesting strongly that the Gold Miners will continue to be the newly preferred vehicle to participate in Gold in the weeks ahead-- after years of under performance.
Harry Boxer, On 4 Charts to Watch (TheTechTrader.com)
It was a good trading day on Monday. Some of our stocks did okay. We had little scalp trades. There's lots going on, so let's look at some stocks that are acting well.
Achillion Pharmaceuticals, Inc. (ACHN), a swing trade of ours, popped in a significant surge that opened at 7.80 on Monday, got up to 7.96, backed off to 7.57, and closed at 7.59, up 23 cents, or 3.1%, on 4.5 million shares. It wasn't a great close, but the fact that it gapped up out of the wedge pattern leaves me to believe it could extent. If it can get through the 7.96 level, then it should tag 8 1/2, then 11.00 plus potentially. Once it gets going, you'll see it surge. I think there's not a lot of overhead resistance. So keep those targets in mind.
Celldex Therapeutics, Inc. (CLDX) has been up three consecutive days. The wedge was broken four days ago. It had a reversal two days ago, a run-up on Friday, and then on Monday, the breakout was right at, or just above, the 50-day, which should move this stock to the 16 area. If it makes it there, then we'll looking at 18 1/2. Once that happens, the base pattern is completed, and run away to 20-22. Let's not get ahead of ourselves, but this stock does seem to have the potential, especially if volume comes into it.
First Solar, Inc. (FSLR) has been acting very nicely of late. It had a big reversal four days ago, followed up on Thursday, had an inside day on Friday, and on Monday, it popped 1.34, or 1.9%, on 2.8 million shares. This stock has gone as high as over 70. Look for a test of 62-65 area, and may get as high as 74 plus. We would like to see some set-up to make this a swing trade to get First Solar to really run. The longer-term chart shows a beautiful trendline, it's narrowing a bit. Even if it does get at the top of this trendline, it could run up to 80-84.
OmniVision Technologies, Inc. (OVTI), a swing trade of ours, is acting very well. It continues to go up in a beautiful rising channel. On Monday, it was up another 99 cents, or 4.29%, on 1.3 million shares. It looks like it still has .a way to go to reach the top of the channel. It has to get through the 20-24 area. It got as high as 24.26 on Monday, before backing off, and closing at 24.05. We'll be watching this stock on Tuesday, because it could spike and take it up to 25-6. Targets are 27-8, and may get up to 29.
Other stocks on Harry's Charts of the Day are Achillion Pharmaceuticals, Inc. (ACHN), BioFuel Energy Corp. (BIOF), Bitauto Holdings Limited (BITA), Cheetah Mobile Inc. (CMCM), E-Commerce China Dangdang Inc. (DANG), GW Pharmaceuticals (GWPH), Himax Technologies, Inc. (HIMX), Jamba, Inc. (JMBA), Jumei International Holding Limited (JMEI), iKang Healthcare Group, Inc. (KANG), MIND C.T.I., Ltd. (MNDO), Nimble Storage, Inc. (NMBL), Raptor Pharmaceuticals Corp. (RPTP), SouFun Holdings Ltd. (SFUN), Sierra Wireless Inc. (SWIR), and Zendesk, Inc. (ZEN).
Sinisa Persich, On Free Stock Pick: BJRI (TraderHR.com)
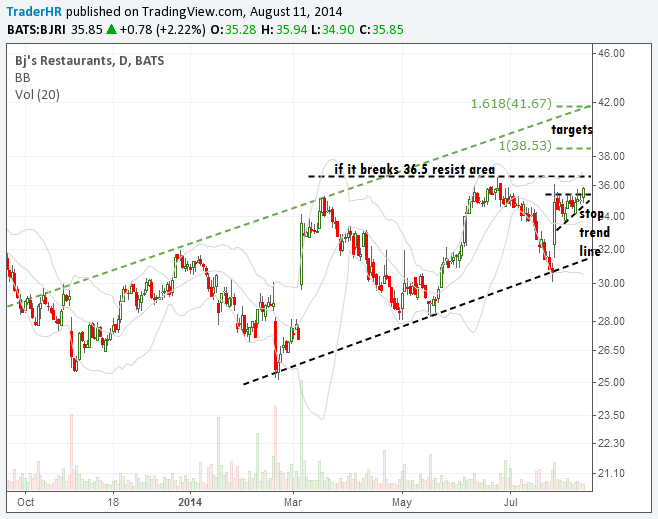
BJ's Restaurants, Inc. (BJRI), after a strong bounce from lower channel(support) trend line in late July, has been in a tight consolidation below horizontal resistance at 36.50.
If this level is broken in the coming days, price could accelerate toward the upper channel line (38-42 zone).
This Web site is published by AdviceTrade, Inc. AdviceTrade is a publisher and not registered as a securities broker-dealer or investment advisor either with the U.S. Securities and Exchange Commission or with any state securities authority. The information on this site has been obtained from sources considered reliable but we neither guarantee nor represent the completeness or accuracy of the information. In addition, this information and the opinions expressed are subject to change without notice. Neither AdviceTrade nor its principals own shares of, or have received compensation by, any company covered or any fund that appears on this site. The information on this site should not be relied upon for purposes of transacting securities or other investments, nor should it be construed as an offer or solicitation of an offer to sell or buy any security. AdviceTrade does not assess, verify or guarantee the suitability or profitability of any particular investment. You bear responsibility for your own investment research and decisions and should seek the advice of a qualified securities professional before making any investment.
Recommended Content
Editors’ Picks
AUD/USD remained bid above 0.6500

AUD/USD extended further its bullish performance, advancing for the fourth session in a row on Thursday, although a sustainable breakout of the key 200-day SMA at 0.6526 still remain elusive.
EUR/USD faces a minor resistance near at 1.0750

EUR/USD quickly left behind Wednesday’s small downtick and resumed its uptrend north of 1.0700 the figure, always on the back of the persistent sell-off in the US Dollar ahead of key PCE data on Friday.
Gold holds around $2,330 after dismal US data

Gold fell below $2,320 in the early American session as US yields shot higher after the data showed a significant increase in the US GDP price deflator in Q1. With safe-haven flows dominating the markets, however, XAU/USD reversed its direction and rose above $2,340.
Bitcoin price continues to get rejected from $65K resistance as SEC delays decision on spot BTC ETF options

Bitcoin (BTC) price has markets in disarray, provoking a broader market crash as it slumped to the $62,000 range on Thursday. Meanwhile, reverberations from spot BTC exchange-traded funds (ETFs) continue to influence the market.
US economy: slower growth with stronger inflation

The dollar strengthened, and stocks fell after statistical data from the US. The focus was on the preliminary estimate of GDP for the first quarter. Annualised quarterly growth came in at just 1.6%, down from the 2.5% and 3.4% previously forecast.

