Jack Steiman, On Following the Bouncing Nasdaq (SwingTradeOnline.com)
The market tried hard to sell decently on Monday. The Nasdaq was down over 30 points, thanks mostly to losses in Google Inc. (GOOG) and especially Apple Inc. (AAPL). Amazingly, even with heavily weighted AAPL down by as much as 10 points, the Nasdaq was able to bounce back. Strength is strength, and this market continues to find a way, even when a leader says I'm tired, such as AAPL did today.
You have to hand it to the bulls for finding a way to rotate things around even when the very best stock can't find a bid. One would expect a nice drop in the Nasdaq, but it was not to be. So we chop on, with sentiment not yet kicking in even though the spread is over 40%. No big push down, even though the weekly and monthly charts have major headaches.
So Monday was just another day in the process of a market that refuses to quit. Maybe with too many expecting the pullback, it may take higher prices to get folks to think it can't happen, until finally it does. Who knows. For now, the market has shown no inclination to start any major correction lower.
Monday was a very strange session, with yet further reason for concern the government may be manipulating the markets. The ISM Manufacturing Report come out 30 minutes into the trading session. The number was 53.2, below the expected number of 55.5. The market fell hard on that disappointment, but suddenly, out of nowhere, they came out and said whoops, we made a mistake. The number changed to 56.0, then lowered right to the expected number. Can't make it up. The market rallied on those upgrades, which was probably the primary reason as to why the market recovered. Listen folks, as I always say, don't play the market with emotion. Follow the bouncing Nasdaq. It's the leader or froth haven of the market. It has a powerful gap from 4204 down to 4186. As long as that gap holds the Nasdaq, the market is fine. It got down to 4207 today, and as one would expect, it bounced well from there. If and when we close below 4204 that's a red flag. If we close below 4186 that's a major league red flag. Follow price and that gap, and you'll be fine. Long exposure is fine above that full gap.
Mike Paulenoff, On Caution About Current Market Strength (MPTrader.com)
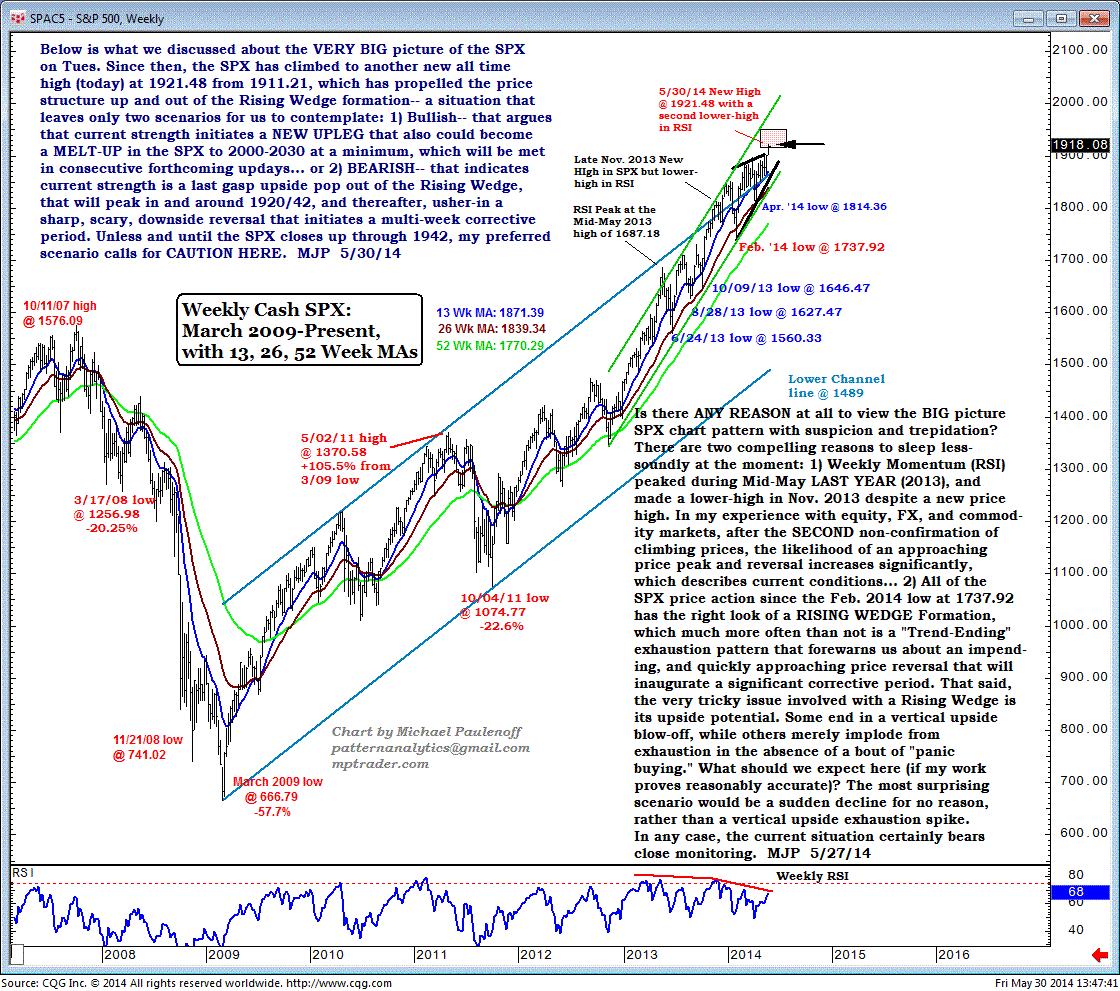
There are two compelling reasons to sleep less soundly at the moment with regard to the S&P 500.
One is that weekly momentum - as measured by the relative-strength index (RSI) - peaked during mid May 2013 and then made a lower high in November 2013, despite a new price high. In my experience with the equities, FX, and commodities markets, after the second non-confirmation of climbing prices, the likelihood of an approaching price peak and reversal increases significantly, which describes current conditions.
In addition, all of the SPX price action since the February 2014 low at 1737.92 has the right look of a rising wedge formation, which much more often than not is a "trend-ending" exhaustion pattern that forewarns us about an impending and quickly approaching price reversal that will inaugurate a significant corrective period.
That said, the very tricky issue involved with a rising wedge is its upside potential. Some rising wedges end in a vertical upside blow-off, while others merely implode from exhaustion in the absence of a bout of "panic buying."
In fact, the index on Friday broke above the upper trendline of the rising wedge, which bulls might argue could become a melt-up in the SPX to 2000-2030. On the other hand, current strength very well could be a last-gasp upside pop that will peak in and around 1920/42, and thereafter usher in a sharp, scary downside reversal that traps the bulls and initiates a multi-week corrective period.
Unless and until the SPX closes up through 1942, my preferred scenario calls for caution here.
Avi Gilburt, On Has Wave IV Begun? (ElliottWaveTrader.net)
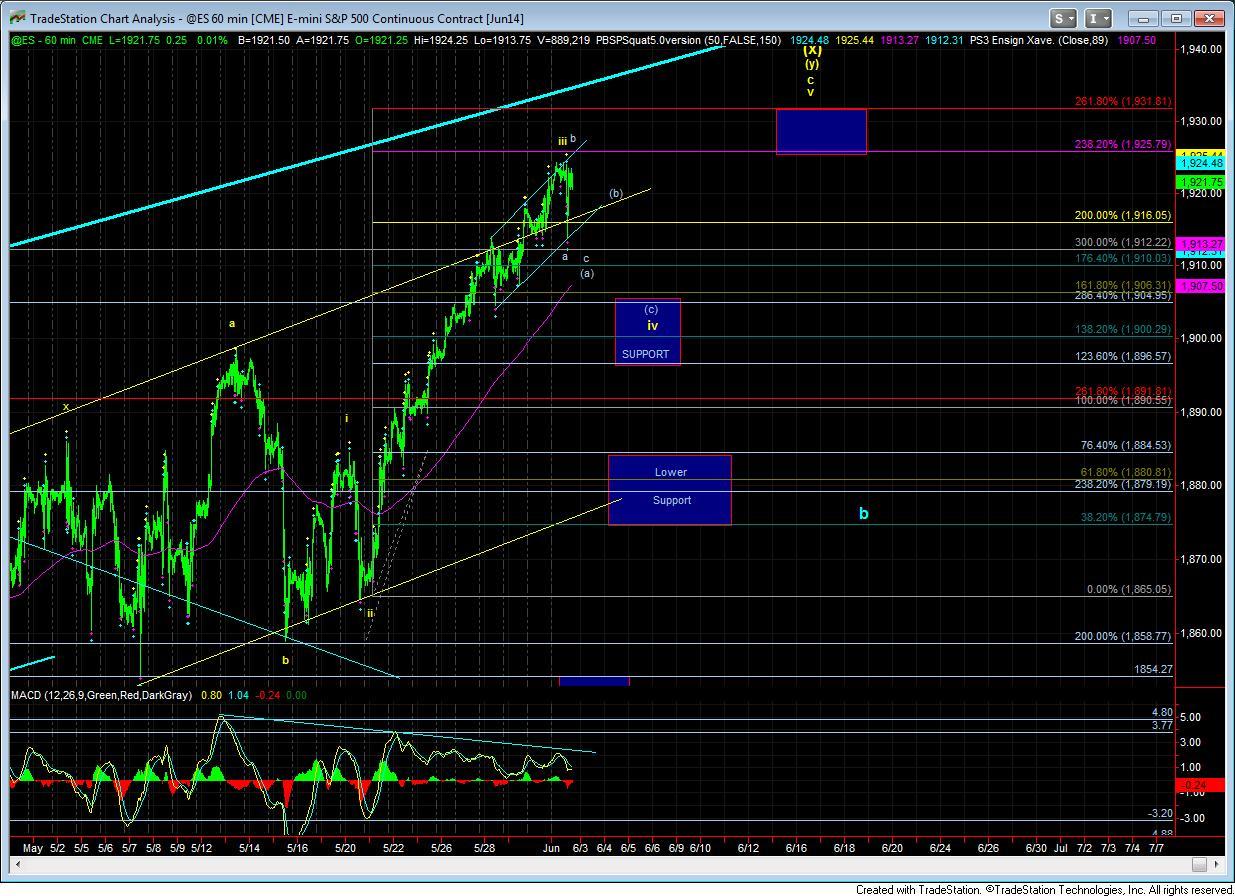
With the break down seen early in the day, the market may have given us our first signal that wave iv has begun. After the drop this morning, the market rallied back in a way one can count as the start of an impulsive count. However, by the time I am writing this, we only have 3 waves up off that low, which I am now counting as a b-wave high, which would follow through in a c-wave down to complete only the (a) wave of wave iv.
Alternatively, the consolidation in the middle of the day really seemed too large to be a 4th wave, so if we do head higher towards 1925ES, then I would probably assume that it would be a b-wave higher high, since the consolidation today best counts as a b-wave in my opinion than a 4th wave, simply because of its relative size to the rally.
Assuming we do see downside follow through tomorrow, that drop could be all of wave iv, but it just seems too small from a timing and wave size perspective that this would be all of wave iv. Therefore, if the market should bounce off the next low, and simply rise in a corrective fashion, ideally maintaining below the yellow uptrend line, then I would expect the next move to be down in a (c) wave to complete wave iv. And, this action should really take the remainder of this week.
Sinisa Persich, On 2 Breakouts to Watch (TraderHR.com)
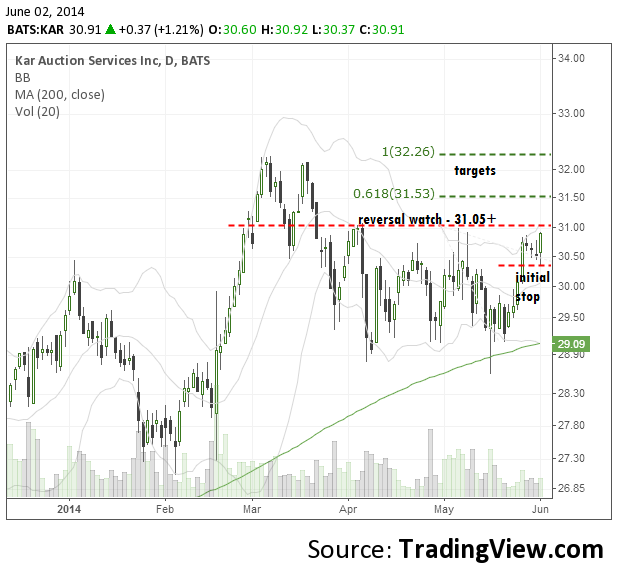
KAR Auction Services, Inc. (KAR) is potential reversal trade if it breaks 31 horizontal resistance.
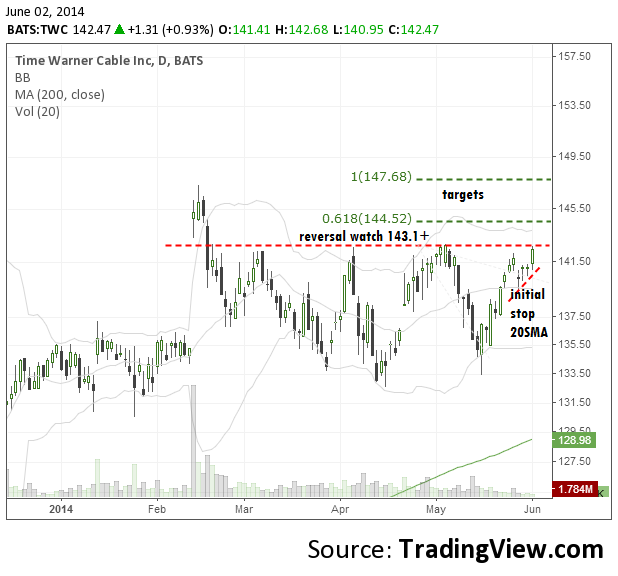
Time Warner Cable Inc. (TWC) also is a possible reversal on a move above its 3-month horizontal resistance level at 143.
Harry Boxer, On 2 Longs & 2 Shorts to Watch (TheTechTrader.com)
It was an odd day on Wall Street on Monday, as the indices were up, then came back down, then up. As we wait to see if there is any follow-through on Tuesday, we're going to look at longs and shorts here.
Hawaiian Holdings Inc. (HA), or Hawaii Air, has a spectacular rising channel. Its chart is similar to American Airlines Group Inc. (AAL), Delta Air Lines Inc. (DAL), and Alaska Air Group, Inc. (ALK). It broke out on Monday, up 36 cents, or 2.3%, on 1.2 million shares. This stock may edge into the 19 area, which is the target.
Vertex Energy, Inc. (VTNR), which we've been watching for a while, is a beautiful chart. It has been moving dramatically just in the last two weeks, going from 7 1/2 to 11 1/4, or almost 50%. Let's watch this one to see if gets an extension and the momentum carries it up toward 14.
Stocks on the Short Side...
DexCom, Inc. (DXCM) had been in a big rising channel before its breakdown in March. It has formed several bear flags, and then a rising bear flag that is rolling over again, down 52 cents, or 1.5%, on Monday. If it drops underneath the 31 range, it may continue down to the 26-27 zone.
Silicom Ltd. (SILC) rolled over in February, then formed a mini bear flag, or wedge, before forming a larger wedge. On Monday, it dropped 1.07. This stock could quickly be headed down toward 21, which is the next target on this one.
Other stocks on Harry's Charts of the Day are Broadcom Corp. (BRCM), Giga-tronics Inc. (GIGA), Inteliquent, Inc. (IQNT), Jumei International Holding Limited (JMEI), Magnegas Corporation (MNGA),
Stocks on the short side include Engility Holdings, Inc. (EGL), Medidata Solutions, Inc. (MDSO), Moneygram International Inc. (MGI), Marketo, Inc. (MKTO), NeuStar, Inc. (NSR), and Nu Skin Enterprises Inc. (NUS).
This Web site is published by AdviceTrade, Inc. AdviceTrade is a publisher and not registered as a securities broker-dealer or investment advisor either with the U.S. Securities and Exchange Commission or with any state securities authority. The information on this site has been obtained from sources considered reliable but we neither guarantee nor represent the completeness or accuracy of the information. In addition, this information and the opinions expressed are subject to change without notice. Neither AdviceTrade nor its principals own shares of, or have received compensation by, any company covered or any fund that appears on this site. The information on this site should not be relied upon for purposes of transacting securities or other investments, nor should it be construed as an offer or solicitation of an offer to sell or buy any security. AdviceTrade does not assess, verify or guarantee the suitability or profitability of any particular investment. You bear responsibility for your own investment research and decisions and should seek the advice of a qualified securities professional before making any investment.
Recommended Content
Editors’ Picks
EUR/USD stays below 1.0700 after US data

EUR/USD stays in a consolidation phase below 1.0700 in the early American session on Wednesday. The data from the US showed a strong increase in Durable Goods Orders, supporting the USD and making it difficult for the pair to gain traction.
USD/JPY refreshes 34-year high, attacks 155.00 as intervention risks loom

USD/JPY is renewing a multi-decade high, closing in on 155.00. Traders turn cautious on heightened risks of Japan's FX intervention. Broad US Dollar rebound aids the upside in the major. US Durable Goods data are next on tap.
Gold trades on the back foot, manages to hold above $2,300

Gold struggles to stage a rebound midweek following Monday's sharp decline but manages to hold above $2,300. The benchmark 10-year US Treasury bond yield stays in the green above 4.6% after US data, not allowing the pair to reverse its direction.
Worldcoin looks set for comeback despite Nvidia’s 22% crash Premium

Worldcoin price is in a better position than last week's and shows signs of a potential comeback. This development occurs amid the sharp decline in the valuation of the popular GPU manufacturer Nvidia.
Three fundamentals for the week: US GDP, BoJ and the Fed's favorite inflation gauge stand out Premium

While it is hard to predict when geopolitical news erupts, the level of tension is lower – allowing for key data to have its say. This week's US figures are set to shape the Federal Reserve's decision next week – and the Bank of Japan may struggle to halt the Yen's deterioration.


