Jack Steiman, On Bull-Bear Spread at High Risk (SwingTradeOnline.com)
We have had two historical readings of the bull-bear spread being over 40%. In April of 2011, we had a reading of 41.6%, before the market crashed out to the tune of nearly 23%. In October of 2007, we had a spread of 42.6%, which took the market down to the tune of over 50%.
Yes, that's OVER 50%. We are very close to either of those two numbers, but we have Fed protection, so how much we ultimately fall and when it begins is unclear. We'll get the new readings late tomorrow or early Wednesday morning. So yes, the risk is high. Just know that as a reality and adjust accordingly, but hang in there until we get a weekly engulfing candle on the S&P 500.
With so many sectors looking beautiful, such as the financial sector and the railroad sector, to name just a couple, it's hard to imagine the market just giving it up without a major fight. It will try to fight, but folks, you have to understand that there's only so far you can stretch this rubber band before it gives it up.
So how do we deal with that? Well, first of all, you play with a far greater level of safety. You do that two ways. Not playing high-beta froth stocks and avoiding the stocks with ridiculous P/E levels. Those are the ones that will take the largest hit when the selling does eventually hit this market. Lower P/E stocks and lower beta stocks will be the places folks go to hide while the market does its dirty deed.
Play however you want, but understand what you're up against should you wake up one morning and the futures are annihilated. If you're not playing safely, you will take an unnecessary hit. Greed is always fun, but it has no place here. So yes, many areas still look great with no sign of any topping weekly sticks. That's great, but that doesn't mean you should let your guard down. Be smart and play properly.
Good news is still good news and bad news is still bad news this earnings season.
Stocks are getting rewarded and breaking out, and once they back test those breakouts they are moving higher again. That, too, should be the way you play the market for the short-term if not the long-term. Keep track of those stocks that were rewarded. Wait for them to slightly unwind, and then get after them to the long side.
When good news starts to be treated poorly it's time to take cover, but that's not the case for the most part now. Keep your eye on the bigger picture, and find ways to keep in the game in a safe manner. Bigger picture, as long as 1730 holds the trend overall is higher. If that goes away the sentiment headache is upon us in full force.
Avi Gilburt, Silver & Gold Still Stuck in Neutral (ElliottWaveTrader.net)
Amazingly, metals had another week of being "stuck in the middle."
There has been a lot of anticipation for a move in the metals, but nothing has really changed over the last week. So, nothing has really changed in my analysis from last week. But, I do believe that we should see a resolution of these patterns play out over the next week.
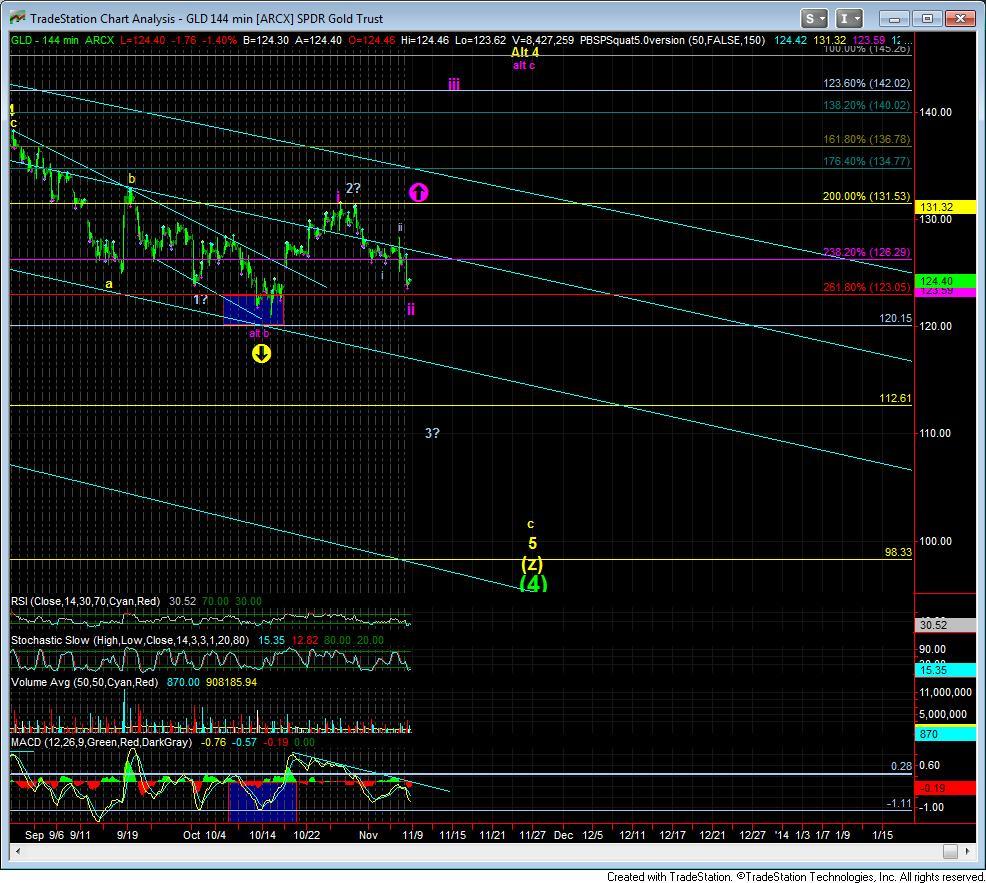
Early in the week, I continually noted that the SPDR Gold Shares (NYSEARCA:GLD) -- hich we have been using as our metals proxy -- had to bust through the 131.50 region initially before it signaled a potential break out. So, as long as the market can maintain support over the 123 region, and the MACD can turn up, I still think we can see a rally take us towards the 145 region. In fact, a drop down towards the 123 region gives us a target for a 5 wave structure that has a 2.00 extension right at 145.
However, if the market is unable to hold that 123 region, and breaks down below the 119 level, I am going to view this as wave 3 down which will likely not stop until we hit at least the 112 region.
So, the only thing that has changed in our plans at this time is that, if you are still short the metals from the last highs in August, then you probably should cover your shorts if we see a strong break out over the 131.50 region in GLD.
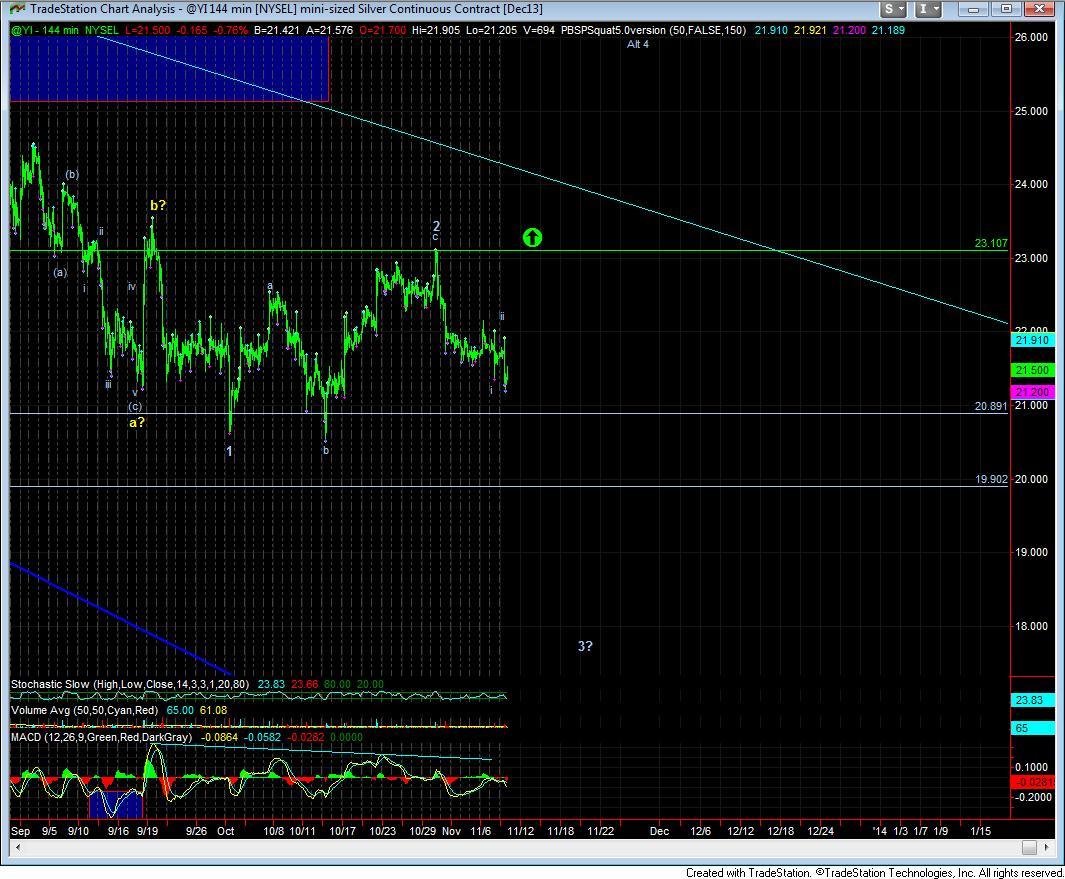
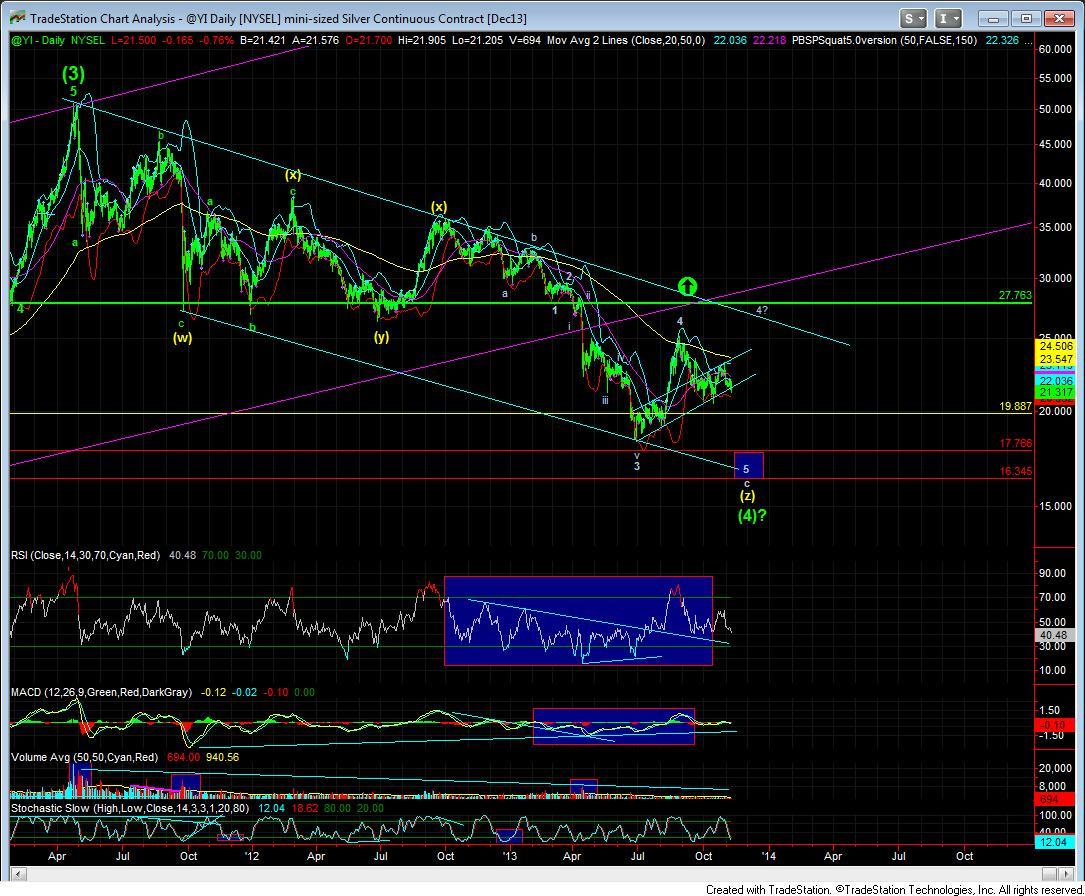
As for silver, the relevant resistance region is now the 23.11 level in the Mini Silver Futures Contract (NYSEL:YI), and a strong move through that region which follows through the August high will be pointing us into the 27 region.
There is one further thought that I did have over the last week. It is entirely possible that the market simply consolidates in a b-wave triangle between 120-131 in the GLD through the month of November. In fact, it would provide us with a consolidation that would take us from one side of the current down trend channel to the other through the month. So, if the next move higher is on very weak volume, and we are unable to move through the 131.50 level, and fall back once more later this month, this would become a very strong possibility to watch through the month of November.
But, again, I am still not convinced that the absolute lows have been seen in the metals just yet, but will be open to that possibility in the event the market does provide us with evidence of such on the next rally.
Mike Paulenoff, On Playing the DXD for a Downside Trade (MPTrader.com)
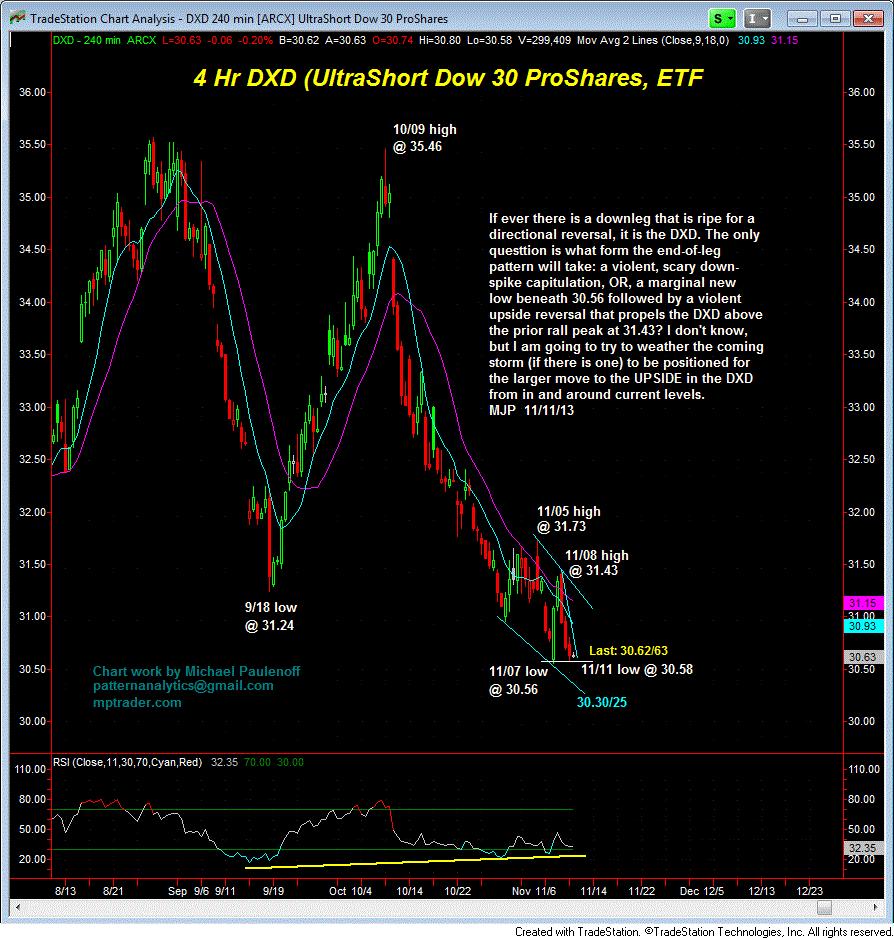
If ever there is a down-leg that is ripe for a directional reversal, it is the UltraShort Dow 30 ProShares ETF (DXD). The only question is what form the end-of-leg pattern will take: a violent, scary down-spike capitulation OR a marginal new low beneath 30.56 followed by a violent upside reversal that propels the DXD above the prior rally peak at 31.43?
I don't know, but I am going to try to weather the coming storm (if there is one) to be positioned for the larger move to the upside in the DXD from in and around current levels.
Garrett Patten, On Nikkei Stepping in Right Direction for Bulls (ElliottWaveTrader.net)
Our wave analysis indicates Japan is looking up, while Europe's direction is less clear.
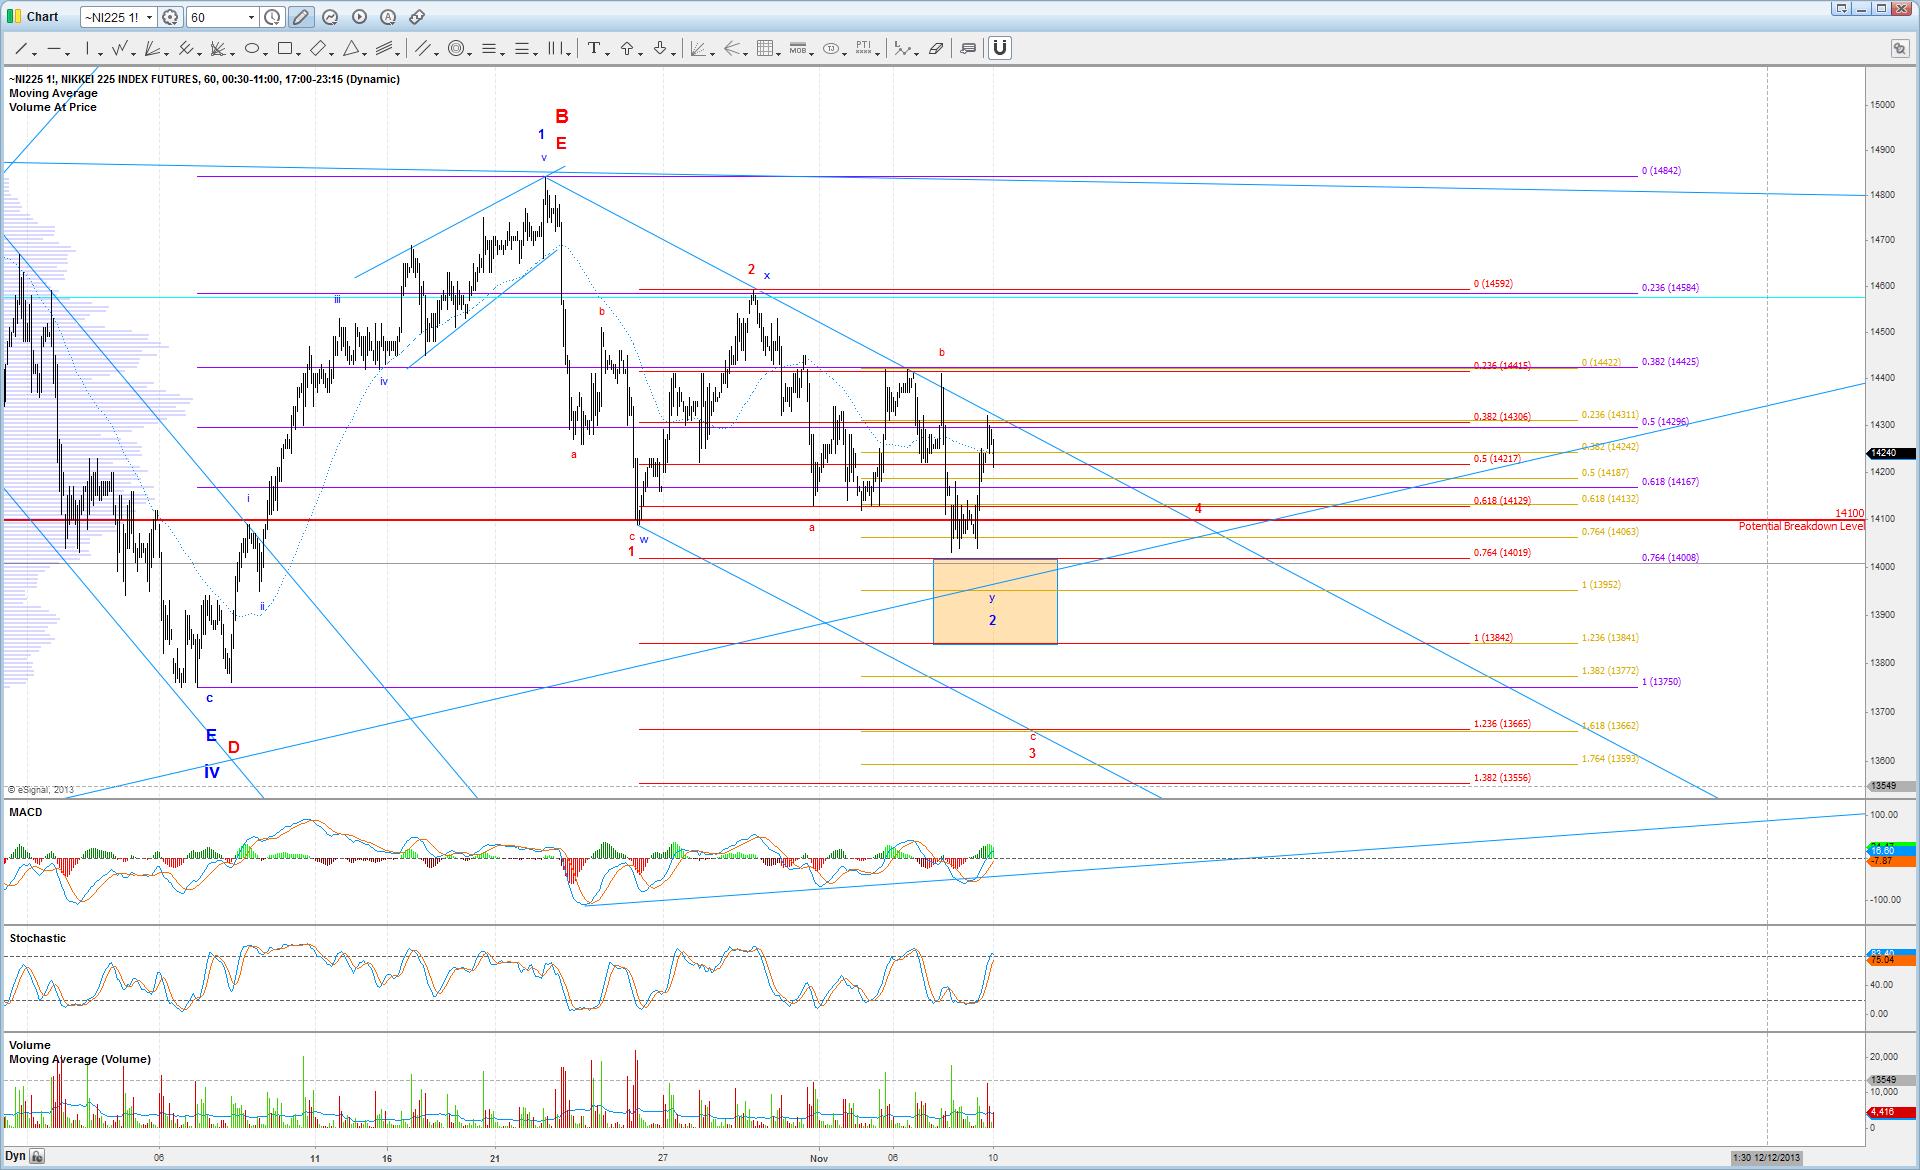
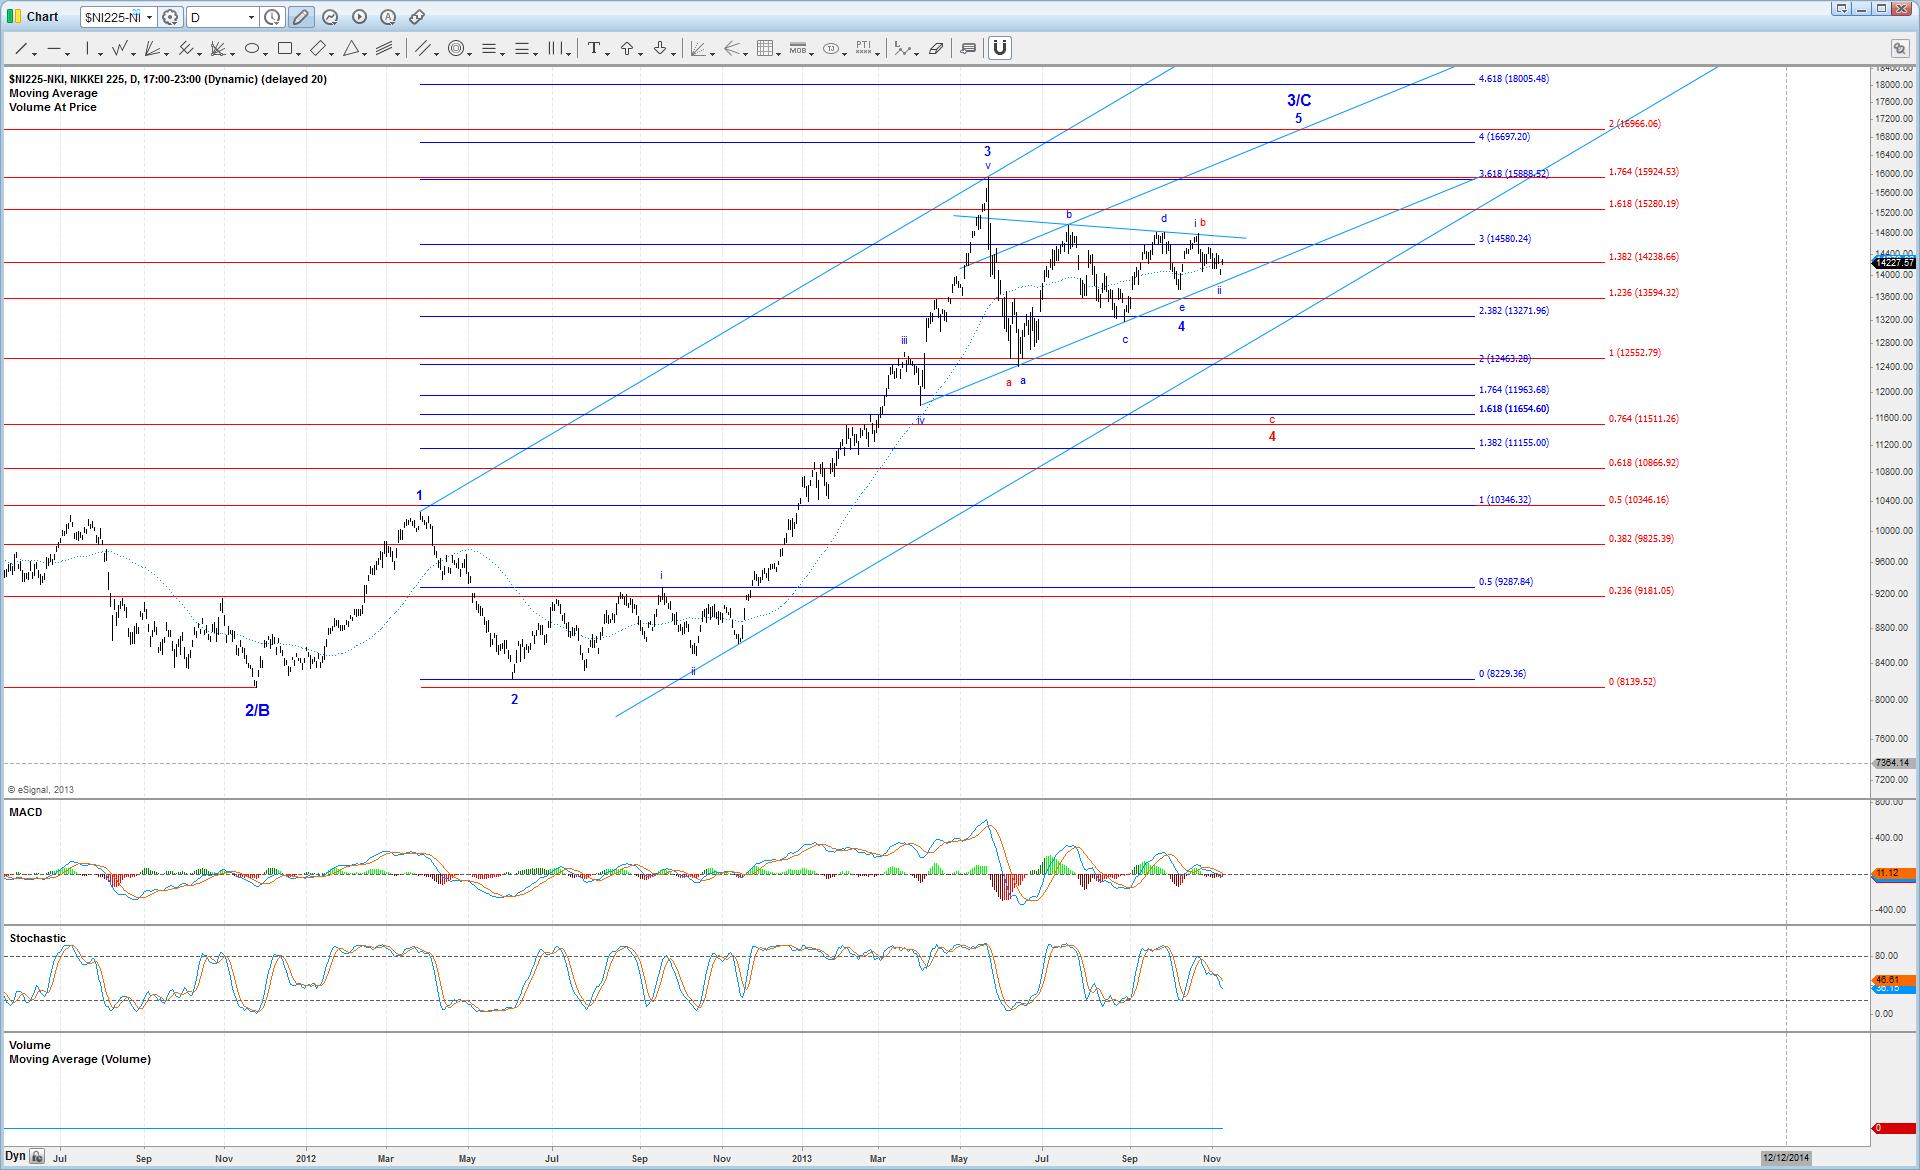
Friday's rally in the Nikkei 225 Futures was a very interesting development, as it was a decisive blow against the immediately bearish red count that placed price in a wave iii of 3 down. While new lows below the one made in June can still be seen, it now seems that the only way to get there is if a leading diagonal to the downside completes.
This is definitely a step in the right direction for the bulls, since it has reduced the likelihood of the red count slightly. As mentioned in the previous update, the "last stand" support for the bulls is illustrated by the orange box, between 14020 - 13840. This most recent low came just shy of the upper range of this support region, roughly the .764 retrace of the October rally.
In order to confidently consider the bottom of wave 2 in the blue count as complete already, then price should stay above 14180 and then push above the downward trendline providing resistance just above, otherwise the support region below in orange may be tested again.
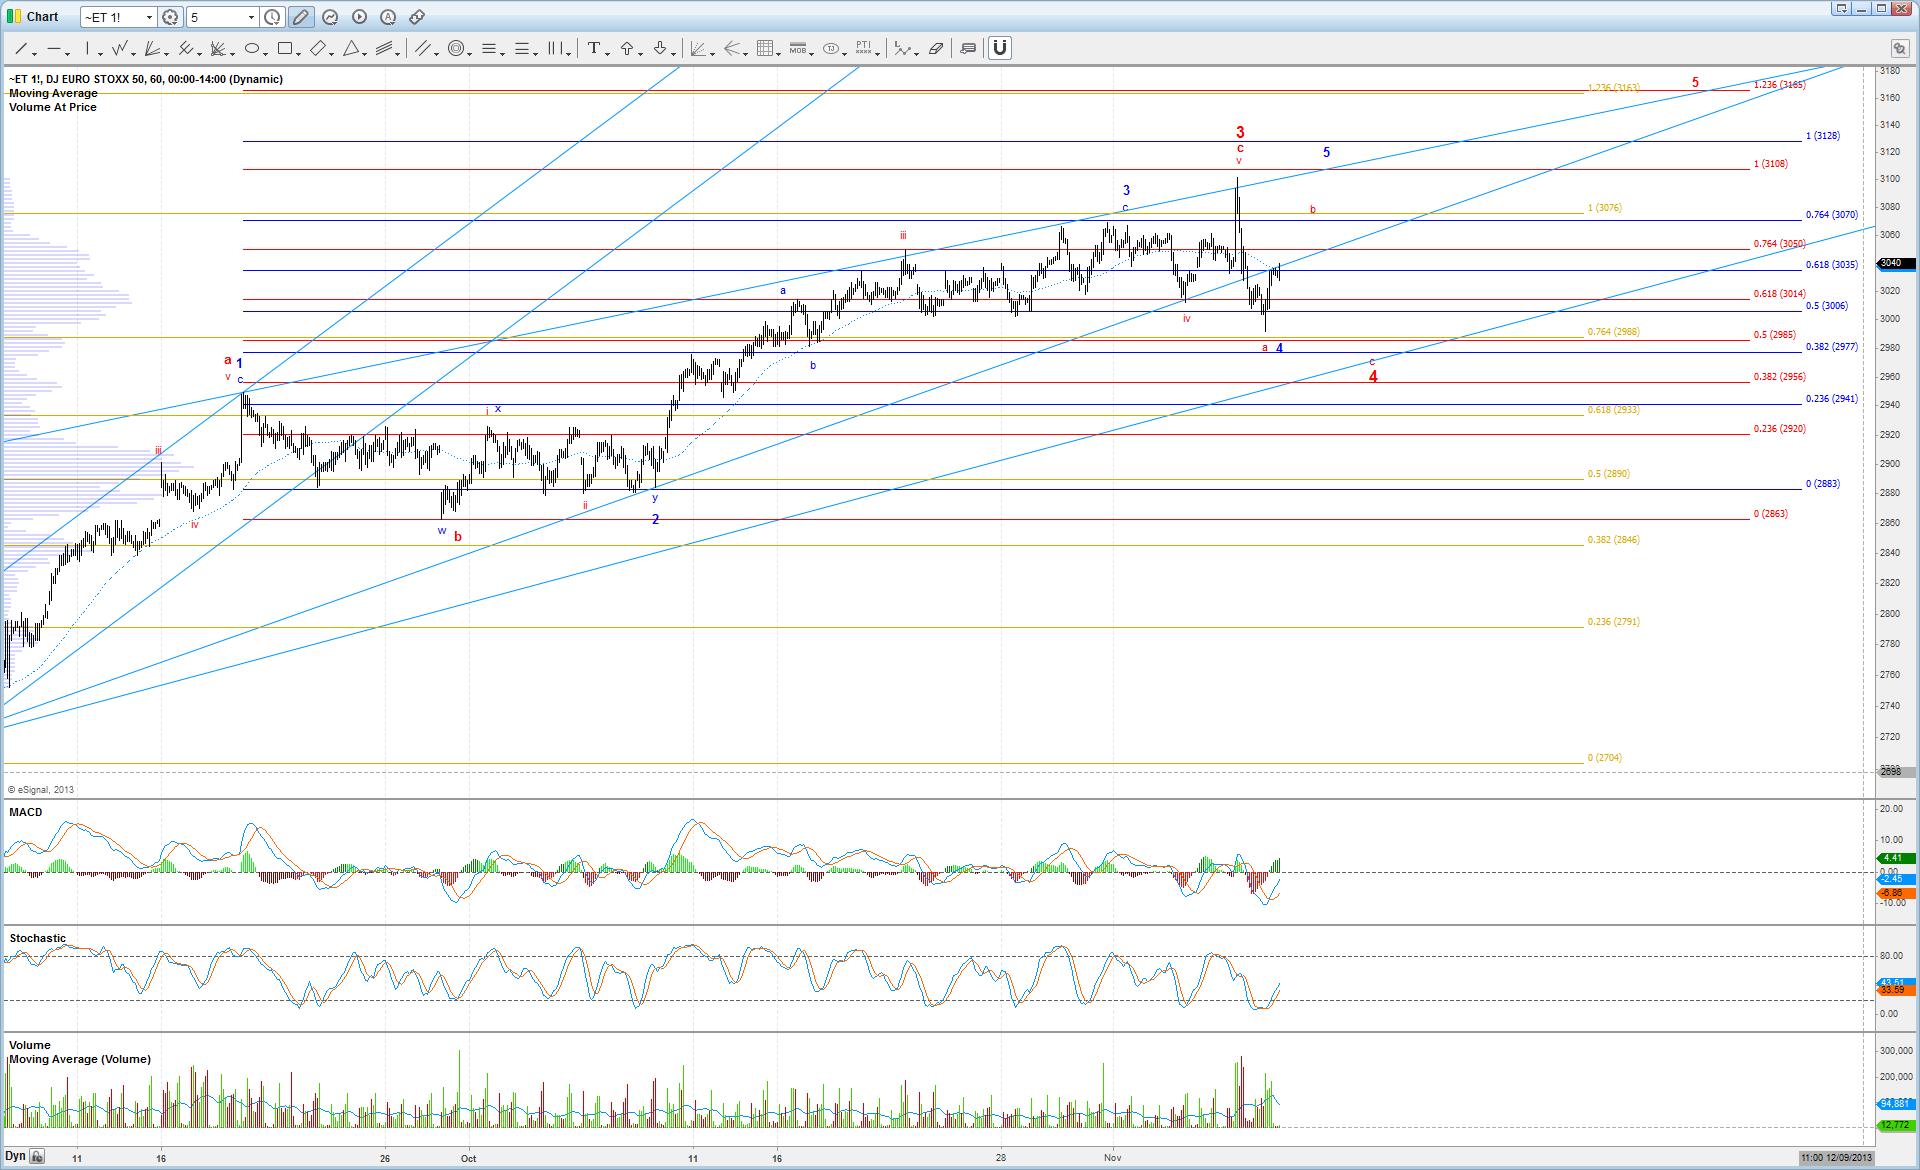
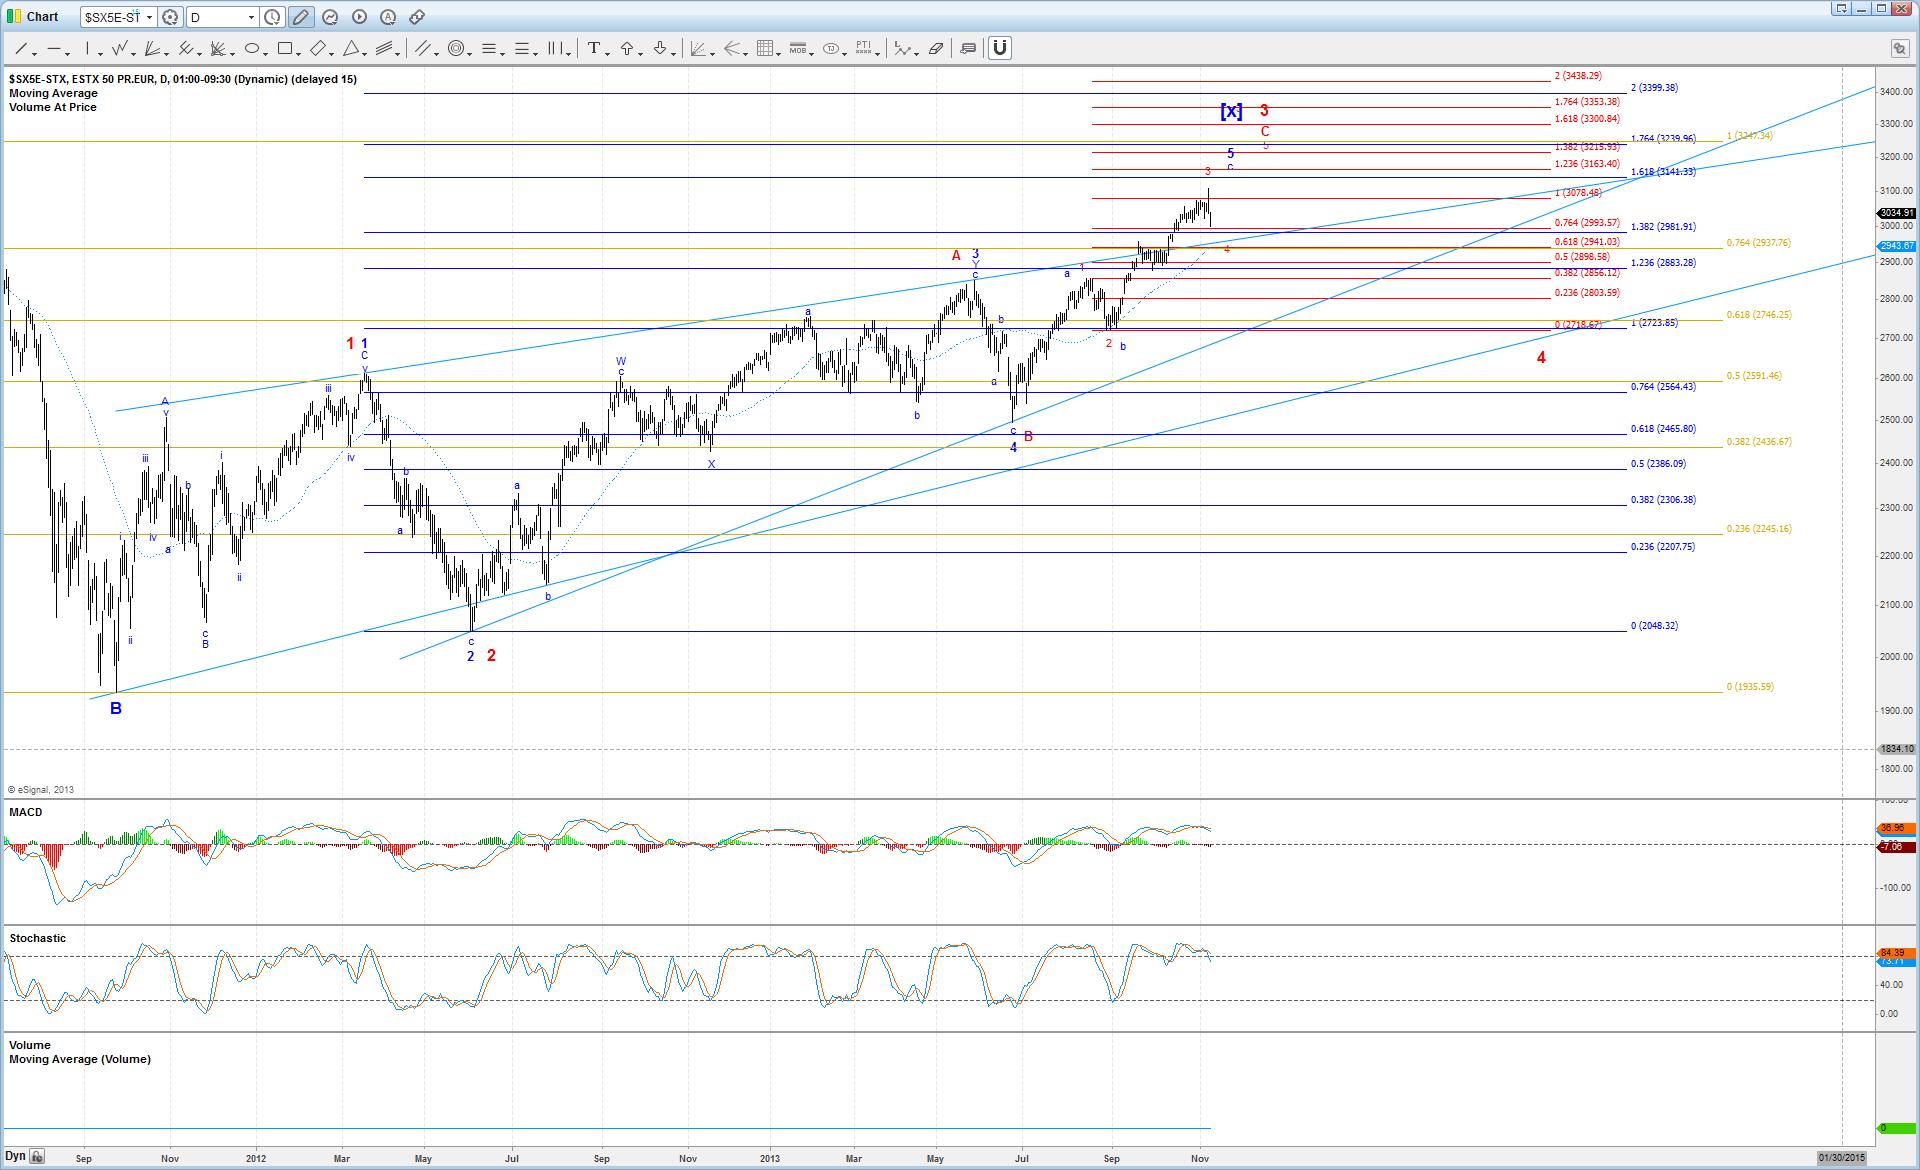
As for the Euro STOXX 50, while the potential exists that wave 3 under the red count is not complete yet, the much more likely scenario is that price is either in a corrective b-wave bounce of 4 under the red count, or if heading to a new high, in wave 5 of the blue count.
Currently, price is sitting just under the trendline support that broke down last week, so it should act as immediate resistance above. Above that, roughly 3070 is the last resistance before new highs become likely.
New highs would be suggestive of the blue count, and target between 3108 and 3165. Support for wave 4 under the red count is 2958 - 2955.
Harry Boxer, On 4 Charts to Watch (TheTechTrader.com)
It was a pretty good trading day on Wall Street on Monday despite the sloppiness and mixed nature of the indices. So we'll keep looking at the long side until the market tells us something different.
3D Systems Corp. (DDD) has been moving phenomenally the past four weeks, going from 47 to 77, 30 points almost straight up, except for a little bit of consolidation and reversal at one point. It's now been up for the last 10 days, and looks like it wants to run up to the mid-to-high 80's, and then the low 90's.
First Solar, Inc. (FSLR) is looking a lot better. It's right at mid-channel now. If it should accelerate, it could get up to the low-to-mid 70's short-term, and even as high as 90 on an intermediate-term basis.
Gogo Inc. (GOGO) had a major breakout on Monday after the quarterly results came out. It gapped up, ran hard, closed not too far off the high, up 5.40, or 29%, on 6 million shares. That's the biggest volume since it went public. Look for a follow-through to get this one up to 27.
Orion Energy Systems, Inc (OESX) had a nice follow-through day on Monday. It broke out on Thursday, again on Friday, and then on Monday, it had another great day, up 33 cents, or 6.1%, on nearly a half million shares. It's gone from 4.25 to 5.79 in the last few sessions. It looks like there's more to go. Look for something up around 6 1/4-1/2 on a short-term basis.
Other stocks on Harry's Charts of the Day are Adept Technology Inc. (ADEP), CardioNet, Inc. (BEAT), Chelsea Therapeutics International Ltd. (CHTP), GT Advanced Technologies Inc. (GTAT), Gray Television Inc. (GTN), Himax Technologies, Inc. (HIMX), JinkoSolar Holding Co., Ltd. (JKS), Omega Protein Corporation (OME), Organovo Holdings, Inc. (ONVO), VisionChina Media Inc. (VISN), and Zhone Technologies Inc. (ZHNE).
Sinisa Persich, On Watching AMBC, EXPE, GTI & JKS (TraderHR.com)
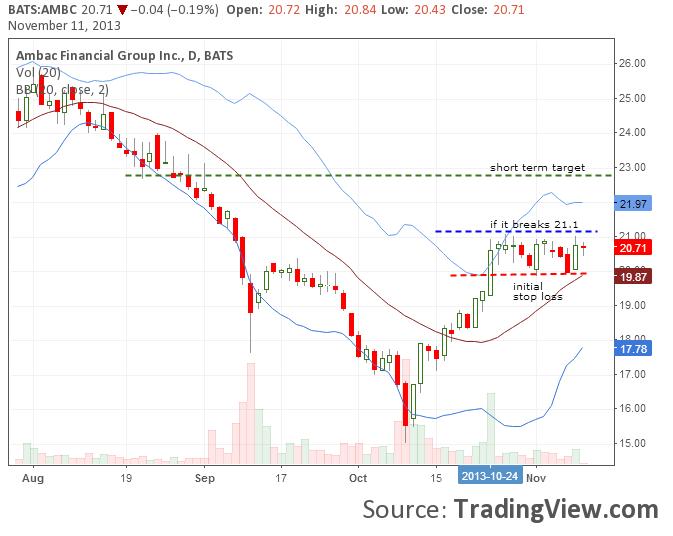
Ambac Financial Group, Inc. (AMBC) is flagging after an October run-up from 15 1/2 to near 21. Our initial stop-loss is at the bottom of the sideways channel at 19.87, while a breakout above 21.10 could get the stock up to our short-term target near 23.
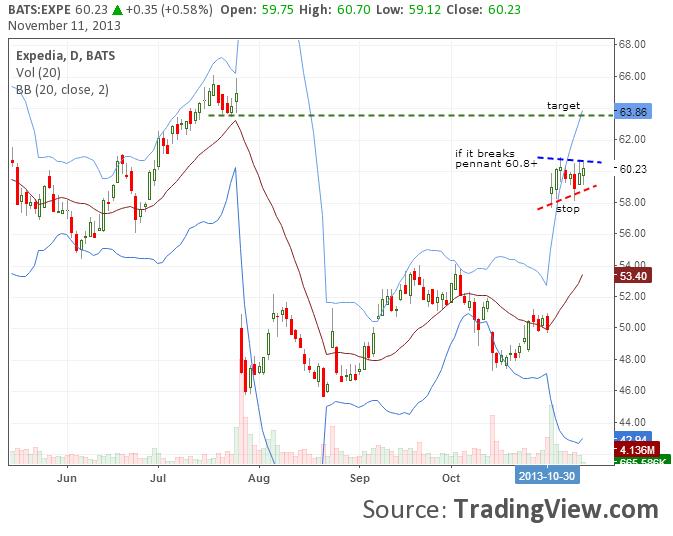
Expedia Inc. (EXPE) is in a pennant off the nearly 20% up-gap from 49.96 to 58.97 on October 31. A break of 60.80 could get it quickly to our target of 63.86.
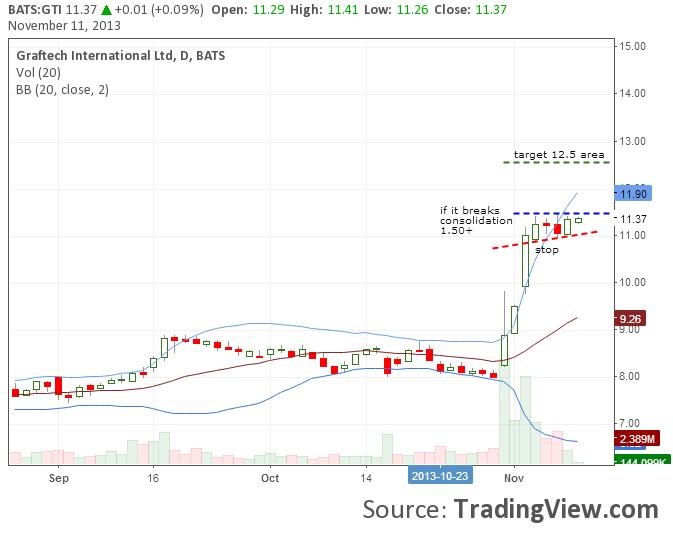
GrafTech International Ltd. (GTI) also is consolidating a huge recent move, from 8 on Oct 30 to 11 on Nov 4. A break of this consolidation zone could get the stock up to 12.50.
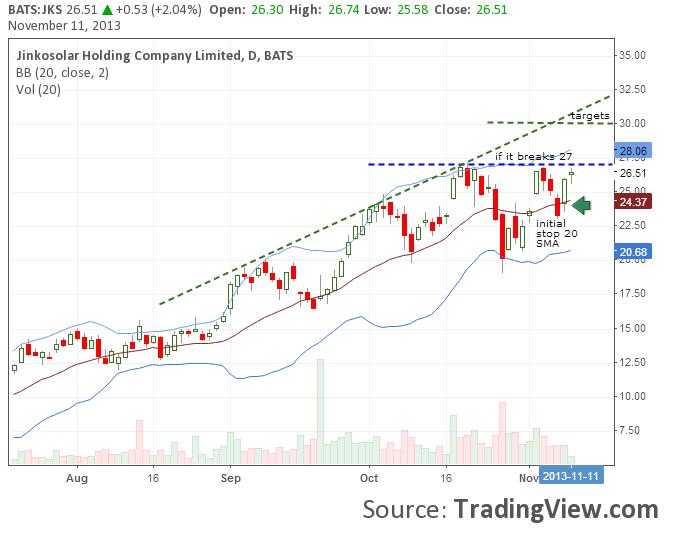
JinkoSolar Holding Co., Ltd. (JKS) is up against a resistance in the 26 3/4 area. A break of 27 could move the stock another 10%+ to our target of 30. Initial stop is 24.37 at the 20-day simple moving average.
This Web site is published by AdviceTrade, Inc. AdviceTrade is a publisher and not registered as a securities broker-dealer or investment advisor either with the U.S. Securities and Exchange Commission or with any state securities authority. The information on this site has been obtained from sources considered reliable but we neither guarantee nor represent the completeness or accuracy of the information. In addition, this information and the opinions expressed are subject to change without notice. Neither AdviceTrade nor its principals own shares of, or have received compensation by, any company covered or any fund that appears on this site. The information on this site should not be relied upon for purposes of transacting securities or other investments, nor should it be construed as an offer or solicitation of an offer to sell or buy any security. AdviceTrade does not assess, verify or guarantee the suitability or profitability of any particular investment. You bear responsibility for your own investment research and decisions and should seek the advice of a qualified securities professional before making any investment.
Recommended Content
Editors’ Picks
AUD/USD remained bid above 0.6500

AUD/USD extended further its bullish performance, advancing for the fourth session in a row on Thursday, although a sustainable breakout of the key 200-day SMA at 0.6526 still remain elusive.
EUR/USD faces a minor resistance near at 1.0750

EUR/USD quickly left behind Wednesday’s small downtick and resumed its uptrend north of 1.0700 the figure, always on the back of the persistent sell-off in the US Dollar ahead of key PCE data on Friday.
Gold holds around $2,330 after dismal US data

Gold fell below $2,320 in the early American session as US yields shot higher after the data showed a significant increase in the US GDP price deflator in Q1. With safe-haven flows dominating the markets, however, XAU/USD reversed its direction and rose above $2,340.
Bitcoin price continues to get rejected from $65K resistance as SEC delays decision on spot BTC ETF options

Bitcoin (BTC) price has markets in disarray, provoking a broader market crash as it slumped to the $62,000 range on Thursday. Meanwhile, reverberations from spot BTC exchange-traded funds (ETFs) continue to influence the market.
US economy: slower growth with stronger inflation

The dollar strengthened, and stocks fell after statistical data from the US. The focus was on the preliminary estimate of GDP for the first quarter. Annualised quarterly growth came in at just 1.6%, down from the 2.5% and 3.4% previously forecast.
