Jack Steiman, On Market Celebrates Likely Continuation of Fed Liquidity Machine (SwingTradeOnline.com)
The market on Monday celebrated the news that came out over the weekend when Larry Summers said he was no longer interested in being head of the Fed.
Futures were up huge Sunday night with the Dow up over 220 points when adding in pre-market fair value. We basically opened on the high and faded slowly but surely for the rest of the day. The Nasdaq closed over 40 points off the high. The pullback was not shocking since intraday RSI's reached over 80 on the Dow and near 80 on the S&P 500. The Nasdaq closed near the lows with the Dow and S&P 500 holding onto respectable gains, although they too closed well off the highs. Anyone who bought the market open took losses for the day.
Monday was yet just another day in this meandering market trading in quite a large range between 1627 at the bottom and 1710 at the top. Bulls did do some damage, but they were unable to clear 1710 key resistance. Thus, we will likely trade on news events in the days ahead. Until 1627 or 1710 gets taken over with force, no one is truly in control for the short-term.
With Ms. Yellin expected to succeed Mr. Bernanke and carry on his "free cash" policies, it's no surprise that the financials got a decent bid for the day. Money flowed out of technology and into financials because traders see that area as being the biggest beneficiary on the news. That said, this market keeps doing the one thing that keeps the bull going. Traders are finding places to hide even when things get overbought or when a sector or two are out of favor. Rotation, rotation and more rotation and that's the key to a strong bull market.n
News is key for the market now, and we'll get that in a big way on Wednesday when we hear from the Fed. It makes sense to see some selling if there's even a hint of pulling back on the those free dollars.
With the S&P 500 closing below 1710 due to the late day pullback, that level remains the key level of resistance for now. If we can clear 1710 with some force, we can get to that long-term up-trend line at 1730. Neither one will be easy to clear, especially 1730 if we ever got there. The market would be very overbought, and it's very rare for those long-term trend lines to clear on the first try. They can back and fill while trying to break through, but may take many attempts before getting through, if indeed we eventually do get through. 1674/1672 is gap support on pullback's now.
Some exposure makes sense. Too much does not at these nose bleed levels.
Mike Paulenoff, On VIX Continues to Warn About SPX (MPTrader.com)
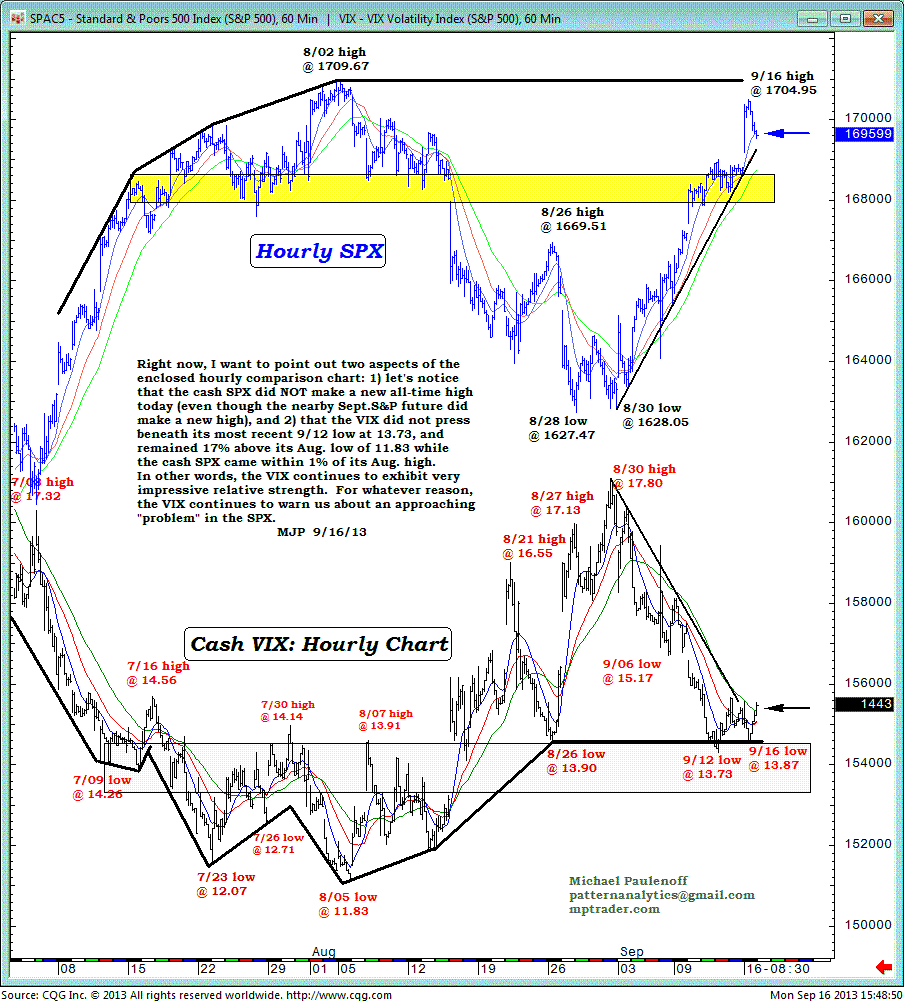
Right now I want to point out two aspects of the hourly comparison charts of the S&P 500 (SPX) and the VIX.
First let's notice that the cash SPX did not make a new all-time high today (even though the nearly S&P 500 futures did). Meanwhile, the VIX did not press beneath its most recent, September 12 low at 13.73.
Also, the VIX remained 17% above its August low of 11.83%, while the SPX came within 1% of its August high.
In other words, the VIX continues to exhibit very impressive relative strength. For whatever reason, the VIX continues to warn us about an approaching "problem" in the SPX.
Avi Gilburt, On Bulls Fail to Solidify Case (ElliottWaveTrader.net)
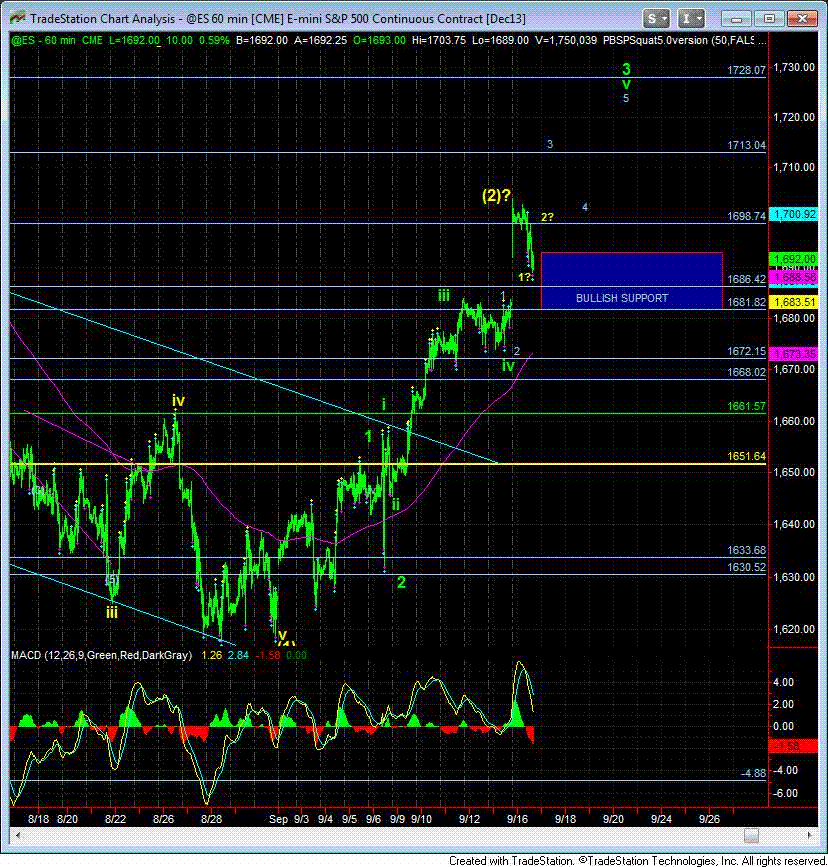
This is some of the most unusual market action I have seen in a long time. With the large gap up overnight, the market failed to present the most bullish case with an appropriate consolidation and then taking off to new highs today. That would have solidified the bullish case.
But, with this move down, we have enough waves in place to consider a leading diagonal down for a wave 1 down, with the .618 retracement of that decline being in the 1698.75 region for a possible wave 2. As you know, diagonals are not exactly the most reliable of trading patterns, but it is now there for all to see.
Until the market is able to move over the August high of 1709.67 in the cash index, the yellow count remains alive - especially with this potential LD down - but, it is clearly on life support. A strong decline breaking down below 1673ES is what we really need to see to get the bearish count back on track. Otherwise, the next higher target region is 1708ES-1713ES.
Harry Boxer, On 4 Stocks to Watch (TheTechTrader.com)
Wall Street was up sharply on Monday, although they did back off in the afternoon. We still had a positive session, decent technicals. A lot of stocks we follow did well, so let's take a look at some of them.
FAB Universal Corporation (FU) is a stock we traded back in 2012 that exploded out of a wedge and went from 2.25 up to 5.25. Since then it's been consolidating, moving up, consolidating some more, and on Friday, it popped sharply, jumping from 4.19 to 4.73, and on Monday, it jumped to 5.27, closing just 2 cents off the high, up 54 cents, or 11.5%, on 1.3 million shares. That may be the biggest volume this stock has ever traded. It may be coming into its own here. The high at 5.70 could be tested as early as Tuesday. But this stock, on a long-term pattern, is designed to be a 7 3/4-8 stock, secondarily target up towards 10 3/4-11.
Those are the targets on this stock.
Omeros Corporation (OMER) had a spectacular session on Monday, up 3.47, or 68%, on 13.4 million shares, going from 5.44 to 8.64 and closing at 8.56 not far off the high. It closed just above resistance. If it backs and fills here it would not be shocking. It could possibly gap up some more, but if it runs, it could very well get up around 11 3/4-12 short-term.
SolarCity Corporation (SCTY) did very well on Monday. It had a swing-trade potential on it because it had a pop on volume, formed a consolidation flag for four sessions now, but it's beneath the moving average. There's a possibility it will get through last week's weekly high, which is 37.87, and the 50-day moving average, at which point it could test the major declining topsline, and get up to the target around 44-45.
SunPower Corporation (SPWR) had an interesting day on Monday. A swing trade was put out on it because of the pop of 3.4 million shares that took it above resistance.
Although it backed off, it did close above it. That was the highest close since early Aug. It needs a follow-through to get up and retest 27 3/4-28, the first target. The secondary target is up around 31 1/2.
Other stocks on Harry's Charts of the Day are Celldex Therapeutics, Inc. (CLDX), Gastar Exploration, Ltd. (GST), VelocityShares 3x Long Natural Gas ETN (UGAZ), Louisiana-Pacific Corp. (LPX), MAKO Surgical Corp. (MAKO), Rare Element Resources Ltd. (REE), Regado Biosciences, Inc. (RGDO), Rockwell Medical, Inc. (RMTI), Sohu.comInc. (SOHU), and Net 1 Ueps Technologies Inc. (UEPS).
Sinisa Persich, On 2 Charts to Watch (TraderHR.com)
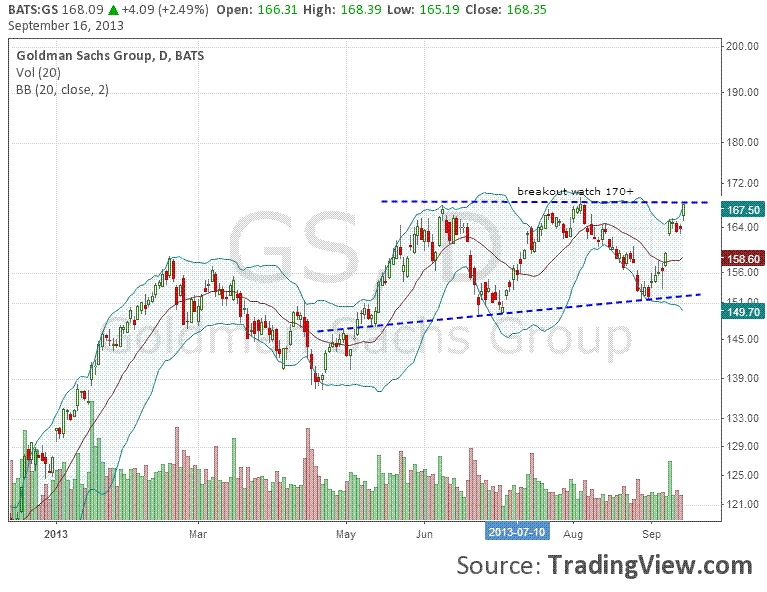
Goldman Sachs (GS) is at the top of a multi-month sideways channel, butting up against resistance near current levels for the third time. A move above 170 would signify a breakout.
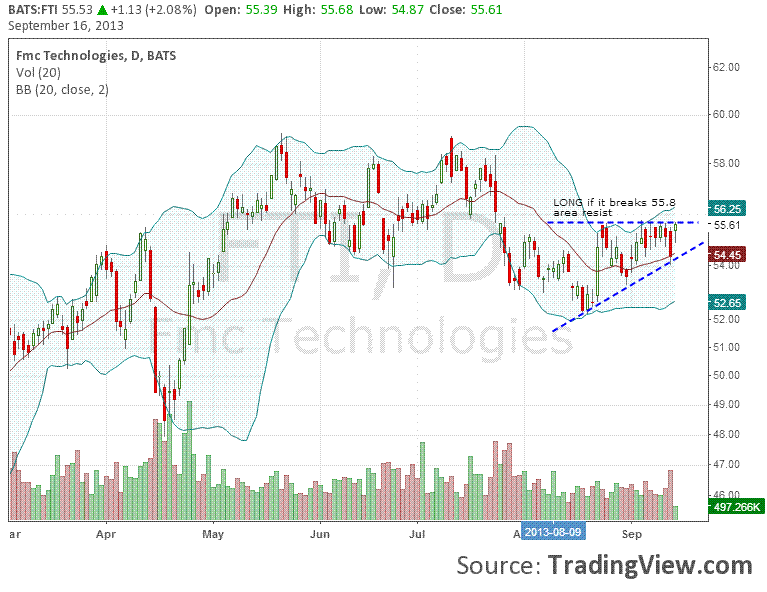
FMC Technologies (FTI) is in a triangle pattern narrowing towards resistance in the 55 1/2-3/4 area. A move above 55.80 would be considered a breakout and reason to enter a long position for an upside reversal towards its May and July double-top in the 59 area.
This Web site is published by AdviceTrade, Inc. AdviceTrade is a publisher and not registered as a securities broker-dealer or investment advisor either with the U.S. Securities and Exchange Commission or with any state securities authority. The information on this site has been obtained from sources considered reliable but we neither guarantee nor represent the completeness or accuracy of the information. In addition, this information and the opinions expressed are subject to change without notice. Neither AdviceTrade nor its principals own shares of, or have received compensation by, any company covered or any fund that appears on this site. The information on this site should not be relied upon for purposes of transacting securities or other investments, nor should it be construed as an offer or solicitation of an offer to sell or buy any security. AdviceTrade does not assess, verify or guarantee the suitability or profitability of any particular investment. You bear responsibility for your own investment research and decisions and should seek the advice of a qualified securities professional before making any investment.
Recommended Content
Editors’ Picks
EUR/USD clings to daily gains above 1.0650

EUR/USD gained traction and turned positive on the day above 1.0650. The improvement seen in risk mood following the earlier flight to safety weighs on the US Dollar ahead of the weekend and helps the pair push higher.
GBP/USD recovers toward 1.2450 after UK Retail Sales data

GBP/USD reversed its direction and advanced to the 1.2450 area after touching a fresh multi-month low below 1.2400 in the Asian session. The positive shift seen in risk mood on easing fears over a deepening Iran-Israel conflict supports the pair.
Gold holds steady at around $2,380 following earlier spike

Gold stabilized near $2,380 after spiking above $2,400 with the immediate reaction to reports of Israel striking Iran. Meanwhile, the pullback seen in the US Treasury bond yields helps XAU/USD hold its ground.
Bitcoin Weekly Forecast: BTC post-halving rally could be partially priced in Premium

Bitcoin price shows no signs of directional bias while it holds above $60,000. The fourth BTC halving is partially priced in, according to Deutsche Bank’s research.
Week ahead – US GDP and BoJ decision on top of next week’s agenda

US GDP, core PCE and PMIs the next tests for the Dollar. Investors await BoJ for guidance about next rate hike. EU and UK PMIs, as well as Australian CPIs also on tap.


