Jack Steiman, On Dangerous Place for Market, Though Bears Can't Close the Deal (SwingTradeOnline.com)
After Friday's big downside opportunity, the bears had their knee on the throats of the bulls again on Monday, but let them up again. As the day wore on the market found some buyers and closed in the green. The Nasdaq led higher, which is important as it needs to lead if the market wants to rock higher over time. While Monday does nothing to alleviate the risk that exists in the market, it's likely the market will try a bit higher before trying lower once again in the near term. The hollow red from Friday did eventually follow through Monday, so it would be normal to try higher on Tuesday, at least early on.
The question everyone was asking me on Monday was why the bears gave it up on Friday after getting the perfect news for a bad day. The answer, as far as I can guess, is that the market is hoping the sequester will be a two-quarter event, and, thus, it's not the beginning of a declining economy that has legs and momentum. We don't know for sure, but in a bull market the bulls always have the last say on things.
There is, however, more potential trouble brewing for the bulls on any move up. The oscillators are lagging again. No strong push with price action for now, and thus the likelihood is another negative divergence if we move up to old highs. Never a guarantee that the divergence will take effect immediately, and thus you'll once again need to see a reversal stick. However, with negative divergences at new highs, plus the sentiment issues and overbought headaches, it makes the market a dangerous place to be with any aggression to the long side.
Recognize that and if you desire to play, keep it light so you don't get shaken out very easily. That's the real danger. Too much exposure will lead to bad exits. If you're in lightly, you can better handle the whipsaw we're seeing now.
Avi Gilburt, On Can This Be a Bear Trap? (ElliottWaveTrader.net)
With the manner in which the market rallied today, it has given me thoughts of other possibilities at this time, and I want to present them.
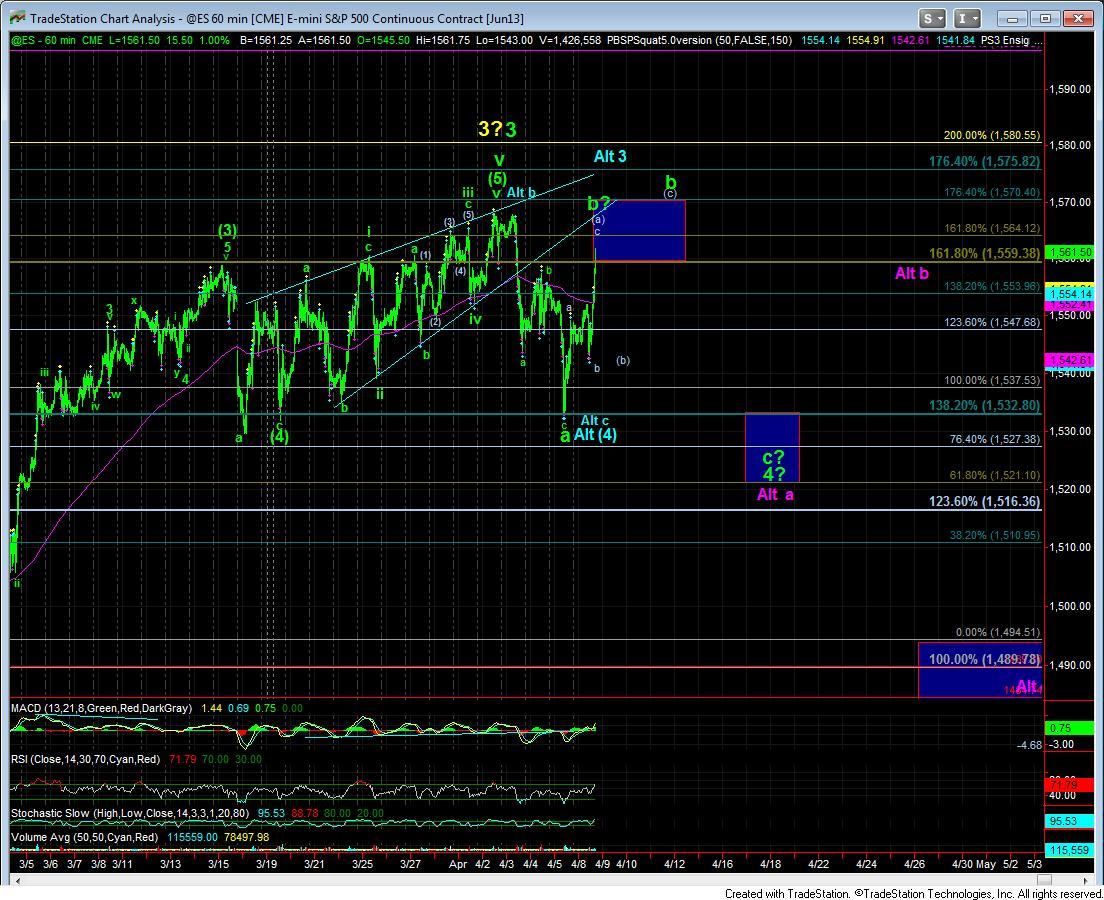
When we did not hit our initial target box on the ES at a minimum of 1570ES, I surmised that we may see a very high retrace in a b-wave, during which the market may attempt to go back and hit that target.
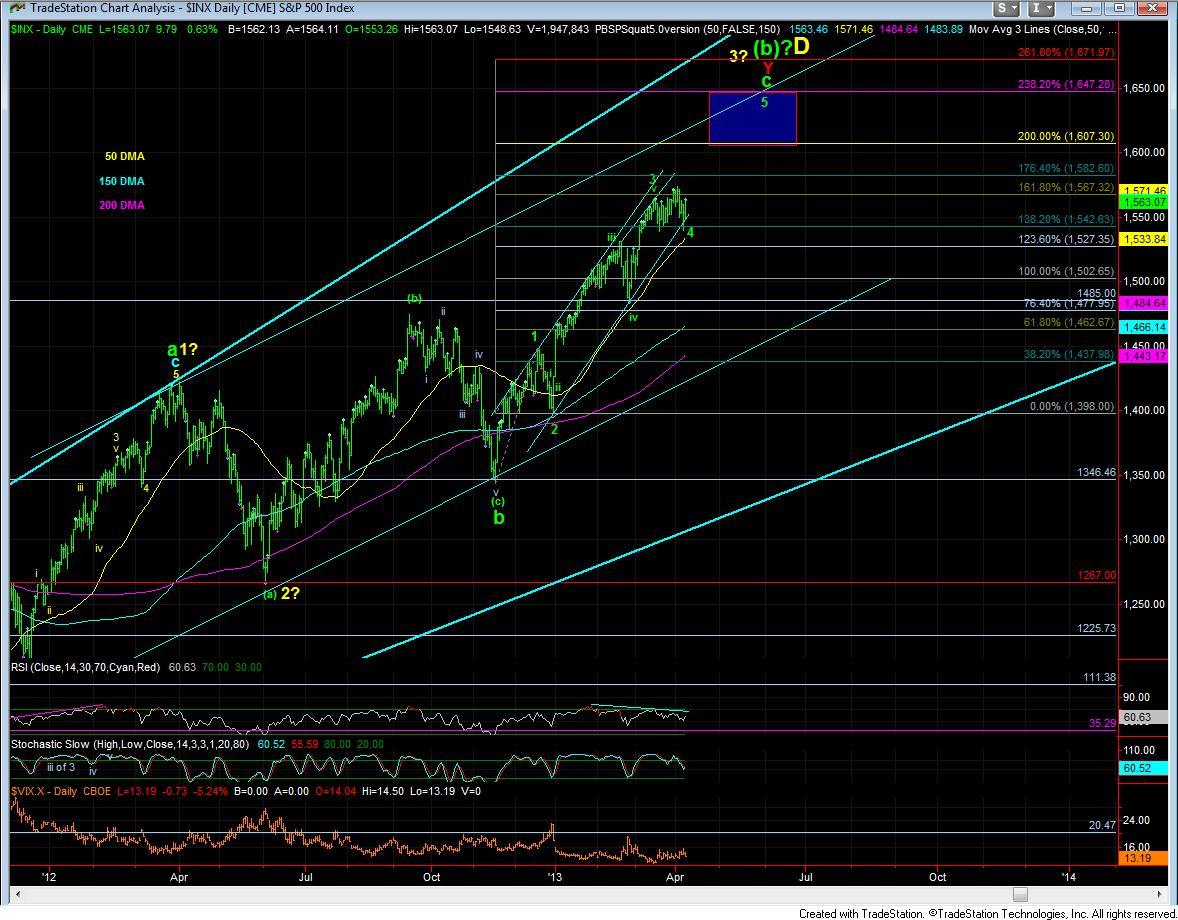
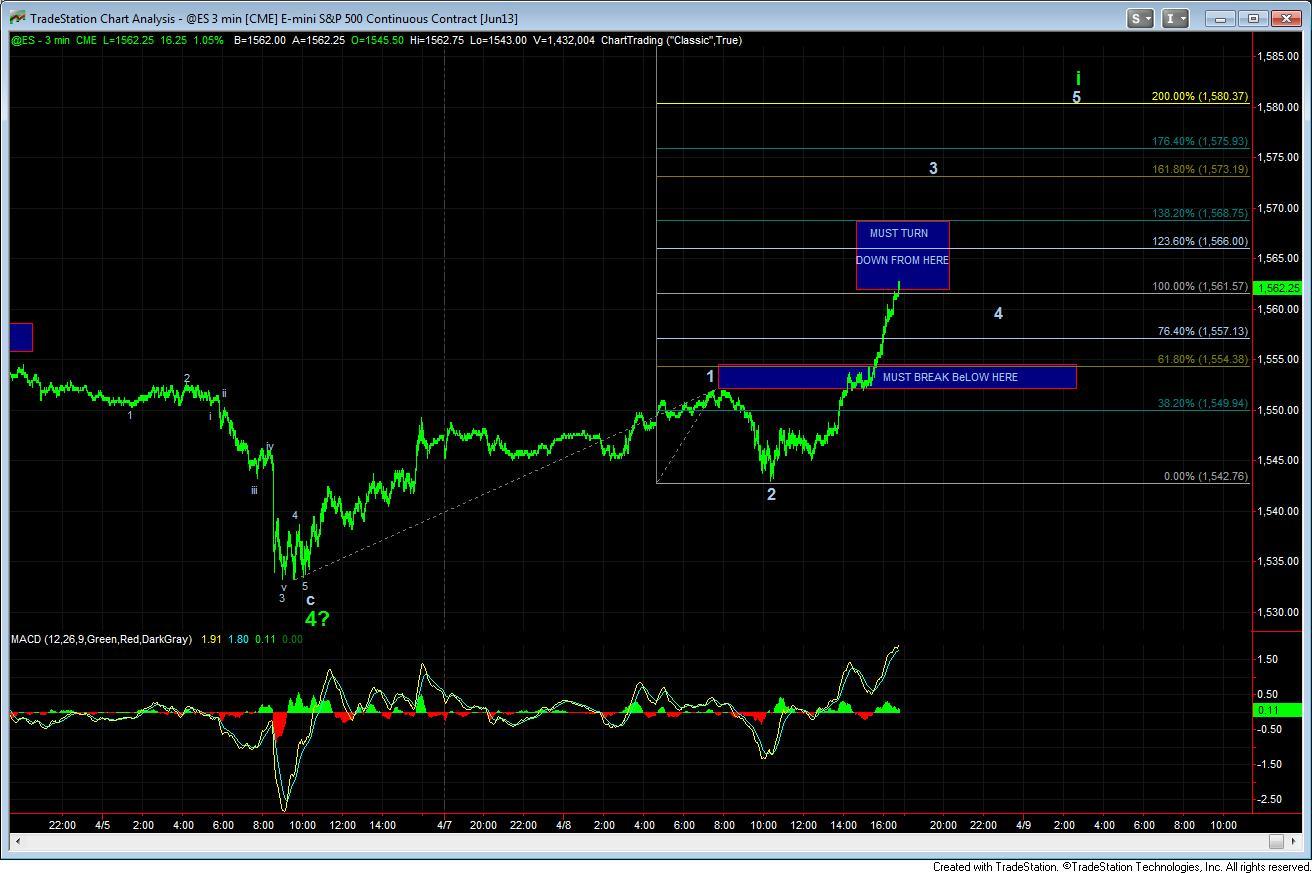
But, with the strength of this rally, I am going to maintain an open mind about where we are in the overall market. What I am saying is that if the market is able to move up to the 1562-1569ES region from here, and then maintain support over the 1555ES region, then I will have no choice but to adopt the ridiculously bullish pattern we see on the daily chart, which makes this wave i of wave 5. This means that wave 4 has completed as a VERY high consolidation and the market will be heading up to 1581 to top off at wave i of wave 5. We will then see a wave ii pullback, to the low 1540ES region, and then we are off and running toward the 1640 region much earlier than expected.
Again, this is no where near my primary count at this time, but will become a strong focus based upon the internal structure of this rally if it continues to develop. The main issues I have with this count is how shallow this wave 4 would be AND it would not adhere to the theory of alternation.
There is also another possibility, as represented in blue on the ES chart, that this is actually the 5th wave up. But, that pattern is not really supported by the XLF or the TF charts at this point in time, while the more bullish one would make more sense with both those counts.
So, at this time, based upon our primary count, we are either completing all of the b-wave, or, more likely, this is only an (a) wave of a much larger green b-wave. But, as I said before, the internal structure of this rally must begin to evidence negative divergences really soon, or else this can extend into a full 5 wave structure up to the 1581ES region.
So, I apologize for placing the more bullish option before you at this point in time, but the move up today made it necessary for me to warn you of this possibility. The market is going to have to turn down from below the 1567ES level and take out the 1555ES level for us to be much more confident that we are still within wave 4, again, which must be our primary count at this time. But, holding that support and then heading higher is a strong indication that wave 4 has completed -- as unbelievable as that may seem -- and we are going to 1640.
Mike Paulenoff, On Heading for New Highs? (MPTrader.com)
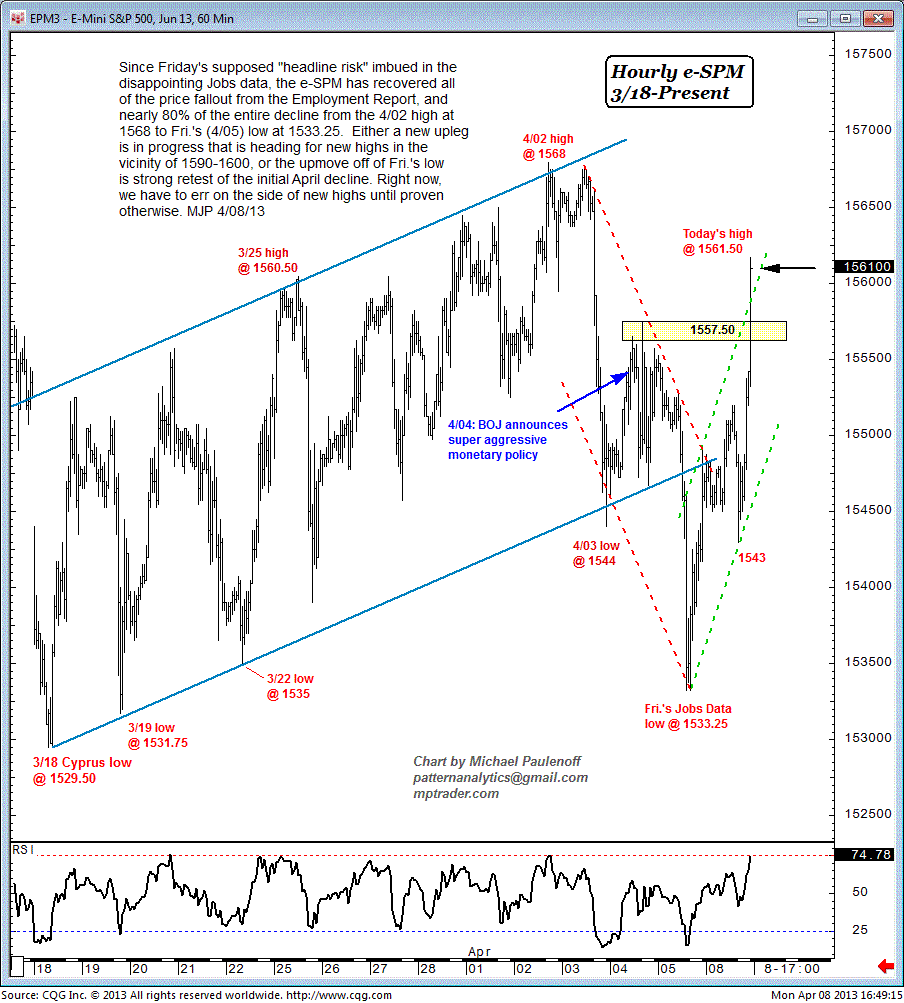
Since Friday's supposed "headline risk" imbued in the disappointing jobs data, the Emini S&P 500 has recovered all of the price fallout from the Employment Report, and nearly 80% of the entire decline from the April 2 high at 1568 to Friday's (April 5) low at 1533.25.
Either a new up leg is in progress that is heading for new highs in the vicinity of 1590-1600, or the up-move off of Friday's low is a strong retest of the initial April decline.
Right now, we have to err on the side of new highs until proven otherwise.
Harry Boxer, On 4 Charts to Watch (TheTechTrader.com)
ANAC broke out of the declining 2-week channel and narrowing falling wedge on a pick-up in volume Monday, rising 84 cents to 6.85, up 14%, on 2.2 million traded. Any follow-through to the 7-7.05 area should lead to a next target of 7.50 and then the 8 1/2-9 zone.
HIMX was up 42 cents, or almost 8%, on Monday to 5.81 on more than 5 1/4 million, the best volume in 4 sessions. A break of the wedge should get it to the 6.20-.25 zone, maybe higher, and I expect the angle of ascent to accelerate as it moves higher, perhaps getting up to 7.
MTG had a monster move in March that took it from 2 1/4 to 6 1/2 in 5 days. The stock came down in a 3-week falling wedge, popped up for a couple days, didn't generate enough volume, and backed off for another week to form a flag. On Monday, it popped 51 cents, or 10%, to 5.45. I'm looking for a retest of the highs in the 6.20 zone, with a secondary target of 7 1/2-3/4.
TEAR, one of our swing trades, had a good day on Monday, breaking out of the wedge we've been watching for the last couple weeks. Volume picked up to 734,000, the biggest volume in three weeks. It did tag the top of the channel at around 7.33 before backing off, still up 30 cents, or 4.4%. However, the stock is only at the middle of the longer-term up-channel it's been in going back almost a year. I'm looking for a follow through and thrust that takes it up to the 9 1/2-3/4 zone.
Other longs to watch include MITK, NIHD, PERI, RBCN, RDN, RGEN, SBGI, and XRTX.
Shorts are CYBX, NILE, NTI, RNF, and SSYS.
This Web site is published by AdviceTrade, Inc. AdviceTrade is a publisher and not registered as a securities broker-dealer or investment advisor either with the U.S. Securities and Exchange Commission or with any state securities authority. The information on this site has been obtained from sources considered reliable but we neither guarantee nor represent the completeness or accuracy of the information. In addition, this information and the opinions expressed are subject to change without notice. Neither AdviceTrade nor its principals own shares of, or have received compensation by, any company covered or any fund that appears on this site. The information on this site should not be relied upon for purposes of transacting securities or other investments, nor should it be construed as an offer or solicitation of an offer to sell or buy any security. AdviceTrade does not assess, verify or guarantee the suitability or profitability of any particular investment. You bear responsibility for your own investment research and decisions and should seek the advice of a qualified securities professional before making any investment.
Recommended Content
Editors’ Picks
AUD/USD posts gain, yet dive below 0.6500 amid Aussie CPI, ahead of US GDP

The Aussie Dollar finished Wednesday’s session with decent gains of 0.15% against the US Dollar, yet it retreated from weekly highs of 0.6529, which it hit after a hotter-than-expected inflation report. As the Asian session begins, the AUD/USD trades around 0.6495.
USD/JPY finds its highest bids since 1990, approaches 156.00

USD/JPY broke into its highest chart territory since June of 1990 on Wednesday, peaking near 155.40 for the first time in 34 years as the Japanese Yen continues to tumble across the broad FX market.
Gold stays firm amid higher US yields as traders await US GDP data

Gold recovers from recent losses, buoyed by market interest despite a stronger US Dollar and higher US Treasury yields. De-escalation of Middle East tensions contributed to increased market stability, denting the appetite for Gold buying.
Ethereum suffers slight pullback, Hong Kong spot ETH ETFs to begin trading on April 30

Ethereum suffered a brief decline on Wednesday afternoon despite increased accumulation from whales. This follows Ethereum restaking protocol Renzo restaked ETH crashing from its 1:1 peg with ETH and increased activities surrounding spot Ethereum ETFs.
Dow Jones Industrial Average hesitates on Wednesday as markets wait for key US data

The DJIA stumbled on Wednesday, falling from recent highs near 38,550.00 as investors ease off of Tuesday’s risk appetite. The index recovered as US data continues to vex financial markets that remain overwhelmingly focused on rate cuts from the US Fed.


