The formal union between England and Scotland is 307 years old. But next week, a referendum will be held on whether that union should end. The latest polls are showing a last-minute surge in support of separation, leaving the two sides neck-and-neck and financial markets nervous.
Once in the privacy of the voting booth, voters may balk at the enormity of a decision to leave the union. But if a simple majority of registered voters in Scotland does vote “yes” for independence, what happens next? Near-term, we could expect financial market turmoil; longer-term, there could be profound implications for national unity elsewhere in Europe and for the U.K.’s role in the European Union (EU).
Alex Salmond, the leader of the Scottish Nationalist Party, claims that a “yes” vote will lead to an independent Scotland in March 2016. Given the complexity of a divorce after three centuries of union, the transition could take a good deal longer. But the potential consequences of separation are already being seen.
There is anecdotal evidence that the closeness of the polls is triggering some capital flight out of Scotland. A “yes” could turn this trickle into a flood as investors pull out of Scottish-based accounts and assets. The British pound would likely weaken against all other major currencies, and U.K. stock markets would experience a period of volatility as investors try to figure out the implications for individual firms and sectors on both sides of the new border.
It is likely that a number of companies would move their legal headquarters to England, particularly in financial services, where an established regulatory regime and central bank are essential for stability. 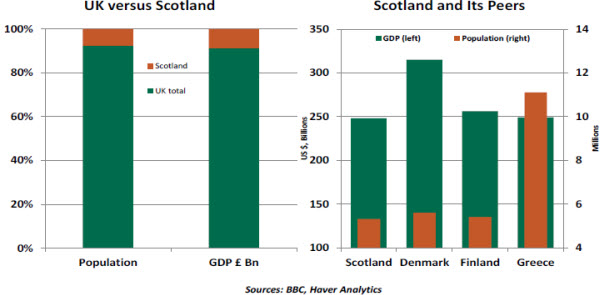
The mainstays of the Scottish economy are the North Sea oil and gas fields, followed by the financial services industry. Within the United Kingdom, Scotland is the second-largest component, smaller than England but dwarfing Wales and Northern Ireland combined in terms of population and area. Its 5.3 million residents account for 8.3% of the U.K.’s population.
Determining the size of the Scottish economy is harder, as it depends on assumptions about the extent of remaining oil and gas deposits in the North Sea, as well as estimates of future hydrocarbon earnings and financial services revenues. However, based on recent averages, we can assume that the gross domestic product (GDP) of an independent Scotland that claims around 80% of the existing oil and gas fields would stand at about £150 billion, or roughly 10% of the U.K. total. That would leave Scotland roughly comparable in size with Finland.  But there are a lot of assumptions built into those numbers, and much would depend on the details of the negotiated divorce settlement.
The minutiae of unpicking a 300-year-old union would be staggering. But there are four key issues that would dominate the rest.
- Currency. Mr. Salmond has said that an independent Scotland will keep the British pound until Scotland joins the eurozone. The government in London and the Bank of England have said this is not an option. The model of monetary integration without fiscal or structural integration is certainly not working well on the other side of the English Channel.
Scotland may try to create a new currency pegged to the pound or the euro, but this would be the riskiest and most-complicated route. It is possible that, faced with the chaos triggered by post-referendum uncertainty, the government in London may take the pragmatic route and allow Scotland to continue using the pound for a time. But London would exact a price, in terms of concessions on other issues.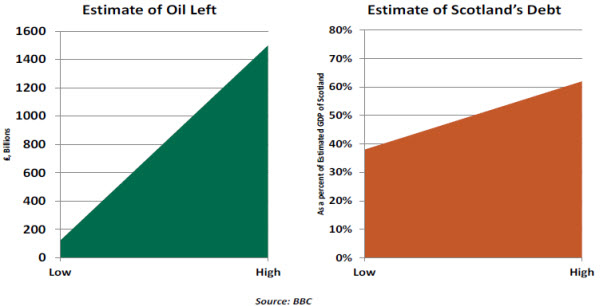
- Debt. What should be Scotland’s share of the U.K. national debt? Different totals can be calculated using different assumptions. Based on a share on the population, Scotland would take on about £92 billion in debt, roughly 62% of the new country’s estimated GDP. If, instead, the calculation is based on estimated fiscal balance, the debt would be just £56 billion or 38% of Scotland's GDP, because oil and gas earnings contribute an outsized amount of revenue to the U.K.’s fiscal picture.
- North Sea oil. At least 80% of the U.K.’s known North Sea oil and gas reserves are within Scotland’s probable maritime border. However, there is no consensus on the level of hydrocarbon reserves left in the various fields or on whether newer technologies can boost production from the older fields. This has huge implications for the basis of the fledgling Scottish economy and for the negotiations on sharing the debt burden and the currency.
- EU status. There is no clear provision in the EU treaties for a situation like this. In theory, Scotland would have to apply to join as a new country and win approval from all the existing members. However, many of them are anxious to damp down separatist demands in their own countries and will not want to make this process easy. Similar uncertainty would surround Scotland’s status within the North Atlantic Treaty Organization (NATO), with membership dependent on resolving negotiations with London. Given the rising tensions in NATO’s relationship with Russia, this is not a good time for uncertainty about the status of military forces stationed around Scotland.
In the longer term, a “yes” vote will embolden separatists elsewhere in the EU. Belgium, a country deeply divided between French-speaking Walloons and Dutch-speaking Flemish, is one obvious candidate. In Spain, the regional parliament in Catalonia is poised to approve its own regional referendum, a move that is strongly opposed by Madrid and will almost certainly be quashed by Spain’s Constitutional Court. But how long can Madrid resist once the precedent of peaceful separation has been set in international law? Finally, although the U.K. economy could withstand the shock of separation, its political scene would be profoundly altered. Shorn of the pro-EU Scots, the remainder of the United Kingdom would be more likely to seriously countenance withdrawing from the EU.
The ethnic map of Europe is far from tidy. Scottish secession from the United Kingdom could make matters messier still. It’s not as if anyone is aiming to reconstruct Hadrian’s wall, but more borders could mean more economic and political challenges for a region that is desperately trying to maintain some semblance of unity.
U.S. Consumer Spending Outlook – Good but Not Great
It is well known that consumer spending in the United States is the largest component of GDP and an important driver of economic growth. After five years of growth, the increase in consumer spending is poor compared with historical norms. Looking forward, the underpinnings of consumer spending suggest continued growth, albeit at a moderate pace.
Real consumer spending rose 2.5% in the second quarter, a tad higher than the 2.2% average recorded during the five years of economic recovery. A soft reading for real consumer spending in July (-0.2%) prompted revisions of forecasts for the third quarter and also raised questions about the future trend of consumer spending. August auto sales (17.5 million versus 16.5 million in July), non-auto retail sales and revisions of July retail sales reduced the whiff of pessimism that followed the July consumer spending report.
Of the major components of consumer spending, expenditures on goods in the post-recession period stand out. Health care and housing services account for the muted growth in service-sector spending. Of late, estimates of health care are subject to large revisions owing to a lack of information about new enrollments under the Affordable Care Act. These numbers should stabilize in the near term.
Against this backdrop, an understanding of income trends and net worth of households, the two main factors that influence consumer spending, is useful to assess the likely path of consumer spending. 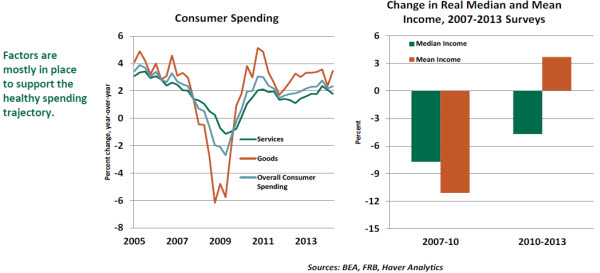
Real personal disposable income averaged 3.8% growth in the first half of 2014, reflecting a combination of gains in earnings and employment. There is little reason to expect sharp losses in employment in the near term so as to set back income gains and consumer spending.
The Federal Reserve’s Triennial Survey of Consumer Finances, published last week, includes details that modify our understanding of income trends gleaned from macroeconomic data. The survey points out that real mean income rose 3.7% between 2010 and 2013, but real median income fell 4.7%. This is superior to the large losses in mean and median incomes recorded between 2007 and 2010 but indicative of a state where top quintiles are doing very well while lower quintiles are lagging.
The recovery in net worth of households after the Great Recession is noteworthy. Net worth of households as a percent of disposable income is close to the high seen prior to the onset of the last recession. Also, inflation-adjusted net worth of households established a new high in the first quarter and surpassed the peak seen in the prior business cycle.
Once again drawing on the Federal Reserve’s Triennial Survey of Consumer Finances, there was little change in the median and mean net worth between 2010 and 2013. Median net worth slipped 1.9%, and the mean increased slightly. Both these measures recorded more-than-significant declines between 2007 and 2010, implying that the improvement of the last three years is important. The overall gain in net worth of households should have a positive impact on consumer spending in the quarters ahead. 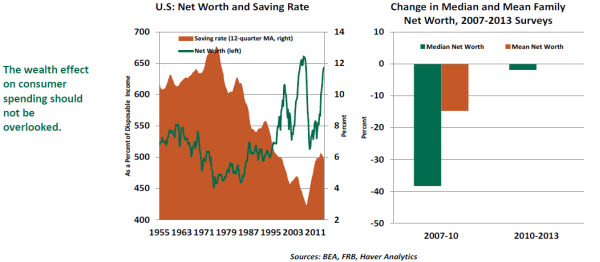
Consistent with income trends and differences in holdings of assets such as homes and equities, net worth of families at the bottom of the income distribution experienced declines between 2010 and 2013, while those in the top half experienced, on average, modest gains.
These distributional aspects of income and wealth should have a bearing on components of consumer spending, with discretionary expenditures likely to register stronger growth compared with non-discretionary components.
Discussion about consumer spending is incomplete without taking a peek at the saving rate. The U.S. personal saving rate as a percent of disposable income stood at 5.7% in July 2014, up from an average of 4.9% in 2013. An increase in the saving rate is a drag on consumer spending, although in the long run it creates a virtuous cycle.
To put consumer spending and saving data in perspective, some background information is useful. The life-cycle model of consumer spending holds that consumers seek to attain a target of net worth to income in order to maintain a desired pattern of consumer spending.
The saving rate hit a historical low of 2.5% in 2005 after a decade-long secular decline. The long stretch of rising asset prices (both equity and homes) resulted in a reduction of the saving rate as consumers viewed the increase in net worth as a substitute for the old-fashioned way of setting aside a percentage of their paychecks. When asset prices plummeted, the saving rate reversed the decline.
Coming back to the current saving rate, the 12-quarter moving average (which smoothens out fluctuations arising from factors that have a short-term impact on the saving rate) shows a flattening of the saving rate around 6.0% in an environment of advancing net worth. This suggests that consumers are likely to be less frugal as they become convinced that their goals for net worth are nearly on track.
There is another tailwind that bodes well for consumer spending in the near term. The Senior Loan Officer Opinion Survey of the Federal Reserve indicates that banks are willing to extend non-mortgage loans to households at favorable terms. Consistent with this, consumer credit advanced at a noticeable pace in the last five months.
These arguments indicate that consumer spending is on track to maintain a moderate upward trend in coming quarters and will continue to pull the U.S. economy ahead.
Recommended Content
Editors’ Picks
EUR/USD climbs to 10-day highs above 1.0700

EUR/USD gained traction and rose to its highest level in over a week above 1.0700 in the American session on Tuesday. The renewed US Dollar weakness following the disappointing PMI data helps the pair stretch higher.
GBP/USD extends recovery beyond 1.2400 on broad USD weakness

GBP/USD gathered bullish momentum and extended its daily rebound toward 1.2450 in the second half of the day. The US Dollar came under heavy selling pressure after weaker-than-forecast PMI data and fueled the pair's rally.
Gold rebounds to $2,320 as US yields turn south

Gold reversed its direction and rose to the $2,320 area, erasing a large portion of its daily losses in the process. The benchmark 10-year US Treasury bond yield stays in the red below 4.6% following the weak US PMI data and supports XAU/USD.
Here’s why Ondo price hit new ATH amid bearish market outlook Premium

Ondo price shows no signs of slowing down after setting up an all-time high (ATH) at $1.05 on March 31. This development is likely to be followed by a correction and ATH but not necessarily in that order.
Germany’s economic come back

Germany is the sick man of Europe no more. Thanks to its service sector, it now appears that it will exit recession, and the economic future could be bright. The PMI data for April surprised on the upside for Germany, led by the service sector.