EUR/USD
Trying to bounce.
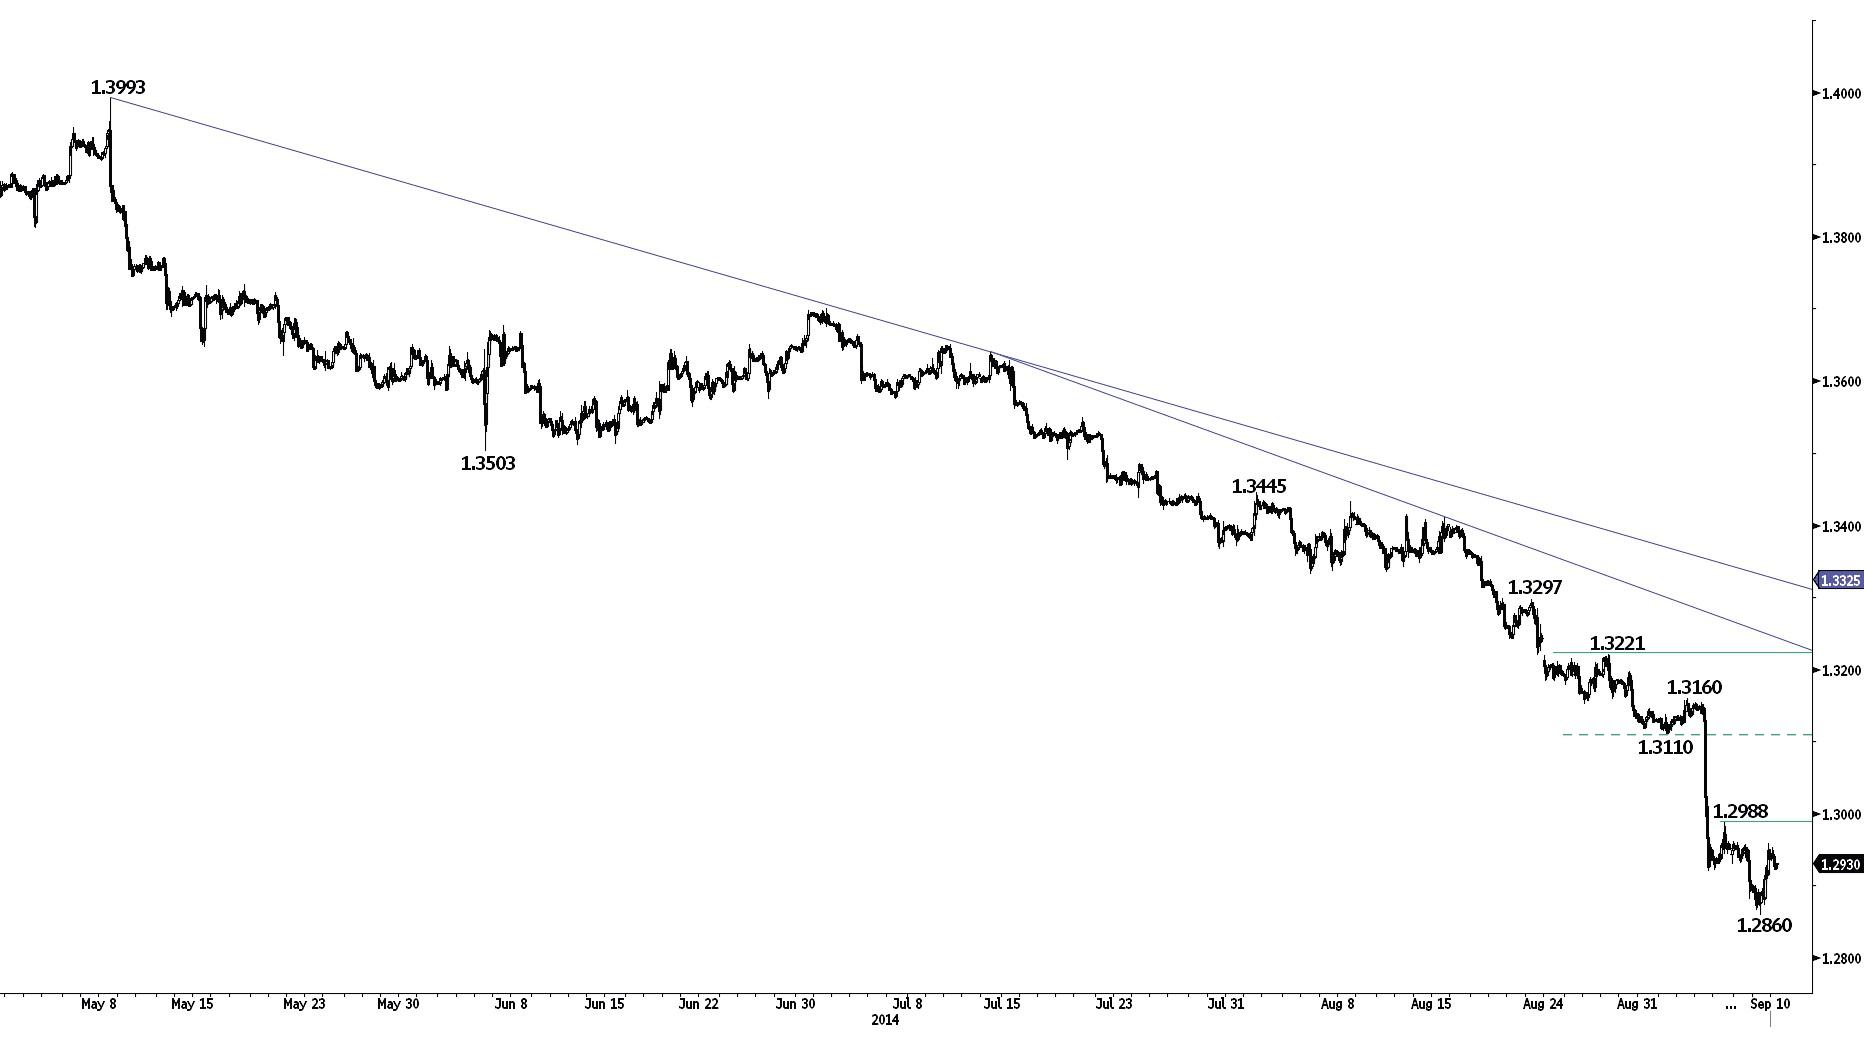
- EUR/USD is trying to bounce from its oversold decline. Hourly resistances can be found at 1.2988 (05/09/2014 high) and 1.3110 (02/09/2014 low). An hourly support now lies at 1.2860.
- In the longer term, EUR/USD is in a succession of lower highs and lower lows since May 2014. The break of the key support at 1.3105 (06/09/2013 low) opens the way for a decline towards the strong support area between 1.2755 (09/07/2013 low) and 1.2662 (13/11/2012 low). A key resistance lies at 1.3221 (28/08/2014 high).
Await fresh signal.
GBP/USD
Trying to bounce.
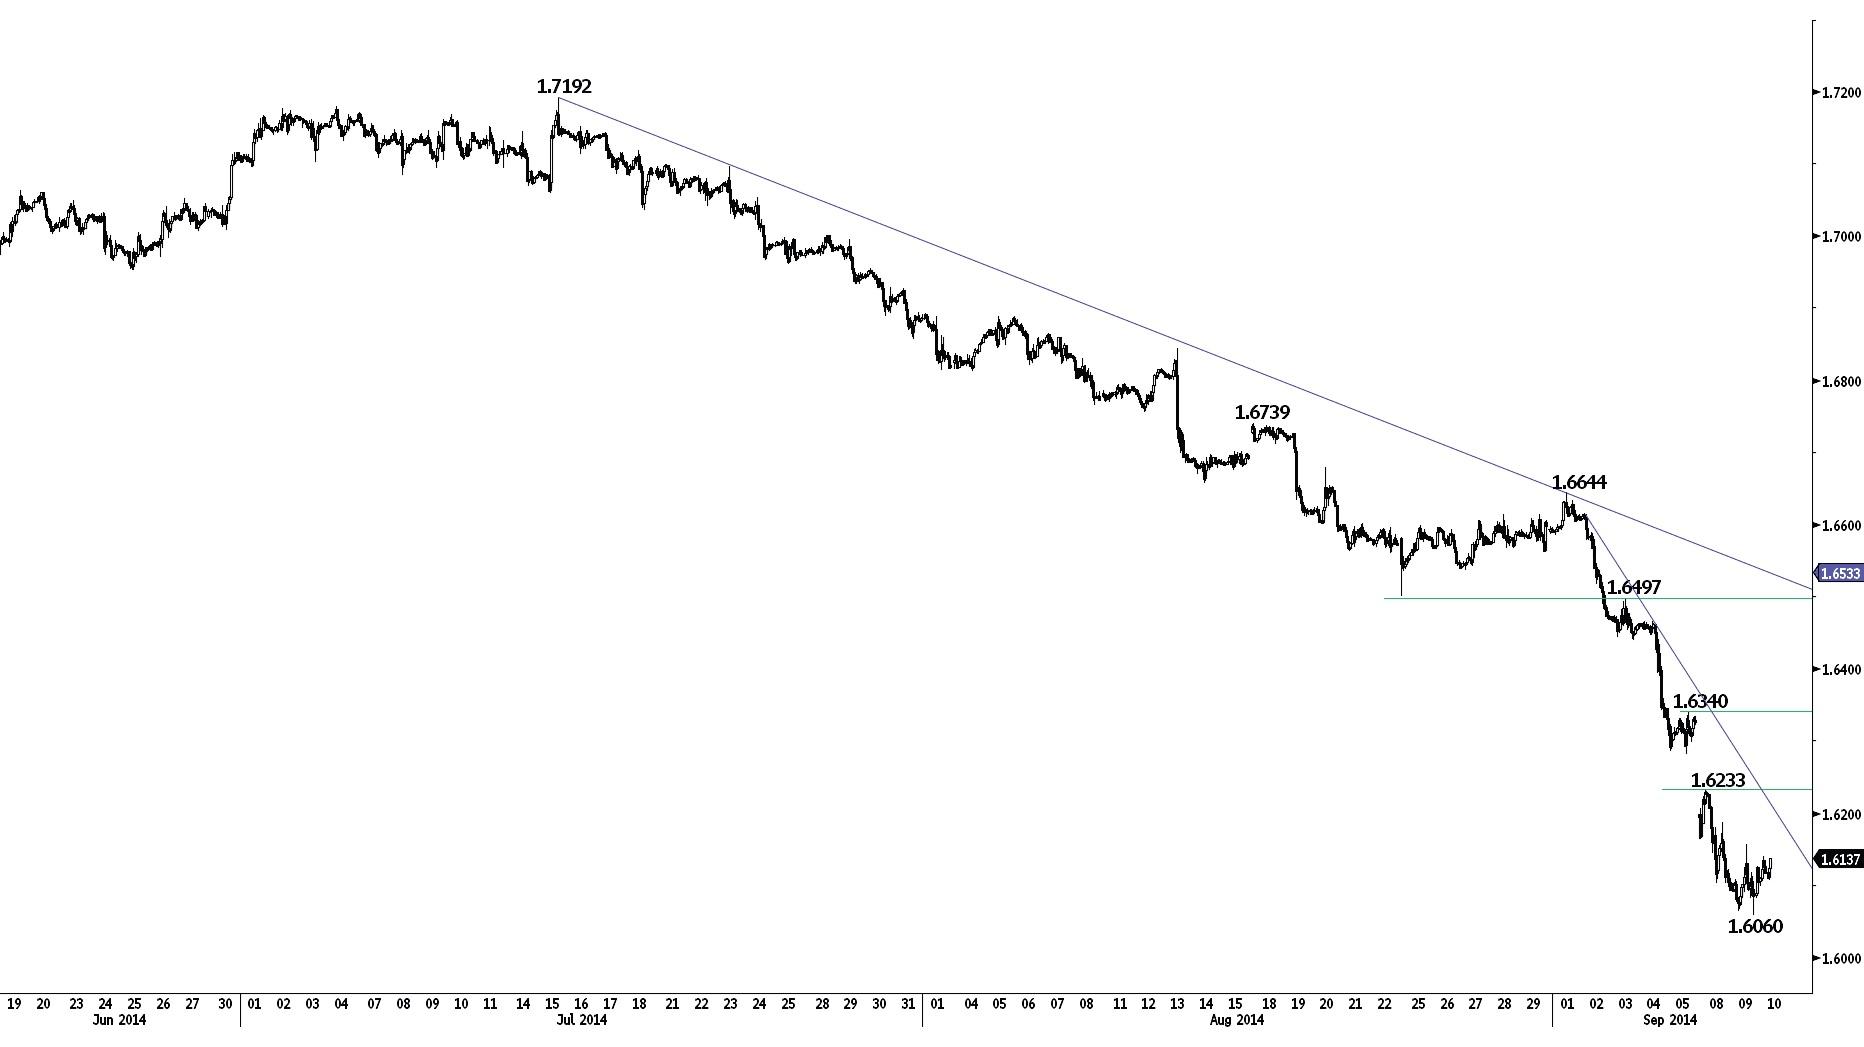
GBP/USD is trying to bounce from its oversold decline. Hourly resistances can be found at 1.6233 (08/09/2014 high) and 1.6340 (05/09/2014 high). An hourly support now lies at 1.6060, while a more significant support stands at 1.6000 (psychological threshold and 50% retracement).
In the longer term, prices have collapsed after having reached 4-year highs. The breach of the key support at 1.6220 confirms persistent selling pressures and opens the way for further decline towards the strong support at 1.5855 (12/11/2013 low). A key resistance now stands at 1.6644.
Await fresh signal.
USD/JPY
Pushing higher.
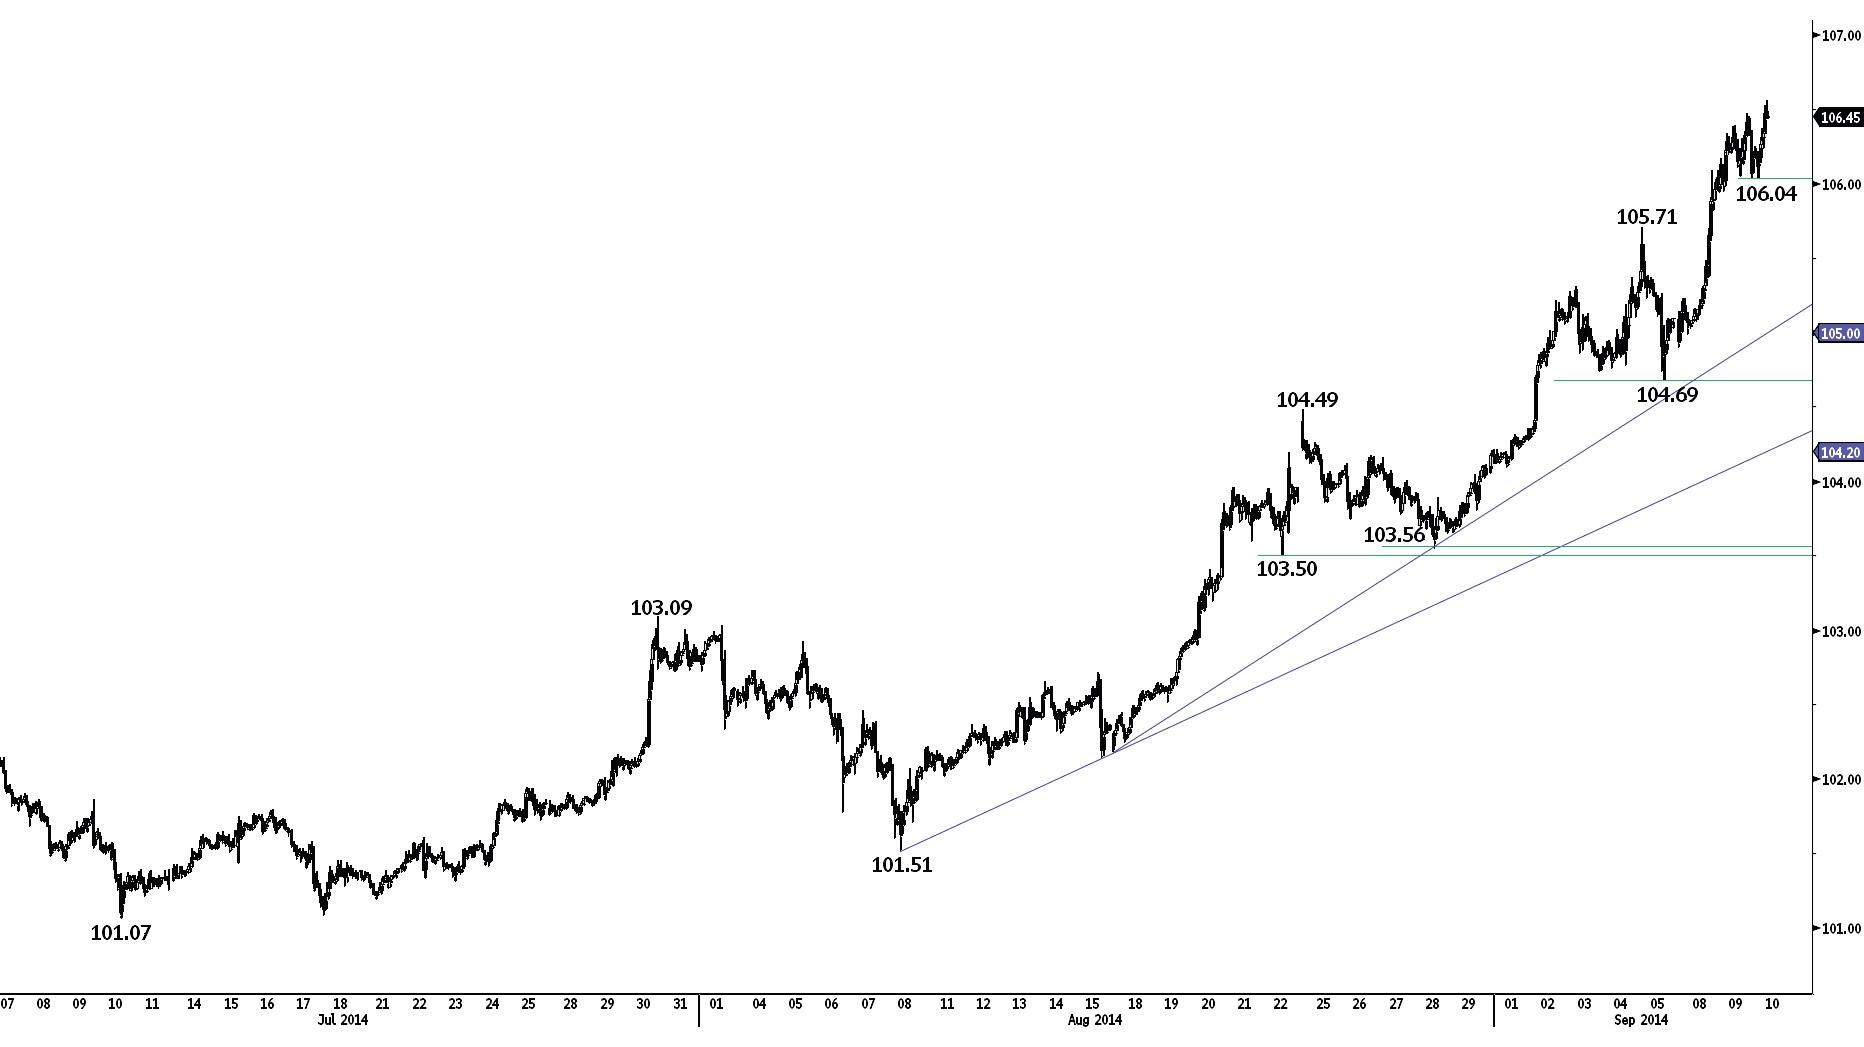
USD/JPY has broken the strong resistance at 105.44 (see also the 61.8% retracement and the long-term declining trendline), opening the way for further strength towards the major resistance at 110.66. Hourly supports can now be found at 106.04 and 105.71 (05/09/2014 high).
A long-term bullish bias is favoured as long as the key support 100.76 (04/02/2014 low) holds. The break to the upside out of the consolidation phase between 100.76 (04/02/2014 low) and 103.02 favours a resumption of the underlying bullish trend. A major resistance stands at 110.66 (15/08/2008 high).
Await fresh signal.
USD/CHF
Fading buying interest?
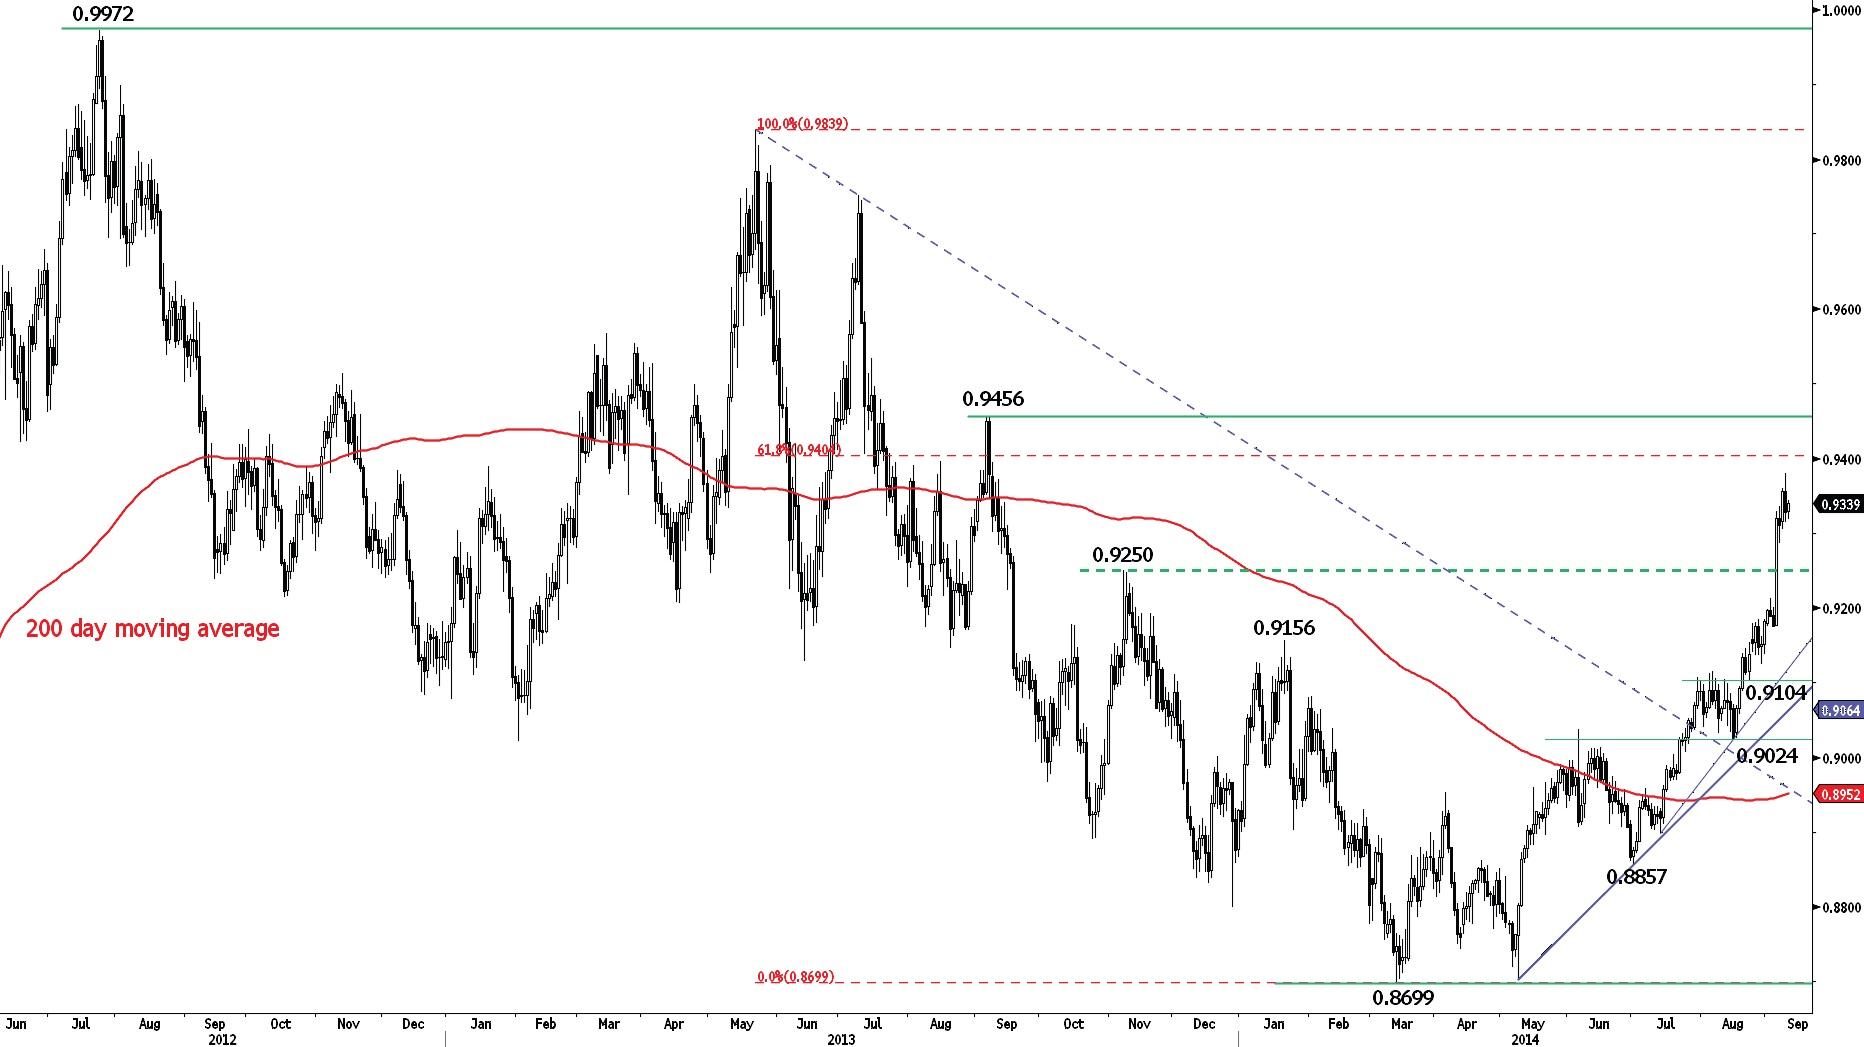
USD/CHF moved higher yesterday only to close significantly lower, suggesting potential fading short-term bullish momentum. Hourly supports can be found at 0.9287 (05/09/2014 low) and 0.9250 (previous resistance). An hourly resistance now lies at 0.9380 (09/09/2014 high). Another resistance stands at 0.9404 (61.8% retracement).
From a longer term perspective, the technical structure calls for the end of the large corrective phase that started in July 2012. The break of the strong resistance at 0.9250 (07/11/2013 high) opens the way for a move towards the next strong resistance at 0.9456 (06/09/2013 high). A key support now lies at 0.9104 (22/08/2014 low).
Await fresh signal.
USD/CAD
False breakout of the resistance at 1.0988.
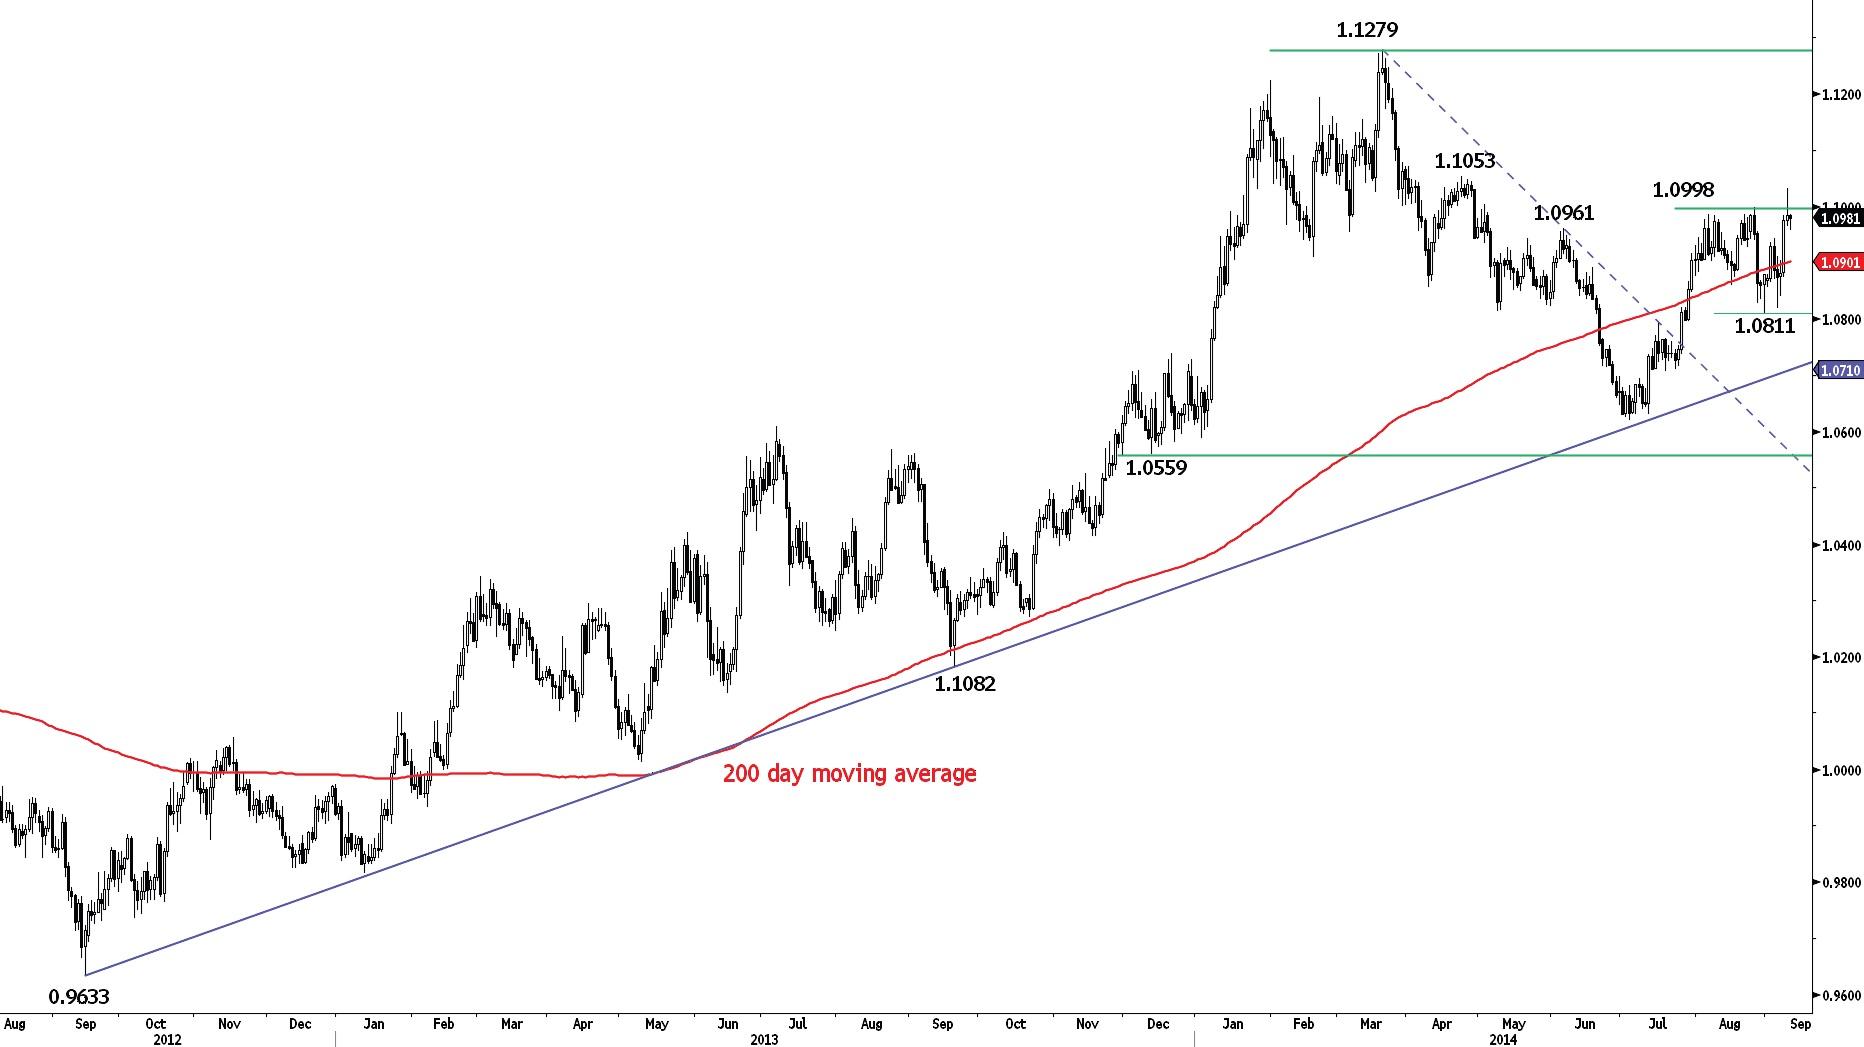
USD/CAD made an intraday bearish reversal near the top of its horizontal range defined by the support at 1.0811 and the key resistance at 1.0998 yesterday. A decisive break to the upside is needed to favour a second leg higher towards 1.1188 (second leg of the same size as the first). Another resistance can be found at 1.1053. An hourly support lies at 1.0943 (03/09/2014 high).
In the longer term, the technical structure looks like a rounding bottom whose minimum upside potential is at 1.1725. However, a break of the support area implied by the long-term rising trendline and 1.0559 (29/11/2013 low) would invalidate this long-term bullish configuration.
- Yesterday's bearish reversal has stopped our long strategy.
Our long strategy has been stopped.
AUD/USD
Bearish breakout of the support at 0.9206.
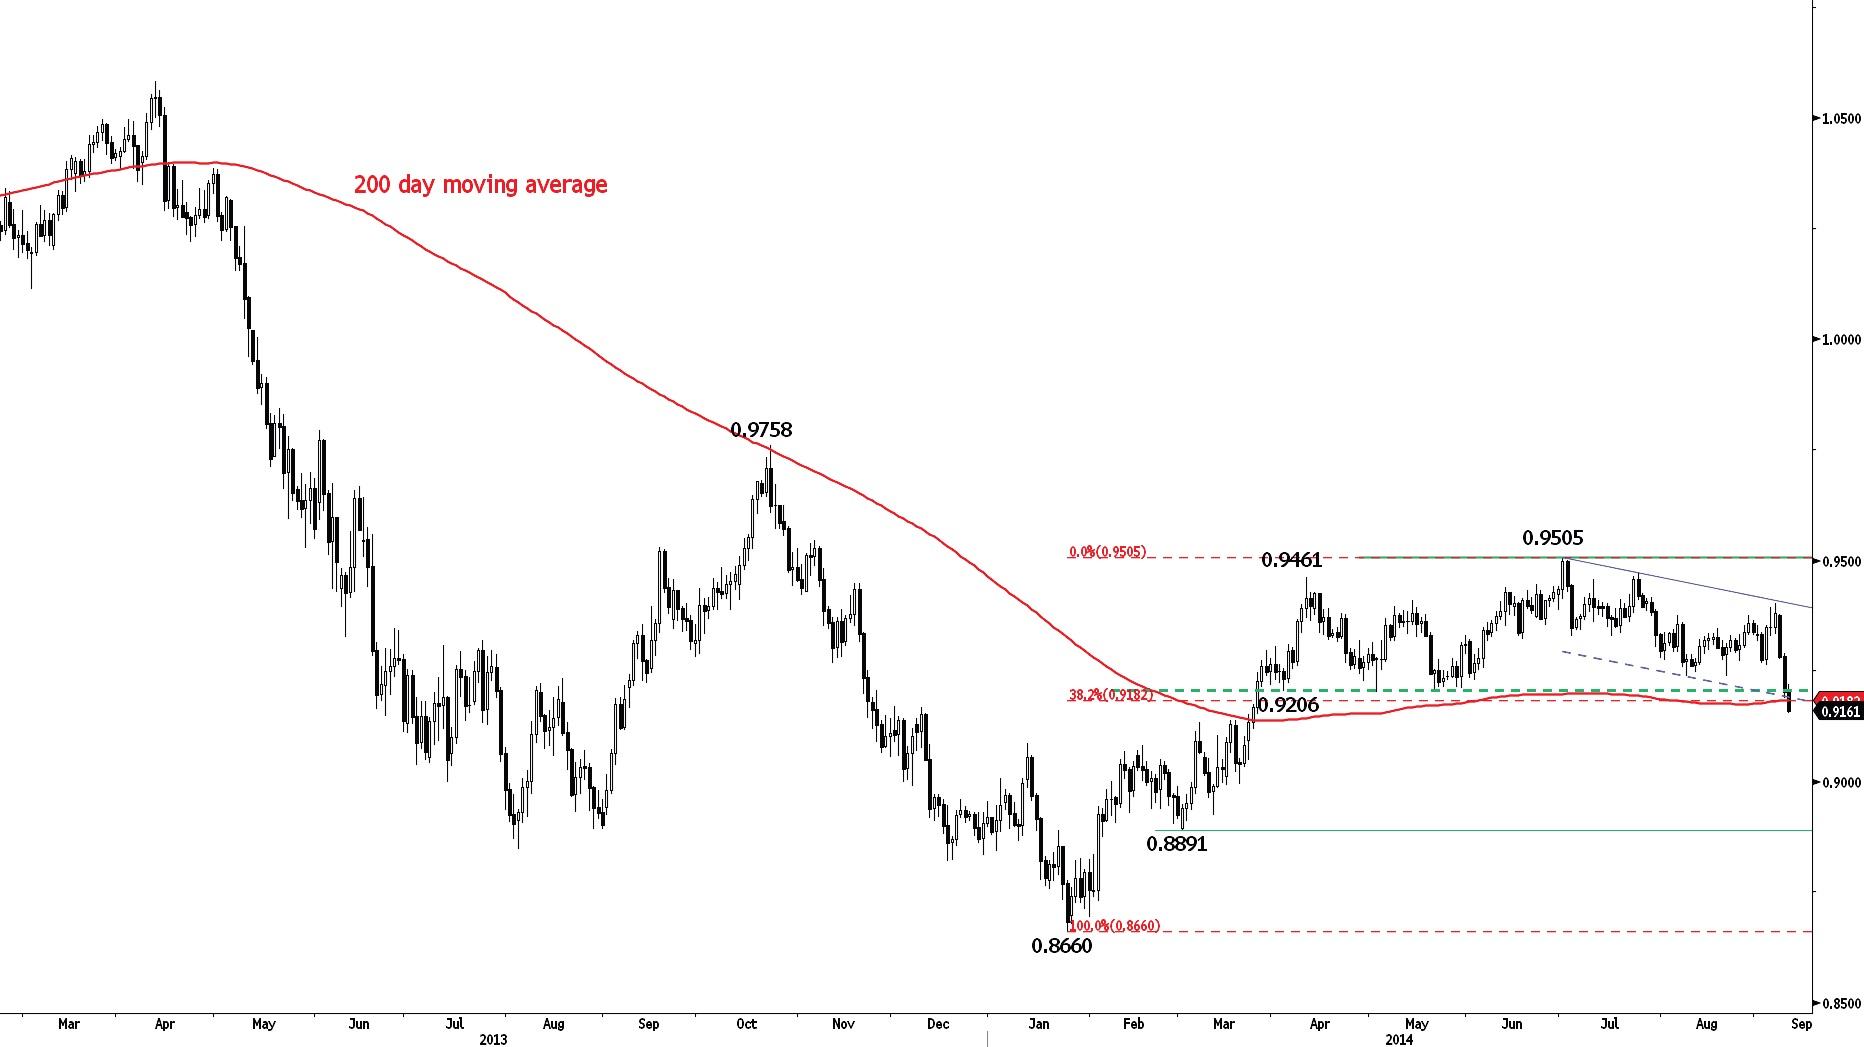
AUD/USD has broken the key support area defined by 0.9206 and the 200 day moving average (see also the 38.2% retracement). The short-term technical structure is negative as long as prices remain below the hourly resistance at 0.9251 (intraday low). A first hourly resistance can be found at 0.9218 (intraday high).
In the longer term, the break to the downside out of the 5 month horizontal range between 0.9206 (see also the 200 day moving average) and 0.9461 (10/04/2014 high)/0.9505 calls for a further decline towards the support at 0.8891 (03/03/2014 low).
Await fresh signal.
GBP/JPY
Rebound underway.
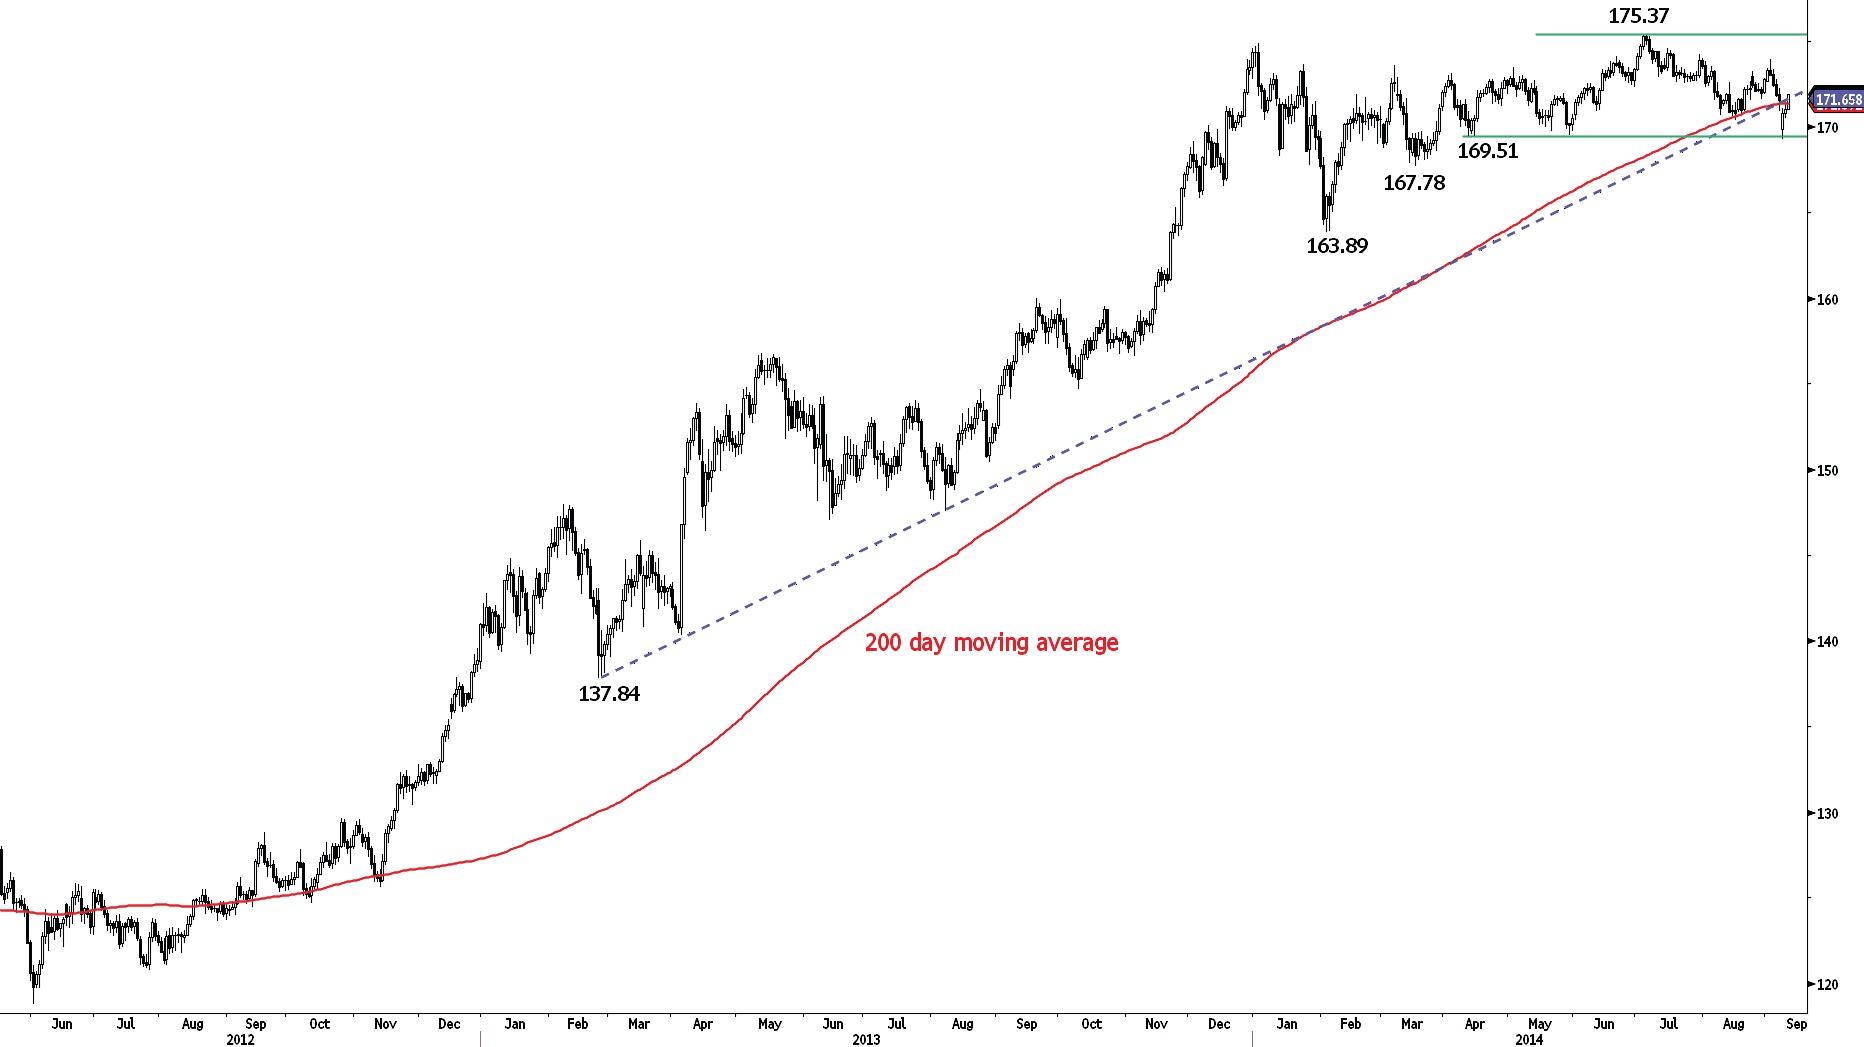
GBP/JPY has successfully tested the strong support at 169.51 and has broken the hourly resistance at 171.65 (intraday high). Another resistance lies at 172.78 (04/09/2014 high). An hourly support now lies at 170.88 (intraday low).
In the long-term, the break of the major resistance at 163.09 (07/08/2009 high) calls for further strength towards the resistance at 179.17 (15/08/2002 low). A decisive break of the strong support at 169.51 (11/04/2014 low) is needed to invalidate this scenario.
Await fresh signal.
EUR/JPY
Approaching the key resistance at 138.03.
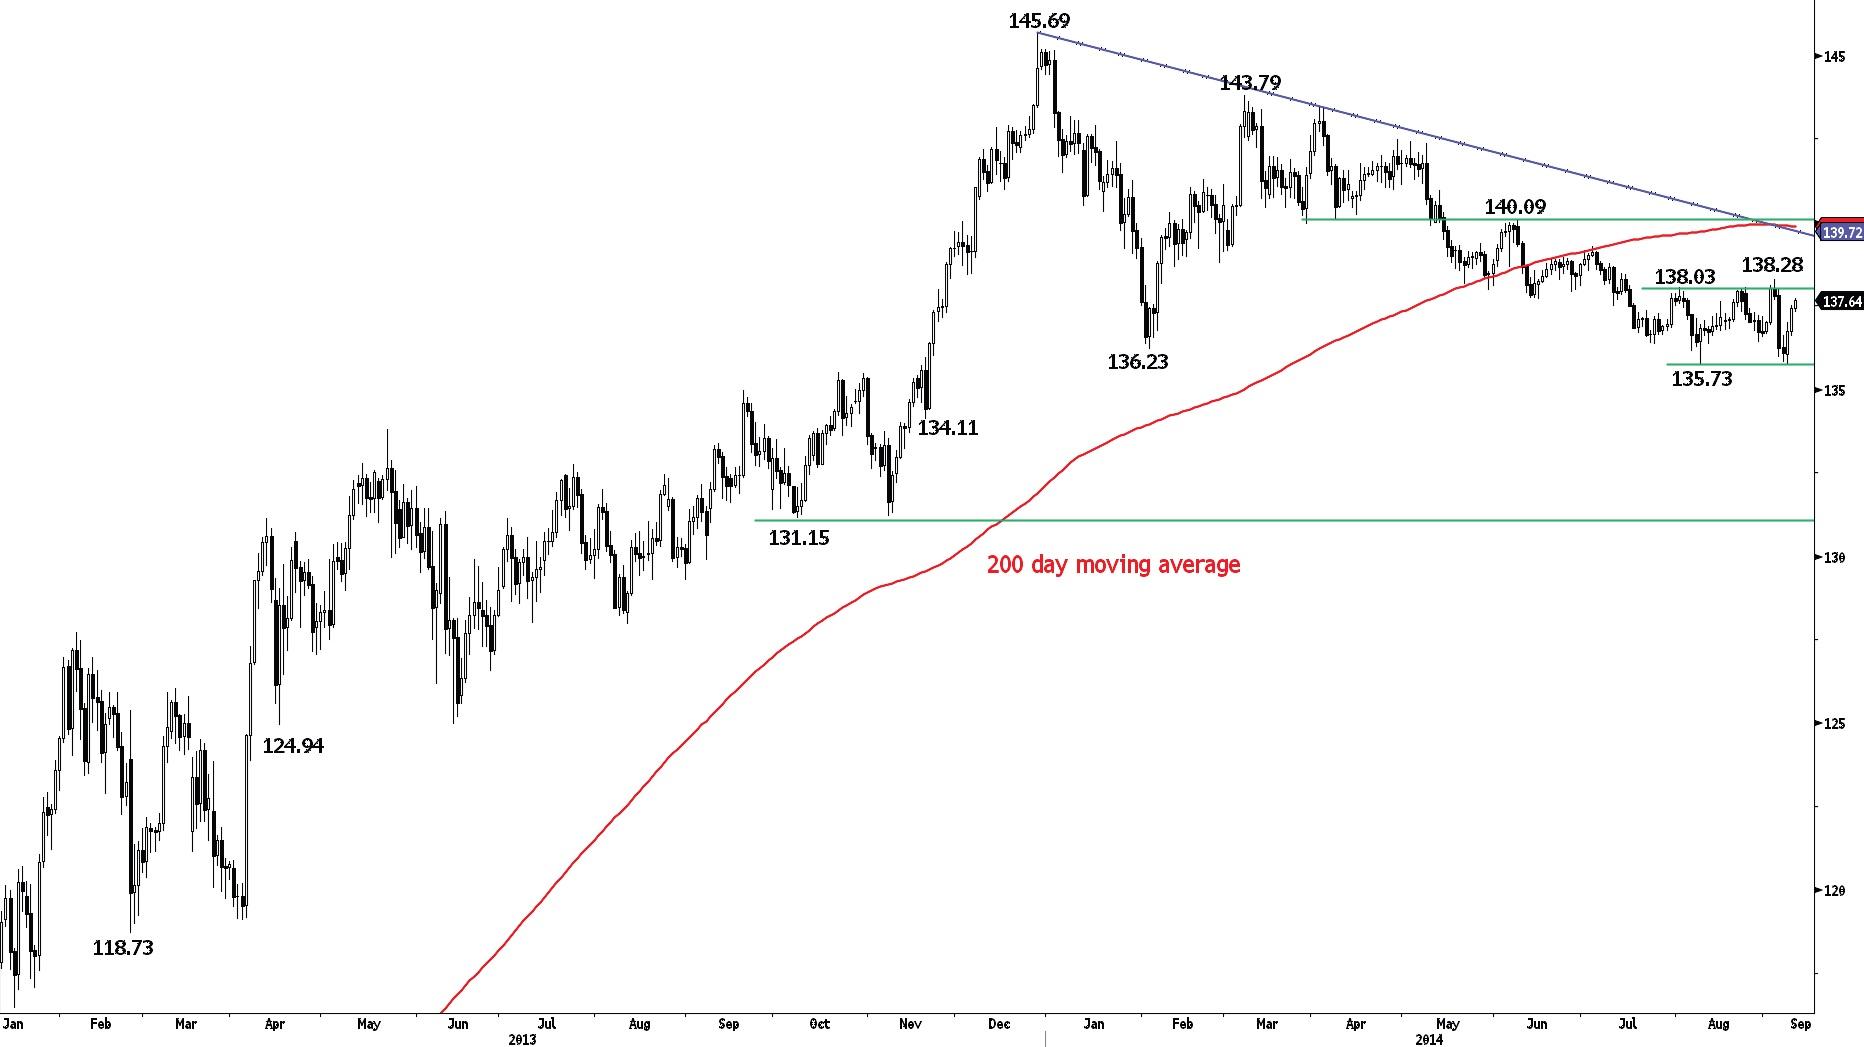
EUR/JPY has successfully tested the strong support area around 135.73 (08/08/2014 low) and is now approaching the key resistance at 138.03/138.28. A break of the hourly support at 137.29 (intraday low) would suggest a weakening short-term bullish momentum. Another resistance lies at 139.28 (03/07/2014 high).
The long-term technical structure remains positive as long as the support at 134.11 (20/11/2013 low) holds. However, a key support stands at 136.23 (04/02/2014 low). A strong resistance lies at 140.09 (09/06/2014 high).
Await fresh signal.
EUR/GBP
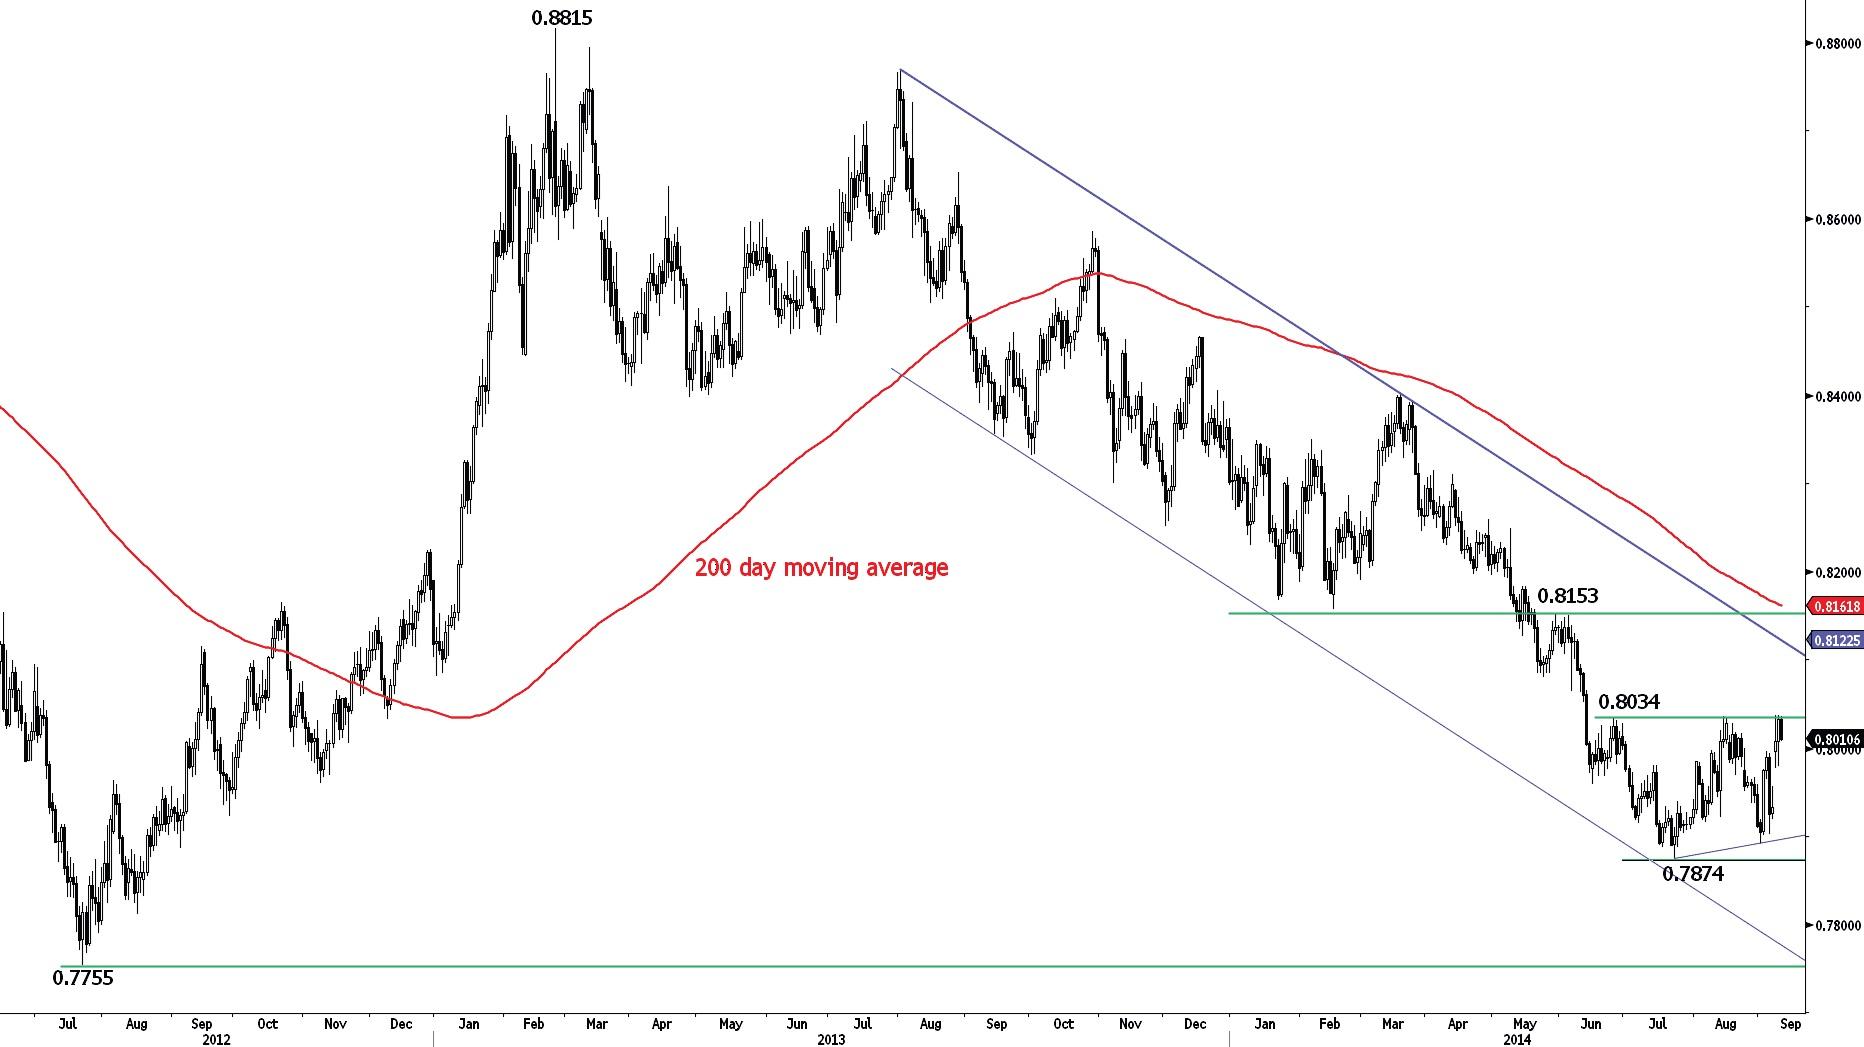
Challenging the key resistance at 0.8034.
EUR/GBP is challenging the top of its horizontal range defined by the support at 0.7874 and the key resistance at 0.8034. The long-term declining channel continues to favour a bearish bias. An hourly support lies at 0.7979 (08/09/2014 low), whereas another resistance is given by the declining channel (around 0.8123).
In the longer term, the break of the key support area between 0.8082 (01/01/2013 low) and 0.8065 (05/06/2014 low) opens the way for a full retracement of the rise that started at 0.7755 (23/07/2012 low). Another strong support stands at 0.7694 (20/10/2008 low). A break of the resistance at 0.8034 (25/06/2014 high) is needed to suggest some exhaustion in the medium-term selling pressures.
Await fresh signal.
EUR/CHF
Moving sideways.
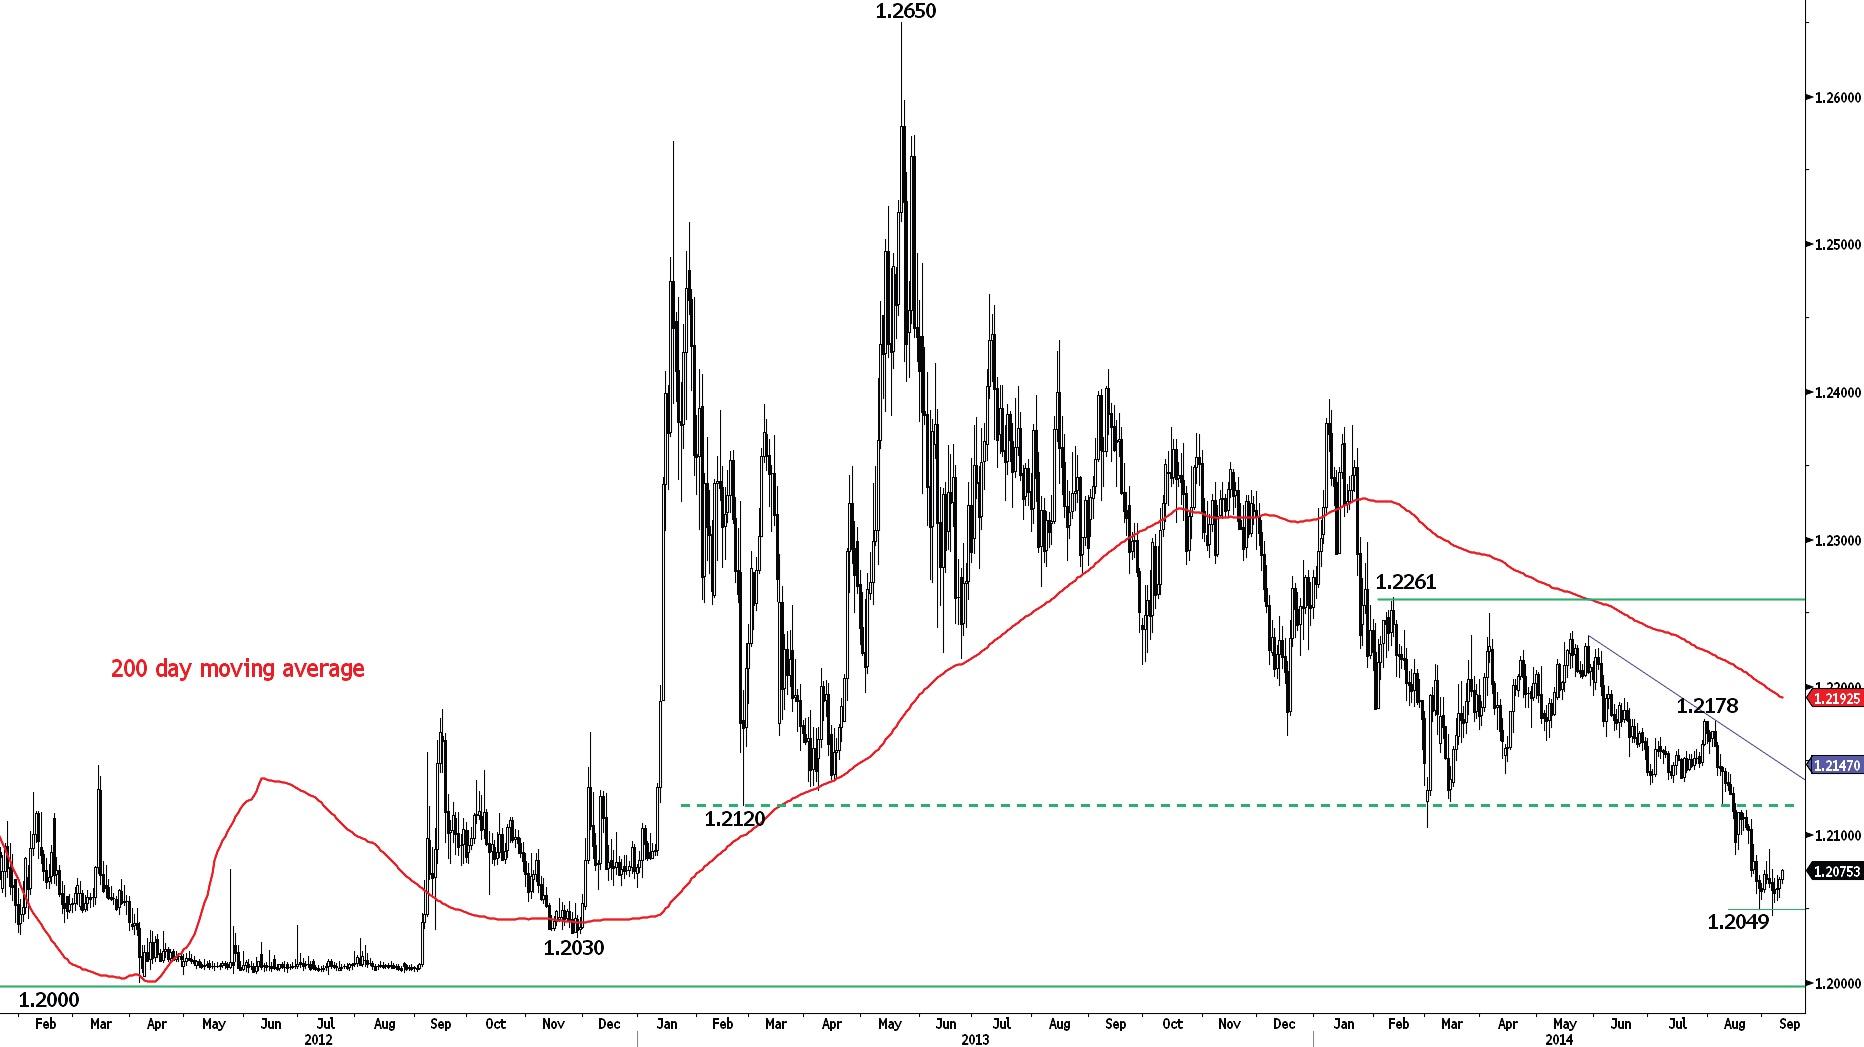
EUR/CHF is trying to stabilise near its recent low at 1.2049 (28/08/2014 low). However, a break of the hourly resistance at 1.2093 (26/08/2014 high) is needed to suggest exhaustion in shortterm selling pressures. Another resistance stands at 1.2121 (15/08/2014 high).
In September 2011, the SNB put a floor at 1.2000 in EUR/CHF, which is expected to hold in the foreseeable future.
Long 3 units at 1.2329, Objs: 1.2660/1.2985/1.3195, Stop: 1.1998 (Entered: 2013-01-23).
GOLD (in USD)
Trying to bounce.
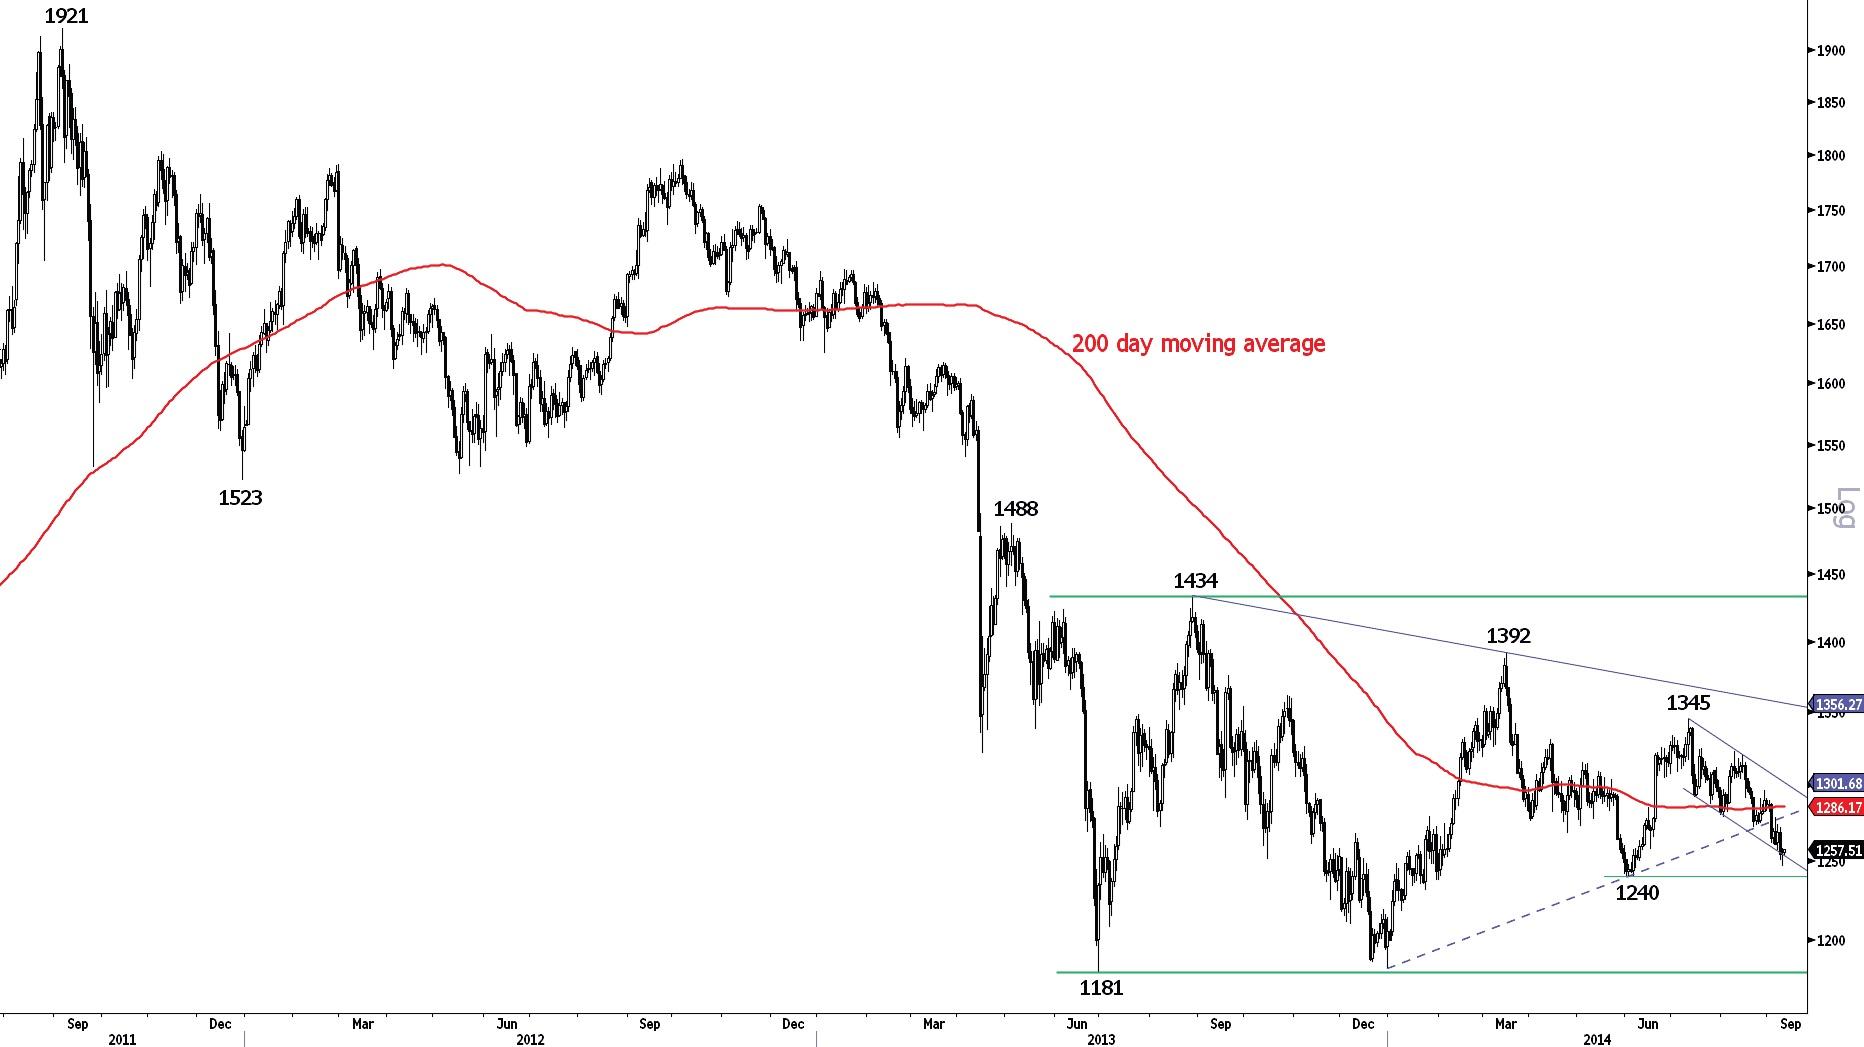
Gold made a significant daily lower shadow yesterday, suggesting a pickup in buying interest. Resistances can be found at 1278 (04/09/2014 high, see also the declining trendline) and 1297 (28/08/2014 high). A support stands at 1240.
In the long-term, we are sceptical that the horizontal range between the strong support at 1181 (28/06/2013 low) and the major resistance at 1434 (30/08/2013 high) is a long-term bullish reversal pattern. As a result, a decline towards the low of this range is eventually favoured. The recent break to the downside out of the symmetrical triangle confirms this scenario.
Await fresh signal.
SILVER (in USD)
Trying to bounce.
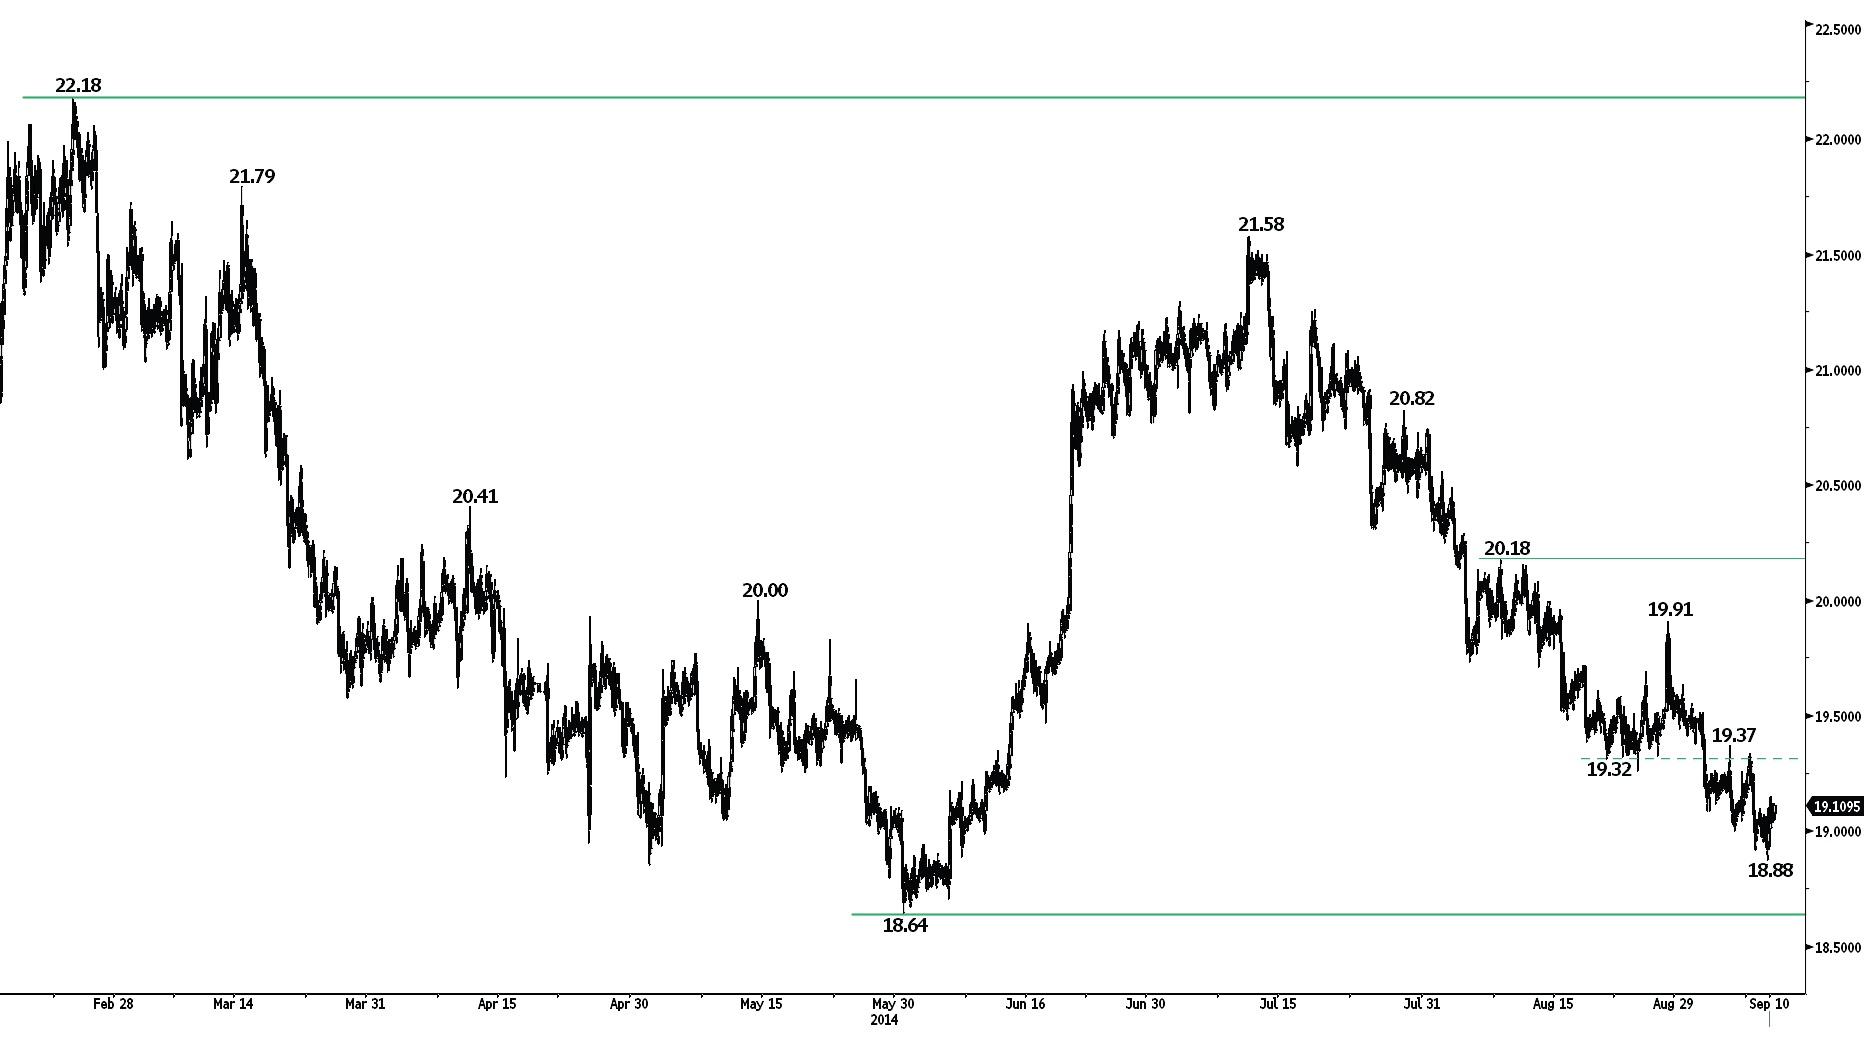
Silver is trying to bounce. Hourly resistances can be found at 19.37 (04/09/2014 high) and 19.64 (29/08/2014 high). An hourly support now lies at 18.88, while a key support stands at 18.64.
In the long-term, the trend is negative, as can be seen by the long-term succession of lower highs since the April 2011 peak. A test of the strong support area between 18.84 (31/12/2013 low) and 18.23 (28/06/2013 low) is expected. A key resistance lies at 22.18 (24/02/2014 high).
Await fresh signal.
This report has been prepared by Swissquote Bank Ltd and is solely been published for informational purposes and is not to be construed as a solicitation or an offer to buy or sell any currency or any other financial instrument. Views expressed in this report may be subject to change without prior notice and may differ or be contrary to opinions expressed by Swissquote Bank Ltd personnel at any given time. Swissquote Bank Ltd is under no obligation to update or keep current the information herein, the report should not be regarded by recipients as a substitute for the exercise of their own judgment.
Recommended Content
Editors’ Picks
AUD/USD hovers around 0.6500 amid light trading, ahead of US GDP

AUD/USD is trading close to 0.6500 in Asian trading on Thursday, lacking a clear directional impetus amid an Anzac Day holiday in Australia. Meanwhile, traders stay cautious due ti risk-aversion and ahead of the key US Q1 GDP release.
USD/JPY finds its highest bids since 1990, near 155.50

USD/JPY keeps breaking into its highest chart territory since June of 1990 early Thursday, testing 155.50 for the first time in 34 years as the Japanese Yen remains vulnerable, despite looming Japanese intervention risks. Focus shifts to Thursday's US GDP report and the BoJ decision on Friday.
Gold price lacks firm intraday direction, holds steady above $2,300 ahead of US data

Gold price remains confined in a narrow band for the second straight day on Thursday. Reduced Fed rate cut bets and a positive risk tone cap the upside for the commodity. Traders now await key US macro data before positioning for the near-term trajectory.
Injective price weakness persists despite over 5.9 million INJ tokens burned

Injective price is trading with a bearish bias, stuck in the lower section of the market range. The bearish outlook abounds despite the network's deflationary efforts to pump the price. Coupled with broader market gloom, INJ token’s doomed days may not be over yet.
Meta Platforms Earnings: META sinks 10% on lower Q2 revenue guidance Premium

This must be "opposites" week. While Doppelganger Tesla rode horrible misses on Tuesday to a double-digit rally, Meta Platforms produced impressive beats above Wall Street consensus after the close on Wednesday, only to watch the share price collapse by nearly 10%.
