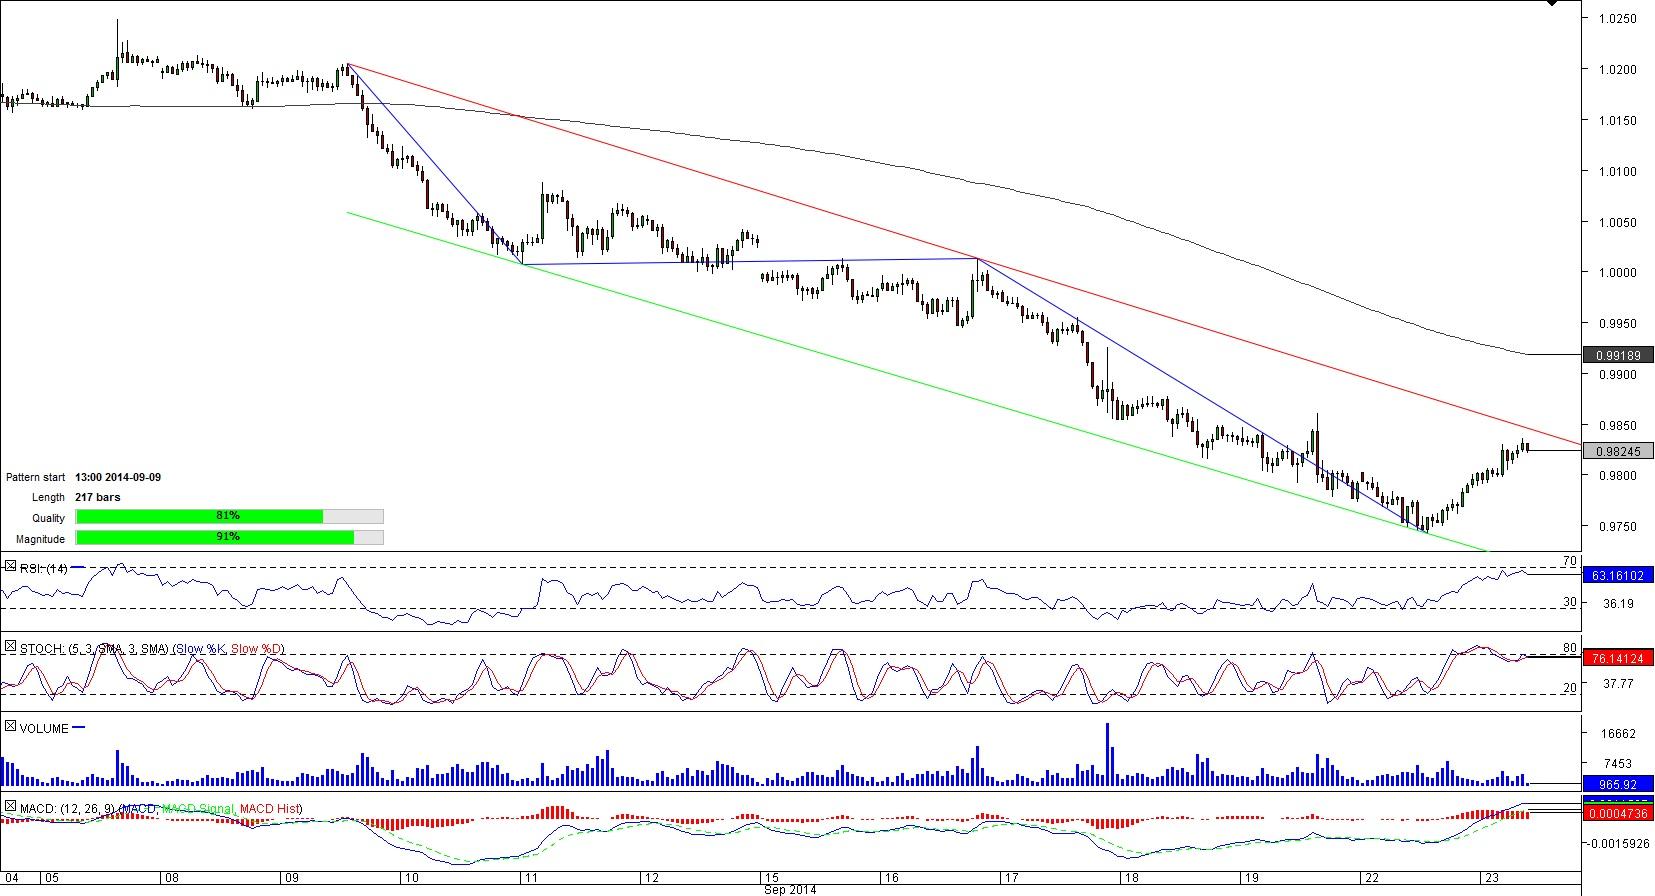
AUD/CAD 1H Chart: Channel Down
Comment: Since the beginning of September the pair has been trading sideways; however, as it failed to consolidate above the 1.02 mark, the Aussie started gradually losing value against the Canadian Dollar and on 9th of September entered a bearish channel. The formation represents 217-bar long channel down pattern with high quality and magnitude.
Currently, the pair is headed towards the upper boundary of the pattern, since it received a bullish impetus after a drop to the lowest level since February at 0.9743. Nonetheless, both—technical indicators and SWFX numbers, are neutral, thus we are suggesting to watch the movements around the current trading levels and we expect the pair to fall further.
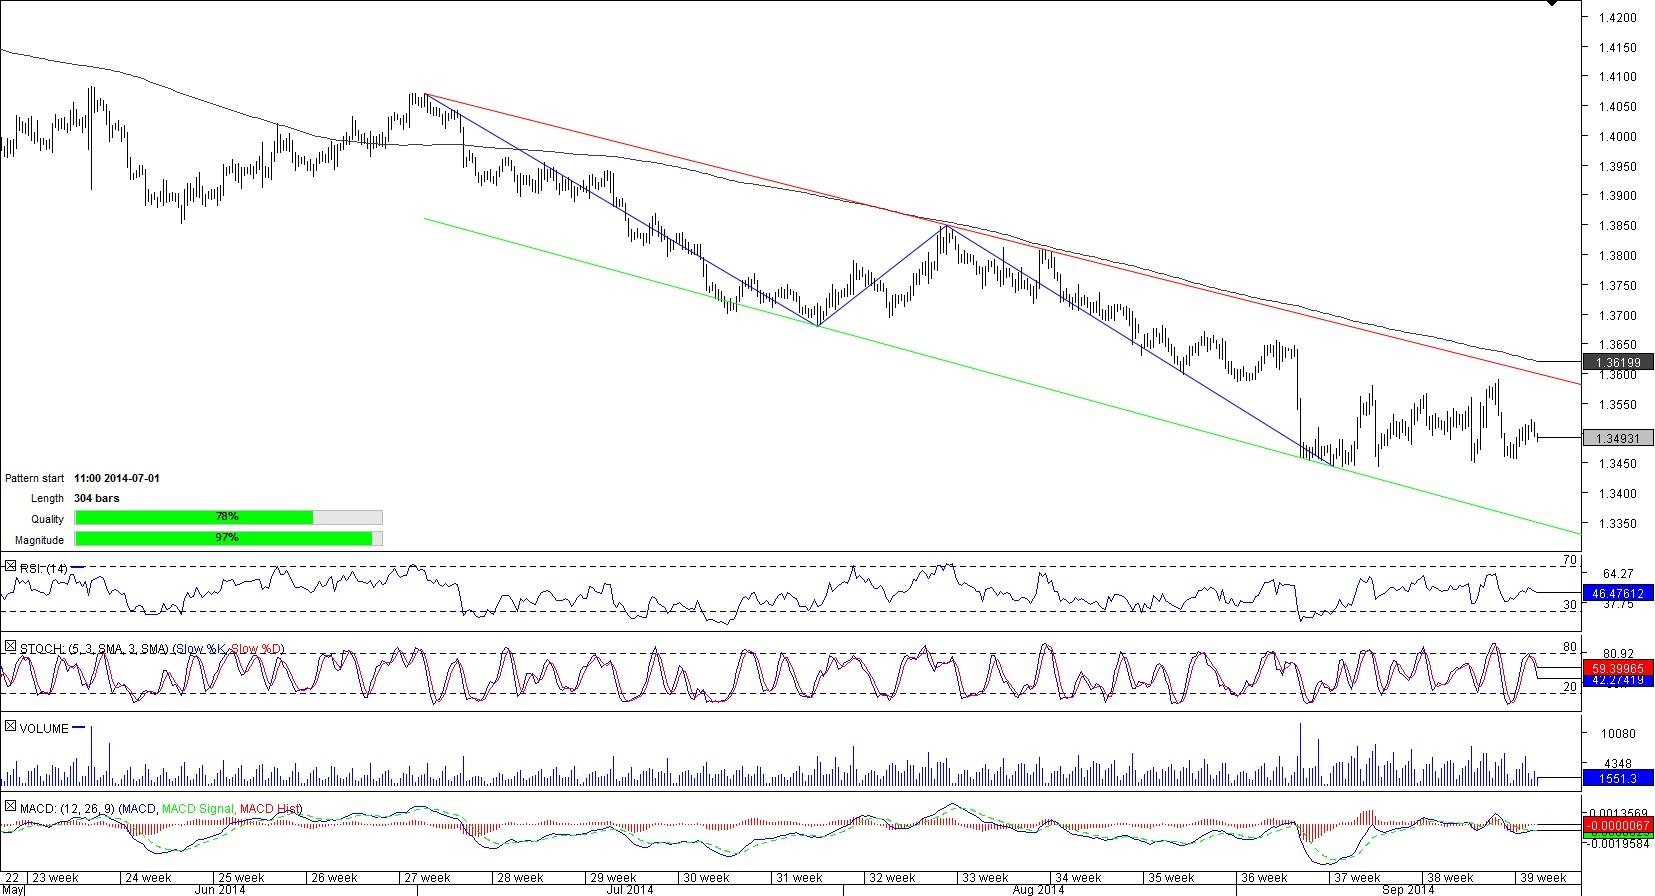
CHF/SGD 4H Chart: Channel Down
Comment: Already, since the beginning of March the Swissy has been depreciating against the Singapore’s Dollar and in early July it entered a bearish channel that now is a 304-bar long.
A few weeks ago the pair approached more than a year low at 1.3443, that has given some impulses for the currency couple to near the pattern’s resistance line around 1.3598. However, CHF/SGD still has not managed to touch the upper trend-line. The main obstacles for that has been the 4H and daily technical indicators that are largely bearish and the SWFX traders’ sentiment that is strongly to the downside (72.16%).
This overview can be used only for informational purposes. Dukascopy SA is not responsible for any losses arising from any investment based on any recommendation, forecast or other information herein contained.
Recommended Content
Editors’ Picks
AUD/USD hovers around 0.6500 amid light trading, ahead of US GDP

AUD/USD is trading close to 0.6500 in Asian trading on Thursday, lacking a clear directional impetus amid an Anzac Day holiday in Australia. Meanwhile, traders stay cautious due ti risk-aversion and ahead of the key US Q1 GDP release.
USD/JPY finds its highest bids since 1990, near 155.50

USD/JPY keeps breaking into its highest chart territory since June of 1990 early Thursday, testing 155.50 for the first time in 34 years as the Japanese Yen remains vulnerable, despite looming Japanese intervention risks. Focus shifts to Thursday's US GDP report and the BoJ decision on Friday.
Gold price lacks firm intraday direction, holds steady above $2,300 ahead of US data

Gold price remains confined in a narrow band for the second straight day on Thursday. Reduced Fed rate cut bets and a positive risk tone cap the upside for the commodity. Traders now await key US macro data before positioning for the near-term trajectory.
Injective price weakness persists despite over 5.9 million INJ tokens burned

Injective price is trading with a bearish bias, stuck in the lower section of the market range. The bearish outlook abounds despite the network's deflationary efforts to pump the price. Coupled with broader market gloom, INJ token’s doomed days may not be over yet.
Meta Platforms Earnings: META sinks 10% on lower Q2 revenue guidance Premium

This must be "opposites" week. While Doppelganger Tesla rode horrible misses on Tuesday to a double-digit rally, Meta Platforms produced impressive beats above Wall Street consensus after the close on Wednesday, only to watch the share price collapse by nearly 10%.

