CAD/CHF 1H Chart: Descending Triangle
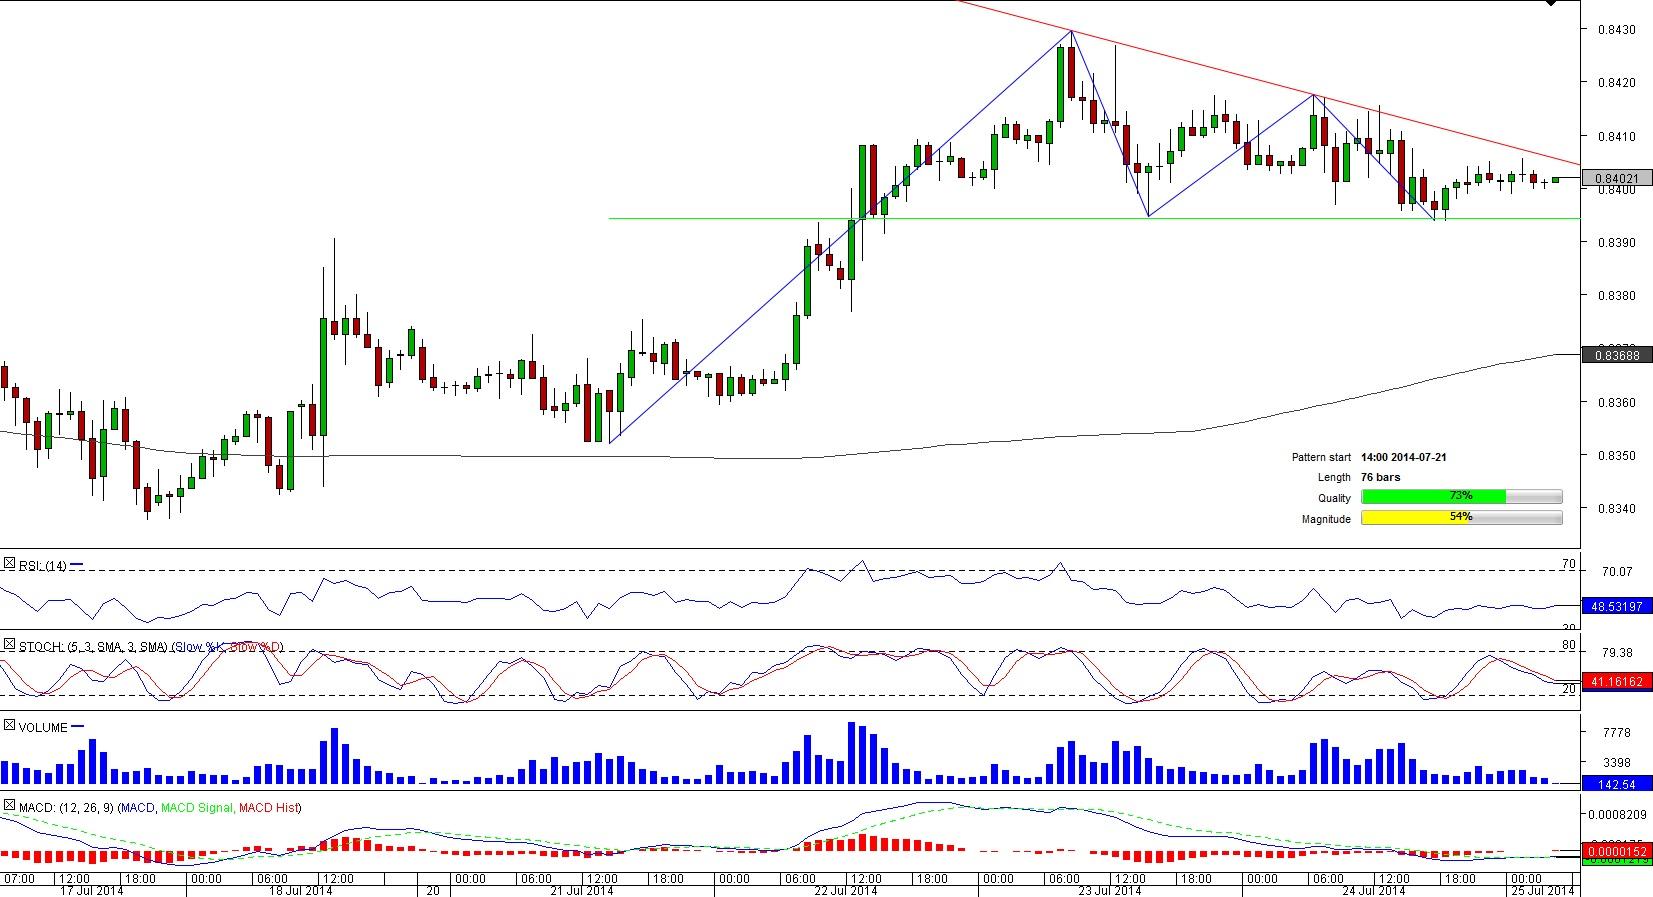
Comment: A week of strong gains by CAD/CHF ended after Jul 20 when the pair touched a seven-month high of 0.8431. After that, the pair has been less volatile but mostly bearishly-biased, being bounded by the trend-lines of the 76-bar long descending triangle.
At the moment, the Canadian Dollar is trading sideways compared to the Swiss Franc and notable changes in the pair’s trend may be expected not earlier than it crosses one of the triangle’s limits separated by only 10-pips wide area. Considering that the apex is due to be attained next Monday, Jul 28, there is not a plenty of time for the instrument to determine the direction of a breakout.
USD/CHF 1H Chart: Channel Up
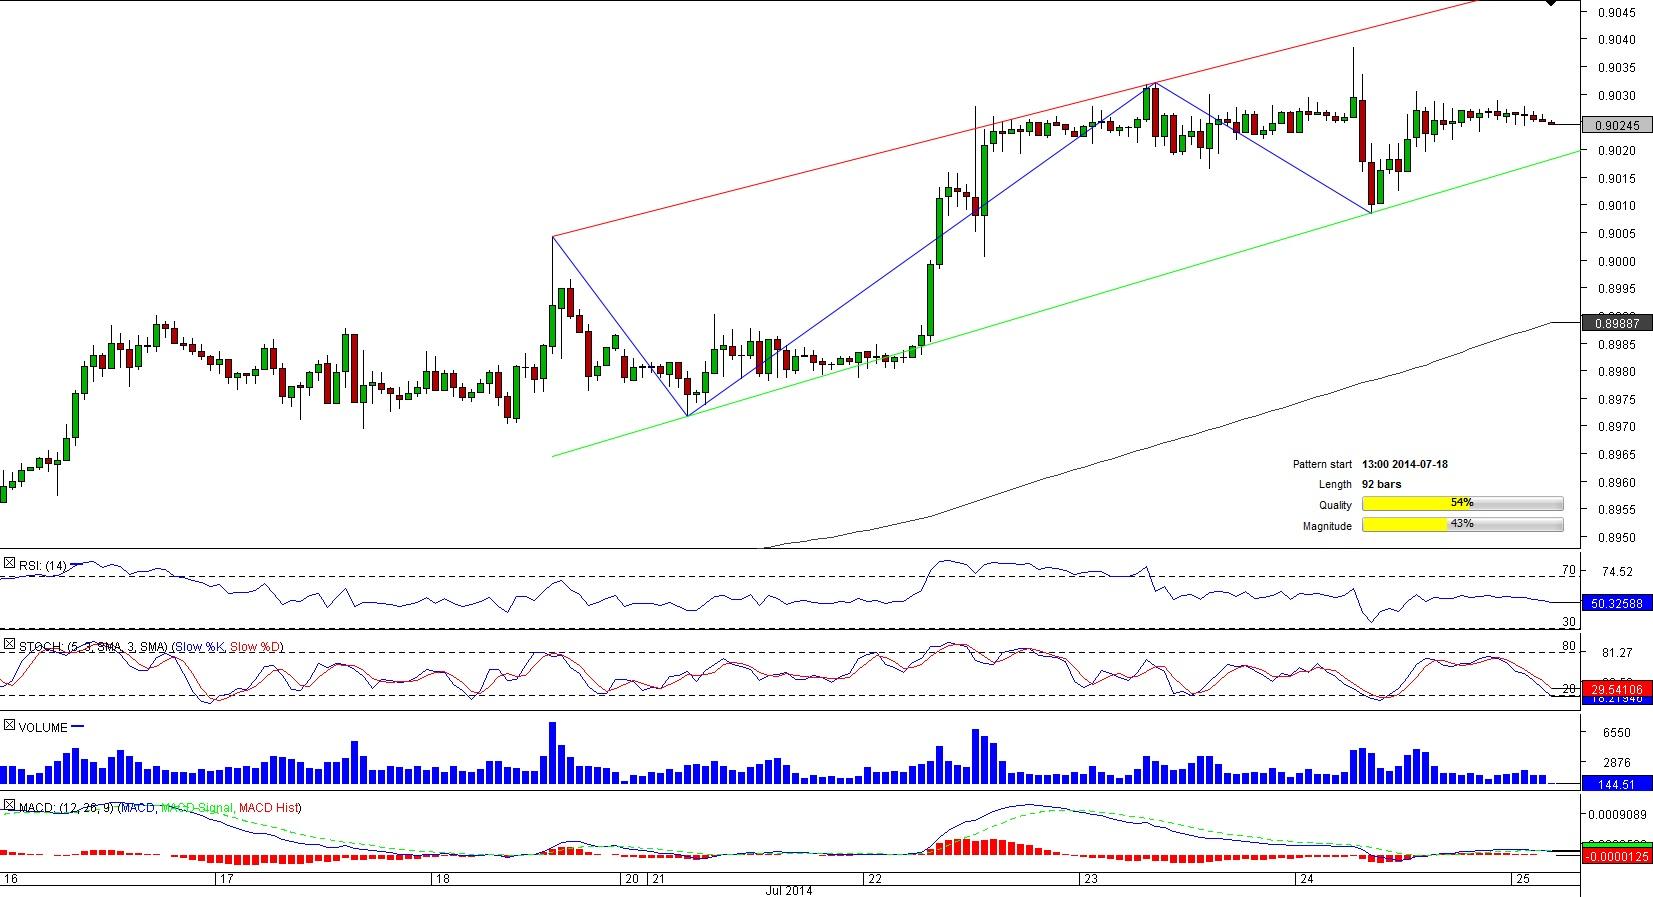
Comment: Since mid-July, the U.S. Dollar has been appreciating against the Swiss Franc and on Jul 18 the pair embarked upon formation of the bullish tunnel that now is over 90-bar long.
After a retreat that followed a rally to a six-month high of 0.9038 lying on the upper limit of the pattern, the pair was unable to re-approach the pattern’s resistance and now is sitting slightly above the 50-hour SMA at 0.9023. Technical data suggests the pair may witness some gains in the short-term, but the indicators fail to shed the light on the pair’s moves in a longer perspective.
AUD/USD 1H Chart: Channel Up
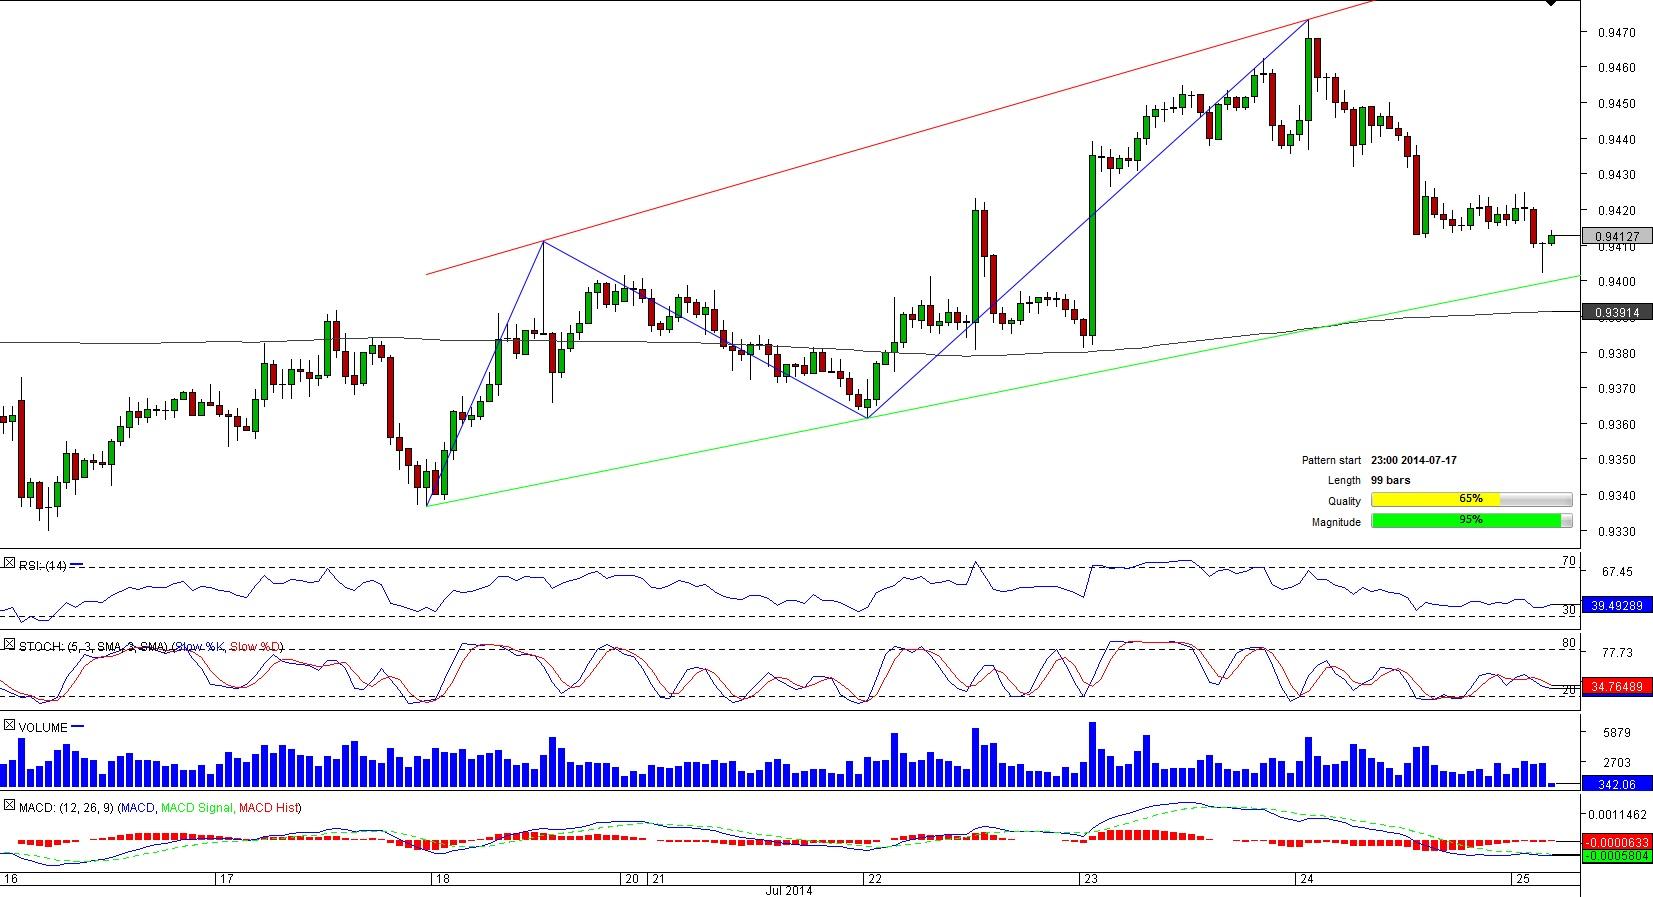
Comment: Almost a hundred-bar long and more than a 90-pips wide bullish corridor is now being shaped by AUD/USD on a one-hour chart.
Currently the instrument is moving in the northern direction and is likely to preserve this trend in the hours to come given the SWFX sentiment – more than 72% of market players hold long positions. To confirm prolong the winning streak, AUD/USD will have to overcome such hurdles as 0.9422 (four-hour R1) and 0.8434/45 (daily PP; 50-hour SMA; four-hour R2, R3), above which only 0.9456 (daily R1) may prevent the currency couple from confirming the pattern’s upper limit for the third time.
GBP/JPY 1H Chart: Double Bottom
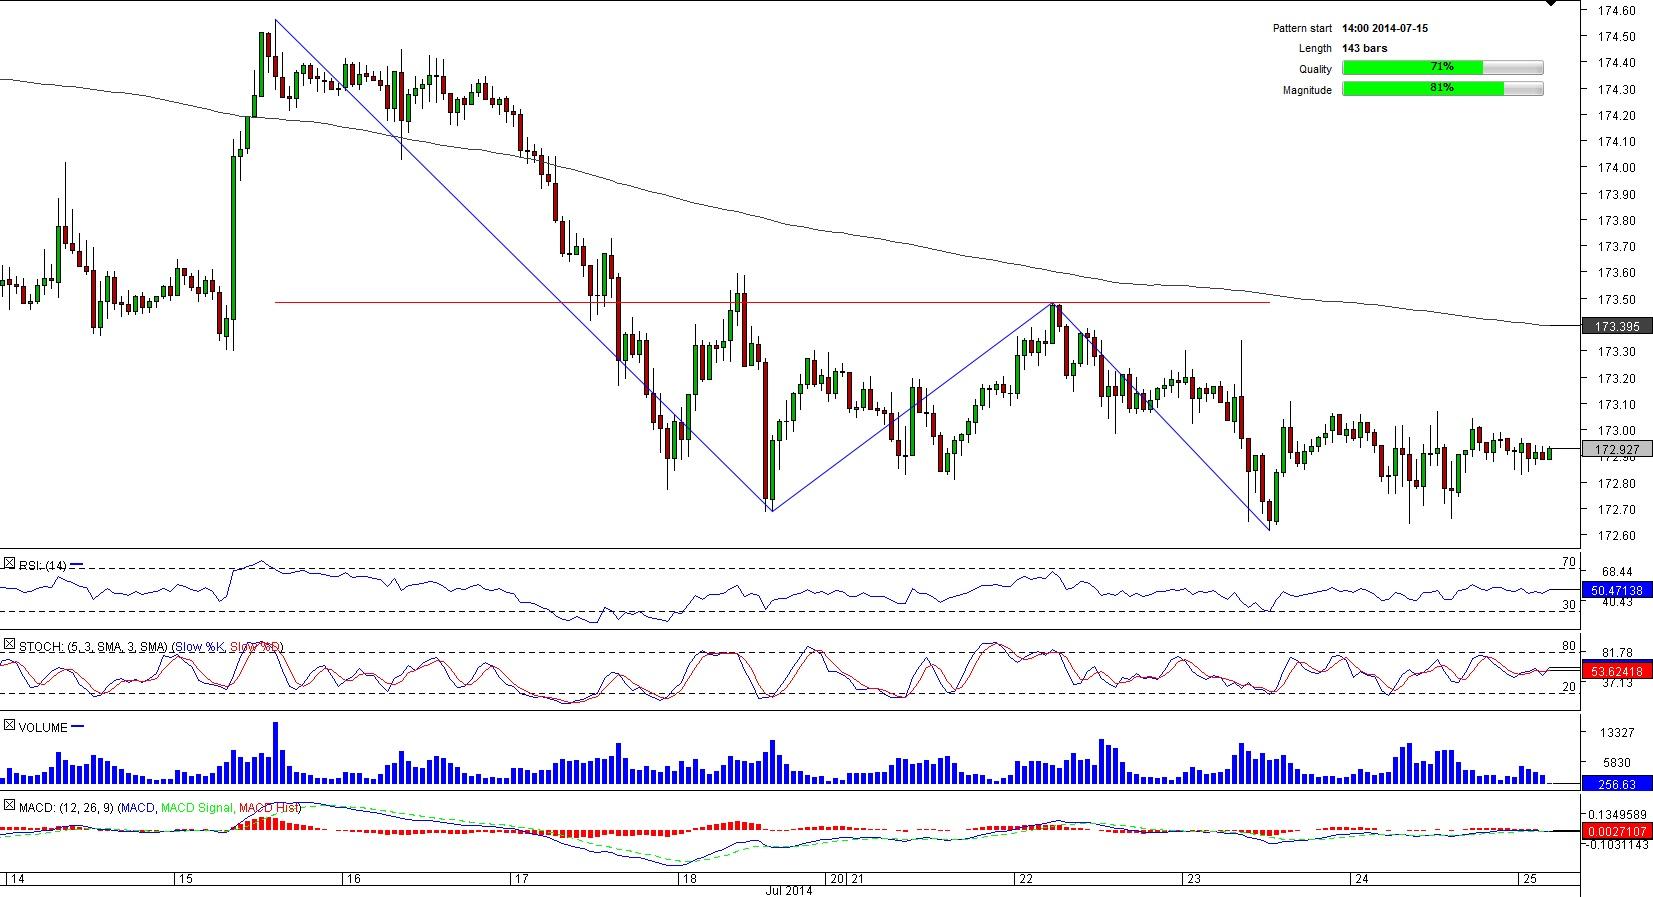
Comment: A rise to the seven-month high of 175.36 exhausted GBP/JPY potential and the pair was forced to commence a long-lasting decline that eventually pushed the instrument into a double bottom pattern. Although the currency pair started to erase losses after bottoming out at 172.62 for the second time two days earlier, the 50-hour SMA at 172.94 has been creating the headwind for a climb to the neck-line for the last 10 hours. In fact, even if the pair manages to surpass this formidable resistance, the levels of 173.03/10 (four-hour R2, R3; daily R1) and 173.30/9 (daily R2; 200-hour SMA) are likely to put selling pressure too heavy for GBP/JPY to withstand.
This overview can be used only for informational purposes. Dukascopy SA is not responsible for any losses arising from any investment based on any recommendation, forecast or other information herein contained.
Recommended Content
Editors’ Picks
EUR/USD consolidates recovery below 1.0700 amid upbeat mood

EUR/USD is consolidating its recovery but remains below 1.0700 in early Europe on Thursday. The US Dollar holds its corrective decline amid a stabilizing market mood, despite looming Middle East geopolitical risks. Speeches from ECB and Fed officials remain on tap.
GBP/USD advances toward 1.2500 on weaker US Dollar

GBP/USD is extending recovery gains toward 1.2500 in the European morning on Thursday. The pair stays supported by a sustained US Dollar weakness alongside the US Treasury bond yields. Risk appetite also underpins the higher-yielding currency pair. ahead of mid-tier US data and Fedspeak.
Gold appears a ‘buy-the-dips’ trade on simmering Israel-Iran tensions

Gold price attempts another run to reclaim $2,400 amid looming geopolitical risks. US Dollar pulls back with Treasury yields despite hawkish Fedspeak, as risk appetite returns.
Manta Network price braces for volatility as $44 million worth of MANTA is due to flood markets

Manta Network price is defending support at $1.80 as multiple technical indicators flash bearish. 21.67 million MANTA tokens worth $44 million are due to flood markets in a cliff unlock on Thursday.
Have we seen the extent of the Fed rate repricing?

Markets have been mostly consolidating recent moves into Thursday. We’ve seen some profit taking on Dollar longs and renewed demand for US equities into the dip. Whether or not this holds up is a completely different story.


