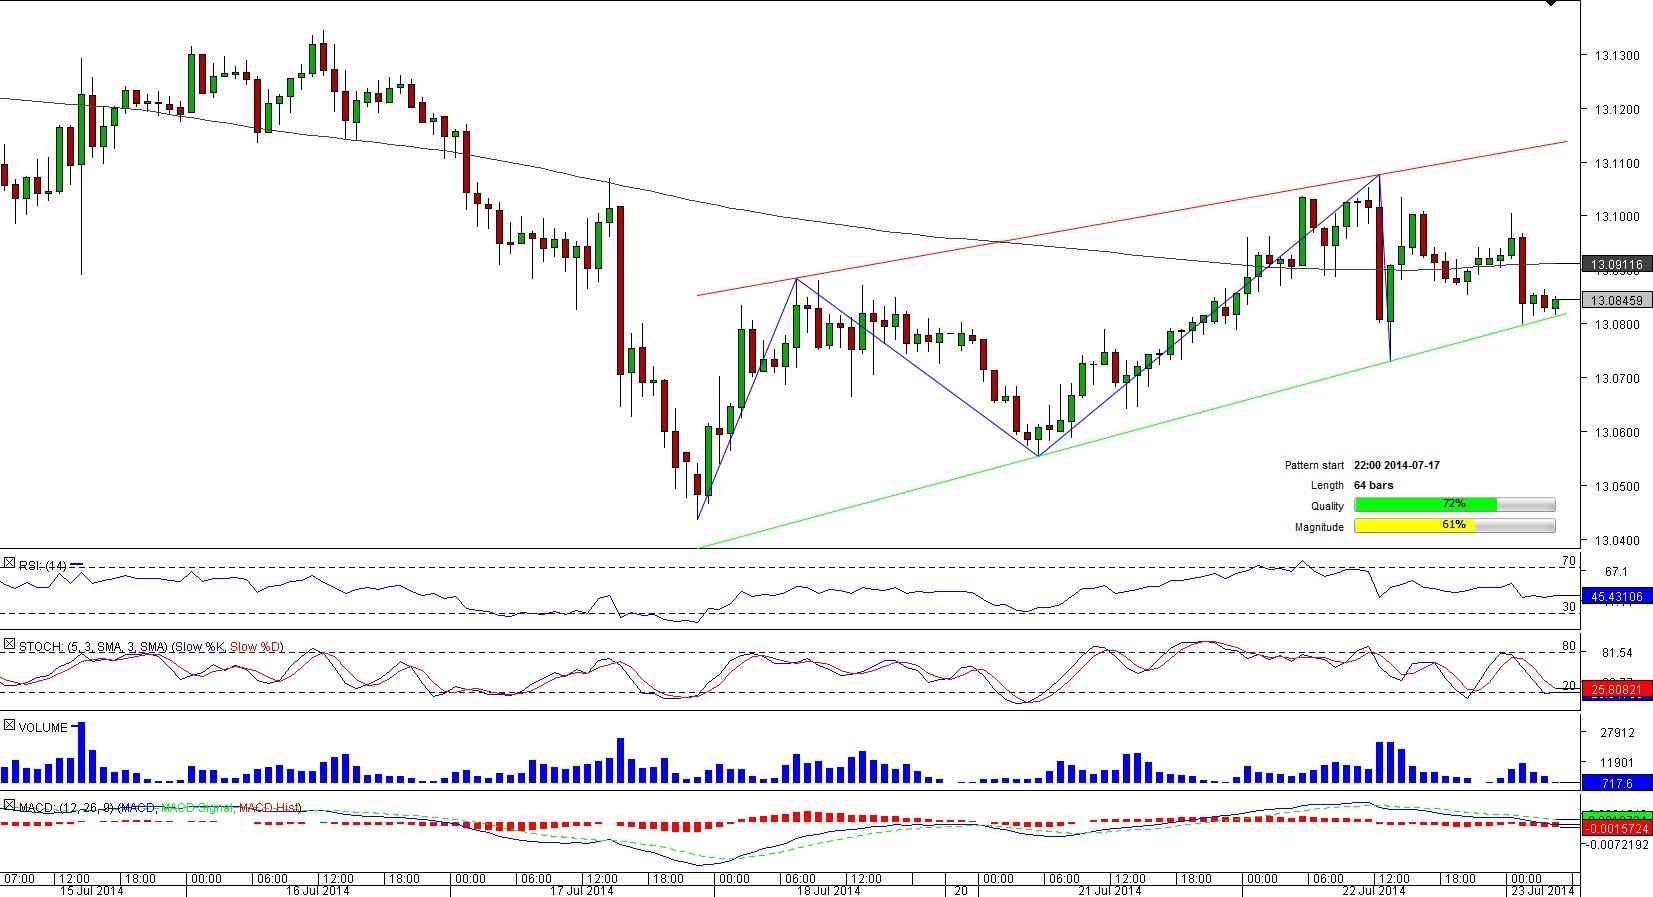
HKD/JPY 1H Chart: Rising Wedge
Comment: HKD/JPY has been locked in a narrowing trading range bounded by two steadily converging, upward-sloping lines for the last 64 hours.
Now the pair of two Asian currencies is headed towards the lower trendline of the rising wedge pattern but the 50-hour SMA at 13.0911 is preventing HKD/JPY from confirming the pattern’s limit one more time. Technical indicators suggest the pair is not likely to overcome this resistance in the next hour but there may be a rebound in the mediumterm followed by a decline in one-day perspective.
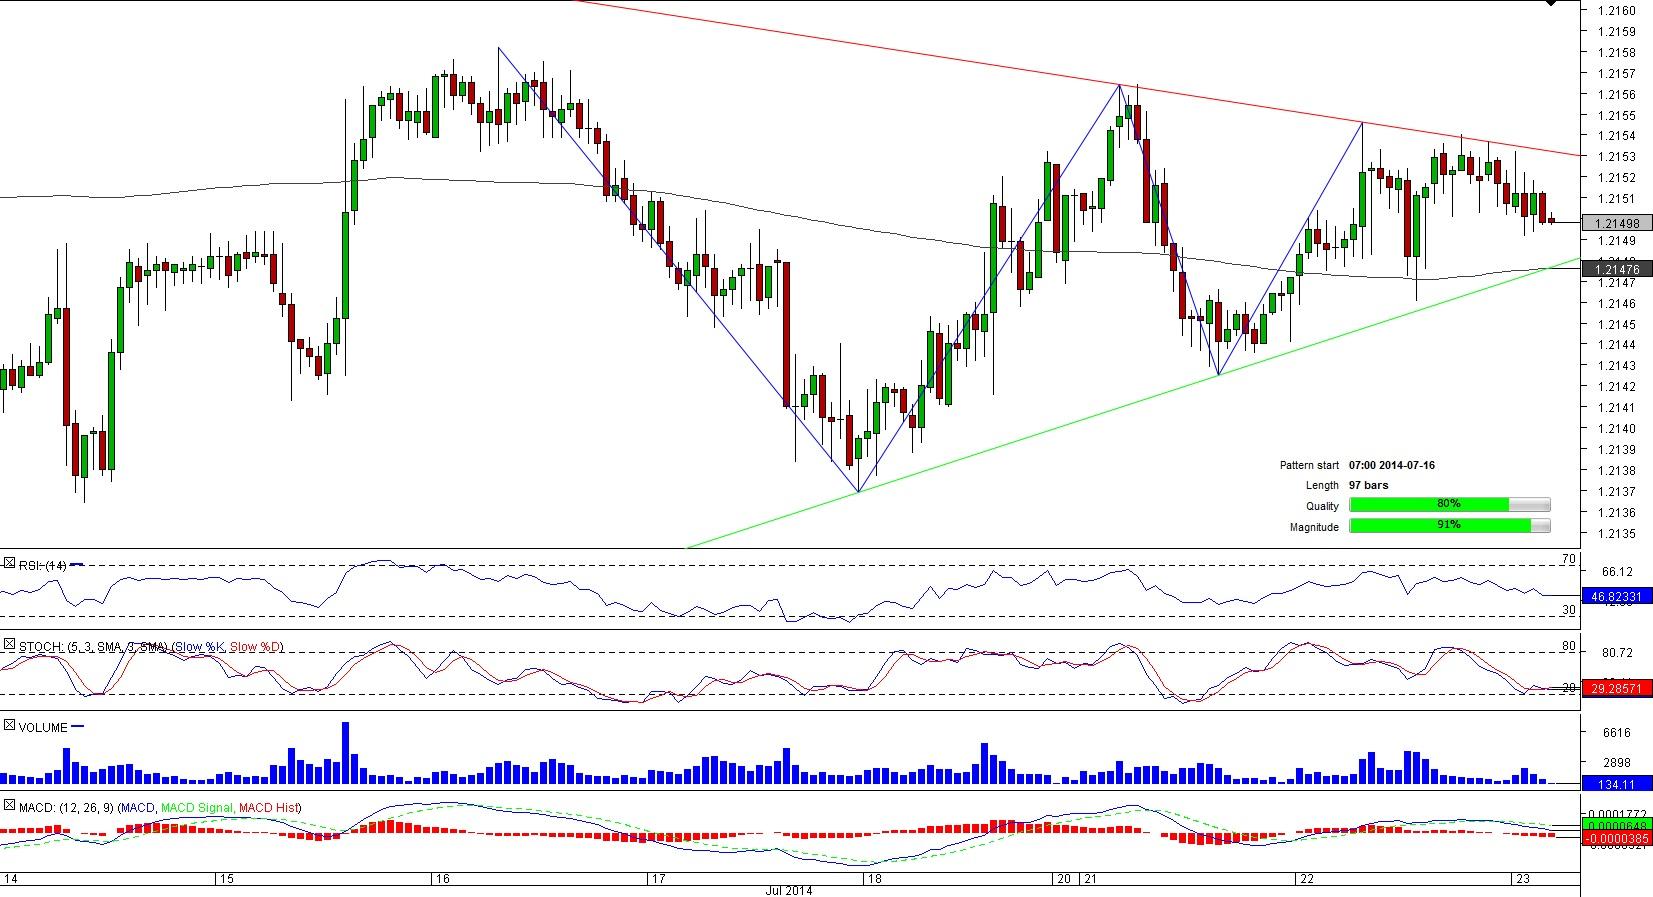
EUR/CHF 1H Chart: Triangle
Comment: After being in the down-trend during almost two months ended early July, EUR/CHF levelled off and by the middle of the month entered a symmetrical triangle that is circa a hundred-bar long.
The instrument now is vacillating in only a five-pips wide range and the trading area is likely to continue narrowing since the triangle trend-lines are due to converge a day later. Meanwhile, the direction of the looming exit still seems unclear. On the one hand, the pair is on the way of falling to the lower boundary of the pattern, on the other hand, the SWFX data reveals almost 70% of traders bet on appreciation of the pair in the hours to come.
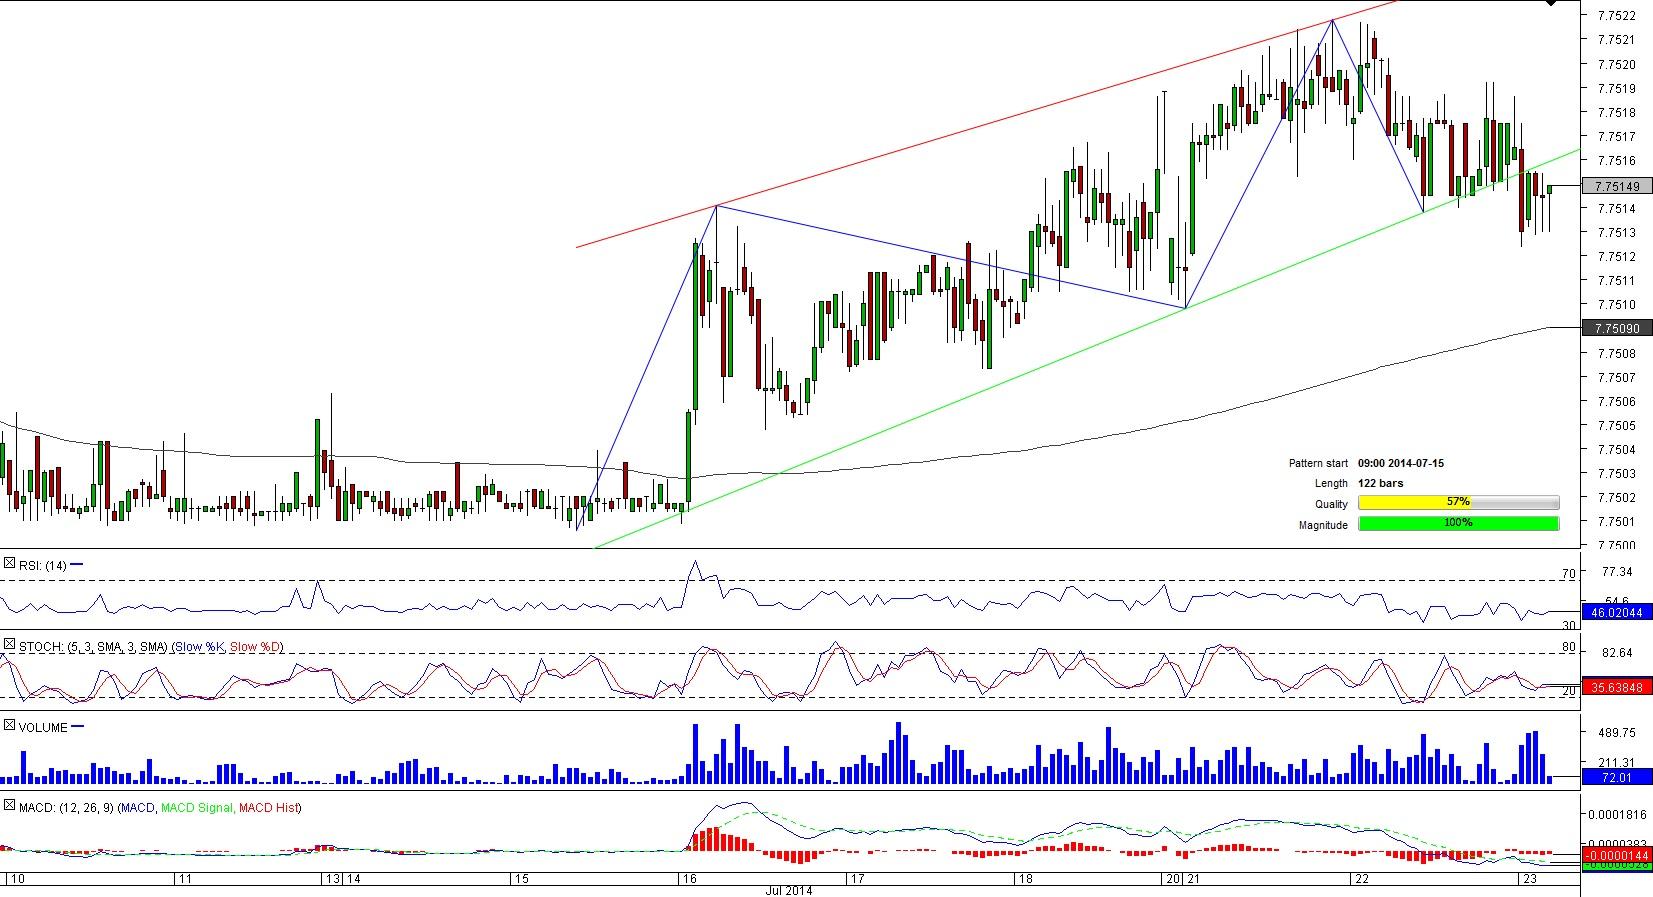
USD/HKD 1H Chart: Rising Wedge
Comment: A two-week period of unusual tranquillity ended in mid-July, when the U.S. Dollar embarked upon a rapid appreciation versus its Hong Kong counterpart. However, now the upswing may have come to an end since USD/HKD has plunged below the lower limit of the rising wedge pattern the pair shaped throughout its advance. If the pair extends its losing streak – the likelihood of bearish scenario is rather high – USD/HKD may slide to the 7.7513/2 (daily S1; four-hour S1). In case this obstacle fails to mollify selling pressure, the pair may test 7.7509/6 (four-hour S2, S3; daily S2; 200-hour SMA), below which the mark of 7.7505 (daily S3) may become the last stop before a massive sell-off.
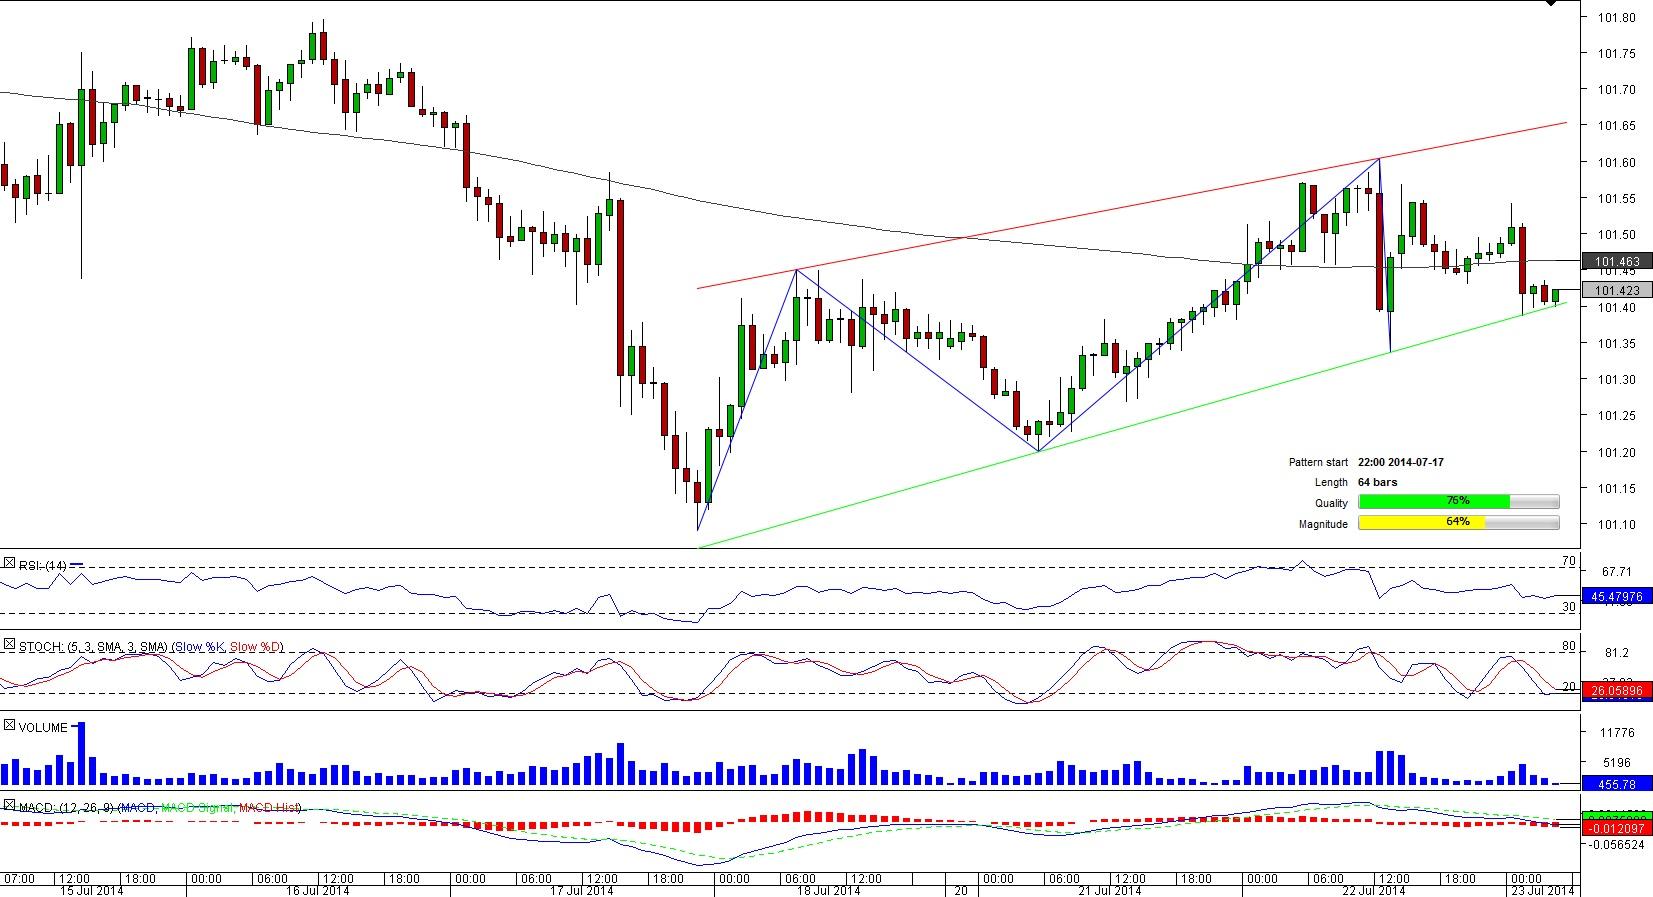
USD/JPY 1H Chart: Rising Wedge
Comment: The Hong Kong Dollar was not the only Asian currency that lost some value against the greenback in the second part of July. The U.S. Dollar also managed to notably solidify its position against the Japanese Yen by entering a 64-bar long rising wedge pattern on Jul 17.
However, in contrast to USD/HKD trend, the upturn of USD/JPY is not likely to end before long given the SWFX sentiment. The SWFX indeed data boosts optimism – two traders out of three hold long positions even at a time when the 50-hour SMA at 101.41 pressed USD/JPY to the pattern’s support line and is likely to act as a formidable resistance if the pair attempts to materialize traders’ expectations.
This overview can be used only for informational purposes. Dukascopy SA is not responsible for any losses arising from any investment based on any recommendation, forecast or other information herein contained.
Recommended Content
Editors’ Picks
AUD/USD remained bid above 0.6500

AUD/USD extended further its bullish performance, advancing for the fourth session in a row on Thursday, although a sustainable breakout of the key 200-day SMA at 0.6526 still remain elusive.
EUR/USD faces a minor resistance near at 1.0750

EUR/USD quickly left behind Wednesday’s small downtick and resumed its uptrend north of 1.0700 the figure, always on the back of the persistent sell-off in the US Dollar ahead of key PCE data on Friday.
Gold holds around $2,330 after dismal US data

Gold fell below $2,320 in the early American session as US yields shot higher after the data showed a significant increase in the US GDP price deflator in Q1. With safe-haven flows dominating the markets, however, XAU/USD reversed its direction and rose above $2,340.
Bitcoin price continues to get rejected from $65K resistance as SEC delays decision on spot BTC ETF options

Bitcoin (BTC) price has markets in disarray, provoking a broader market crash as it slumped to the $62,000 range on Thursday. Meanwhile, reverberations from spot BTC exchange-traded funds (ETFs) continue to influence the market.
US economy: slower growth with stronger inflation

The dollar strengthened, and stocks fell after statistical data from the US. The focus was on the preliminary estimate of GDP for the first quarter. Annualised quarterly growth came in at just 1.6%, down from the 2.5% and 3.4% previously forecast.


