USD/CAD 1H Chart: Channel Up
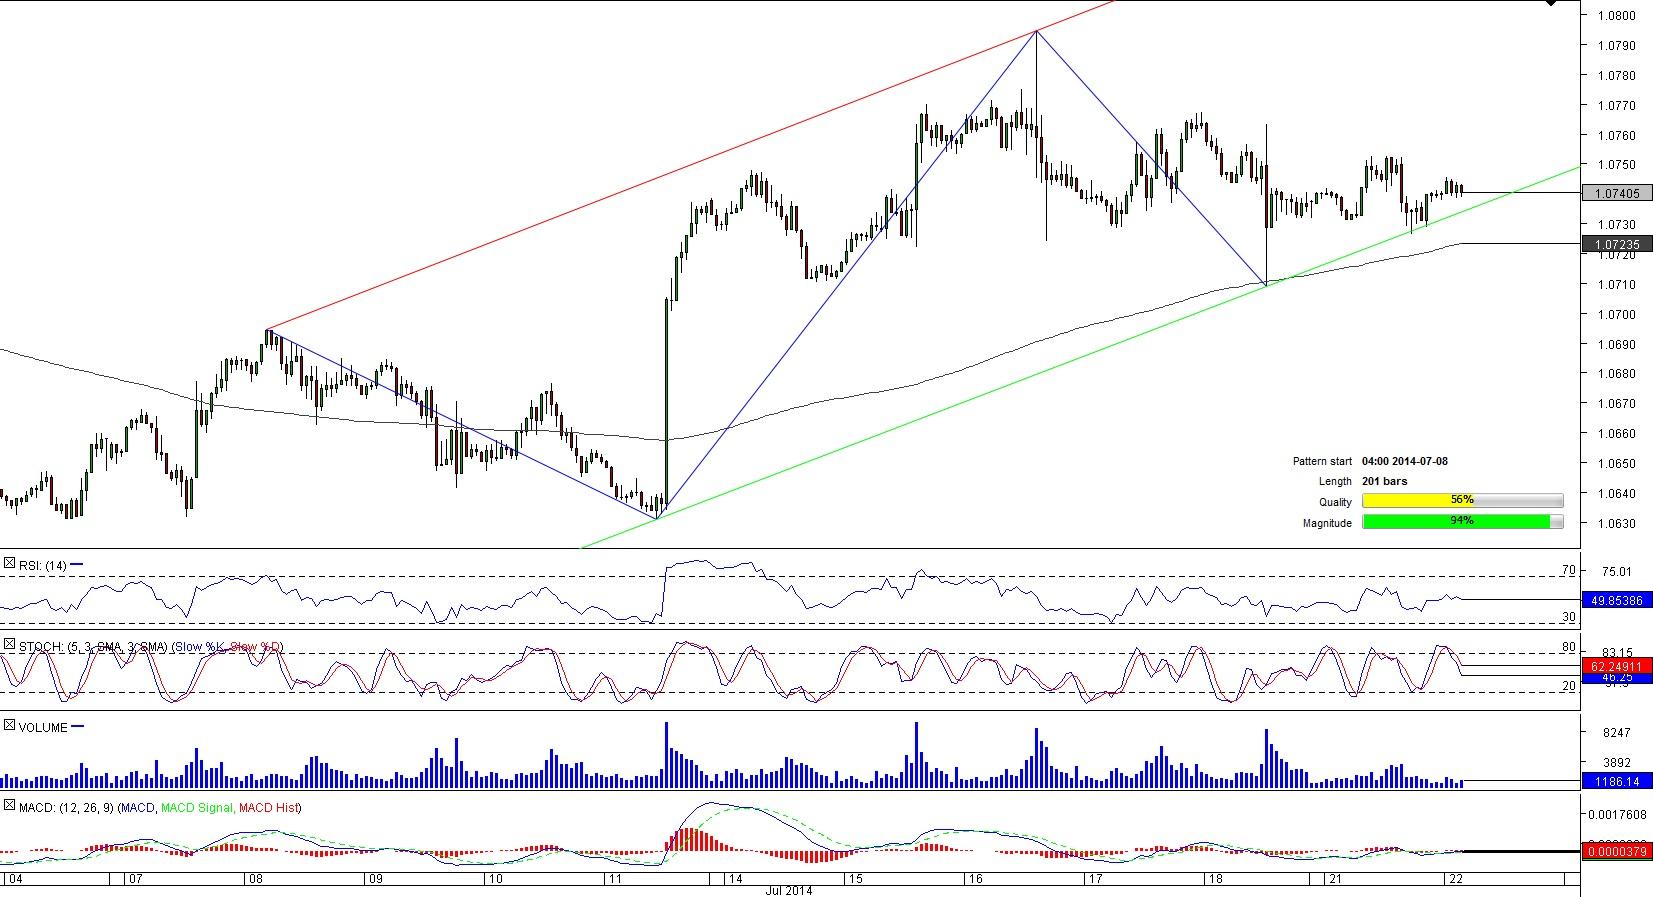
Comment: A dive to a 10-month low of 1.0620 in the very beginning of July provoked a long-lasting appreciation of the greenback versus the loonie performed within the area bounded by two parallel upward-sloping lines.
The pair now is located near the lower trend-line and may remain there as the 50-hour SMA at 1.0739 is blocking the upswing, while the pattern’s support is preventing the pair from a bearish exit. Meanwhile, traders’ sentiment on the SWFX is almost neutral – 53% of positions are long, while 47% are short. Furthermore, technical indicators send a clear signal only for long-term, pointing to a possible climb in one-day perspective.
EUR/USD 1H Chart: Channel Down
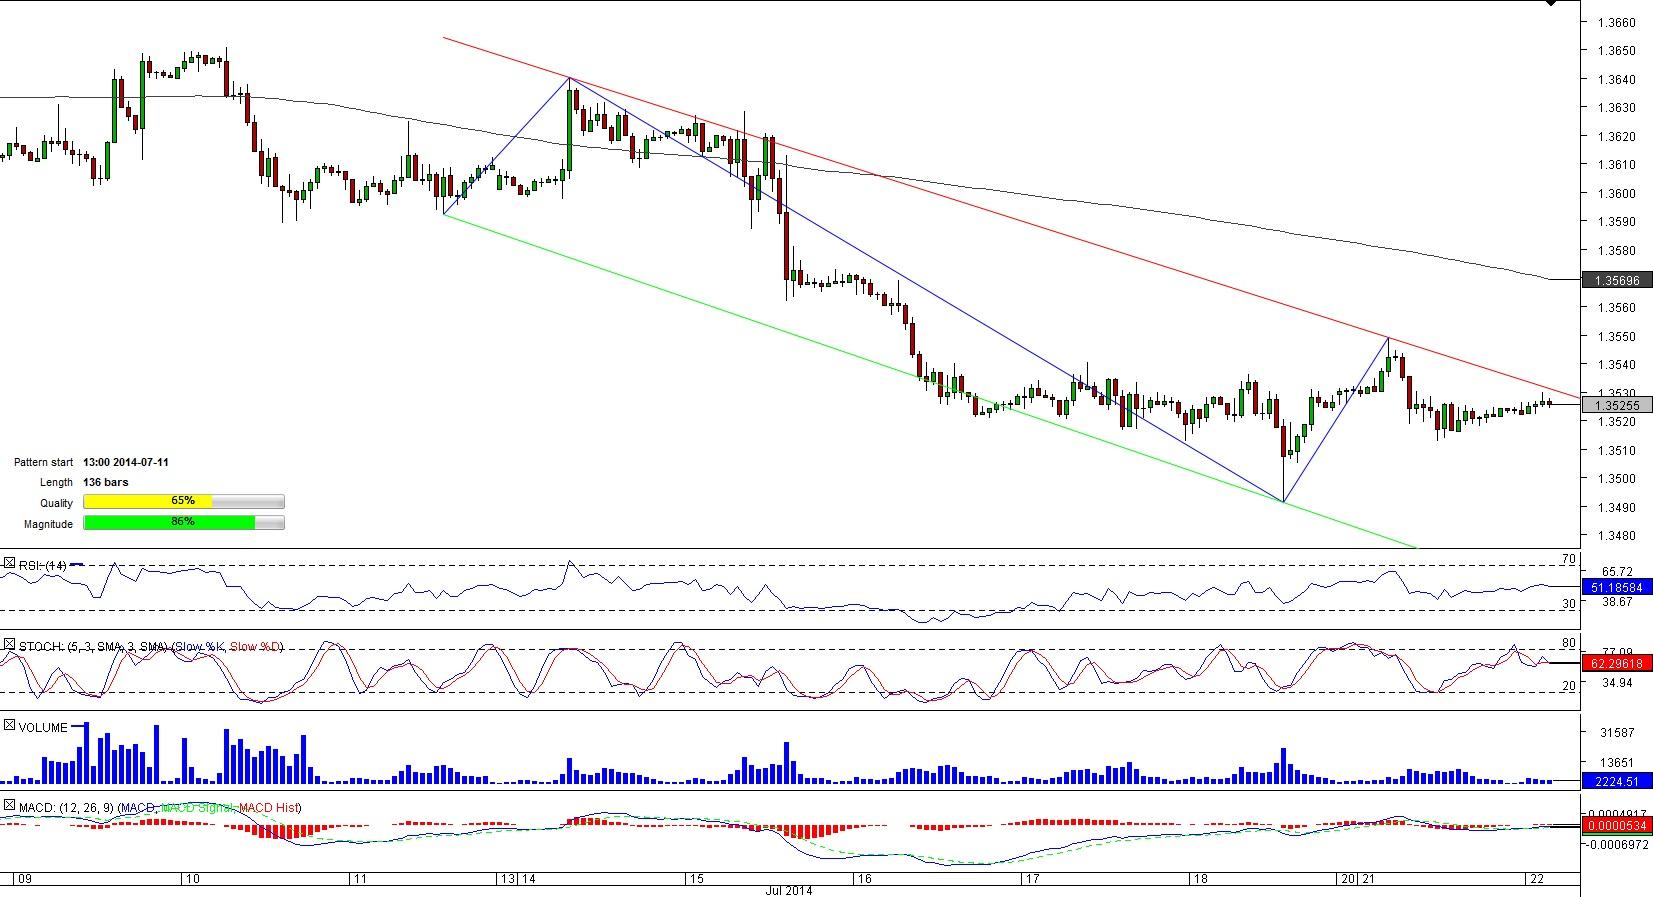
Comment: The most popular currency pair, EUR/USD, has been in a sharp down-trend since mid-July and on Jul 18 the instrument hit a five-month low of 1.3492 located at the lower limit of the 136-bar long channel down pattern. After bottoming out at the this low, the pair managed to pare losses and now is fluctuating near the short-term SMA at 1.3524. If the pair prolongs its winning streak, it is likely to attain the upper trend-line of the formation, a jump above which may lead to a breakout. However, market players are not so confident in pair’s ability to perform a rally – only 53% of all orders are placed to buy the pair.
XAU/USD 1H Chart: Triangle
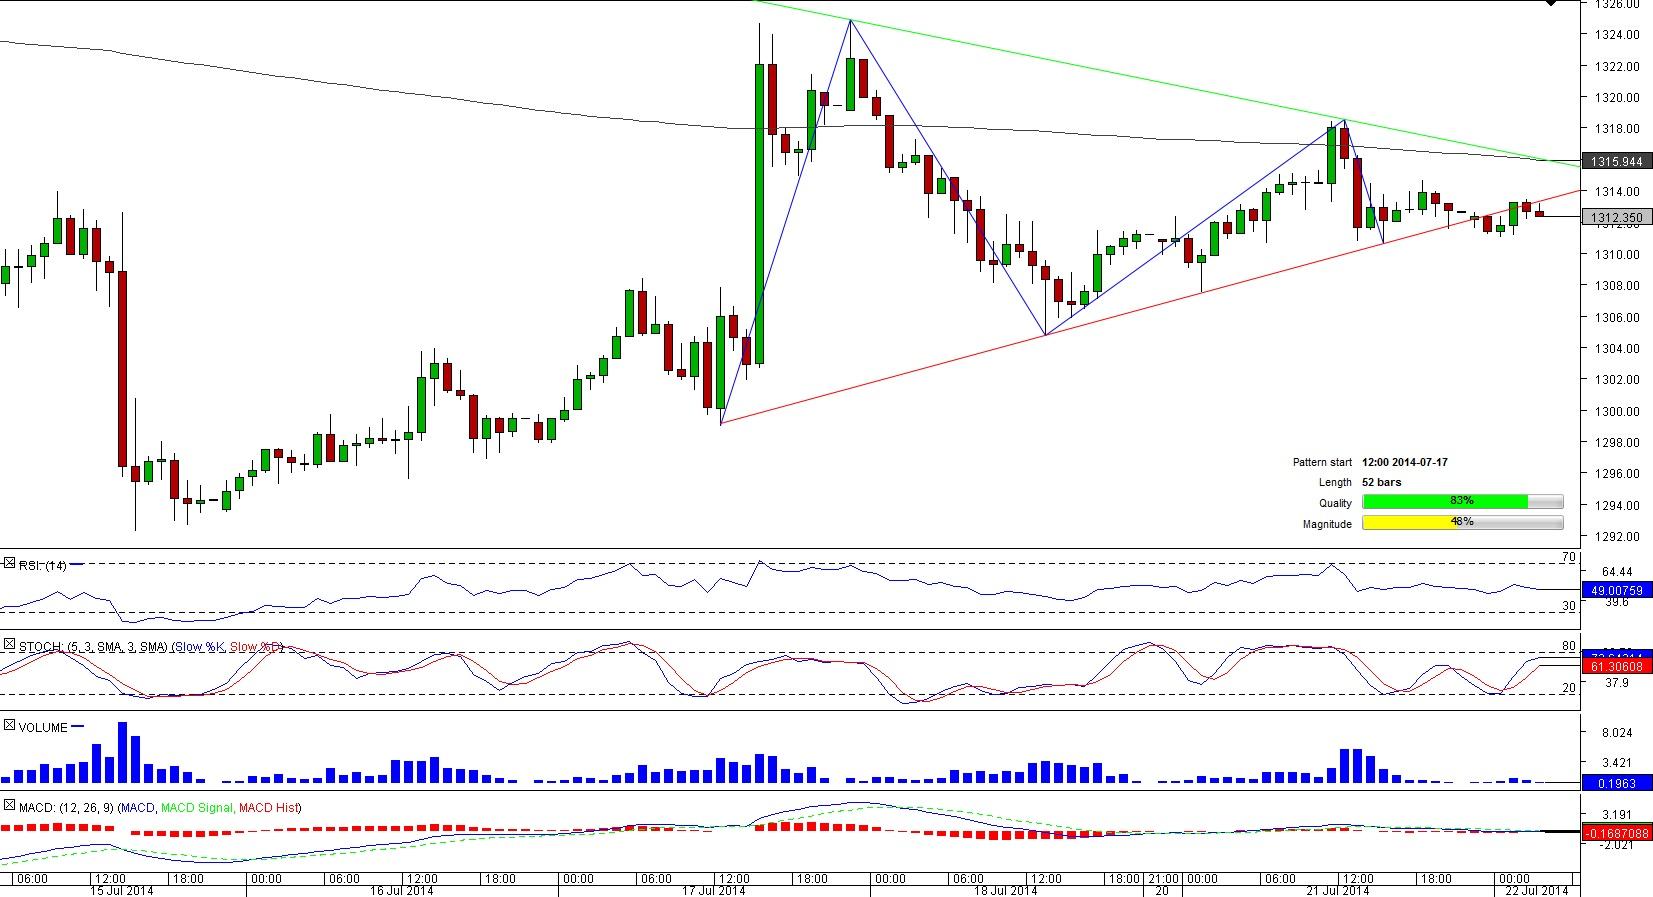
Comment: A four-month high of 1,345.61 reached in the first part of July forced the shiny yellow metal to perform a rapid retreat. After the decline, the bullion was trapped by a short, only 52-bar long, symmetrical triangle, inside which XAU/USD to has been trading in a narrowing range.
At the moment, the proximity of the apex supports the idea that gold has exited the triangle in earnest and a notable drop may lie ahead. At the same time, market players do not expect a sell-off to happen, being bullish in more than 72% of cases, according to the SWFX data.
EUR/GBP 1H Chart: Triangle
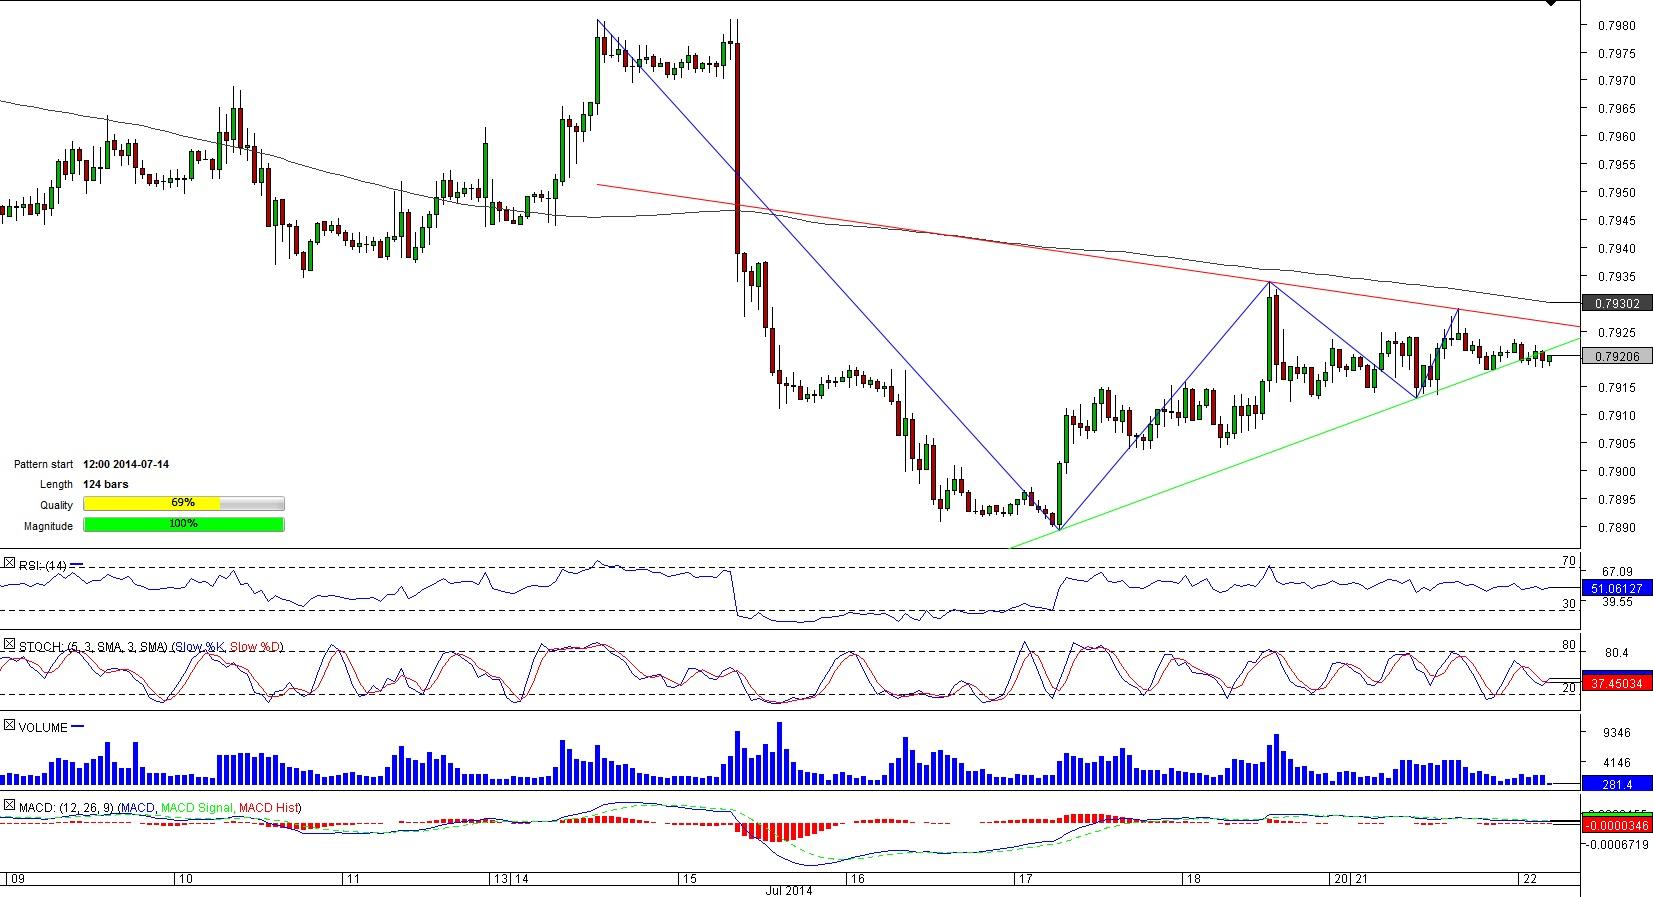
Comment: EUR/GBP has transformed a channel down pattern examined a day earlier into a symmetrical triangle and now the instrument is on the brink of an accelerating decline that often follows a bearish exit this type of patterns. The SWFX numbers prop up this view– two traders out of three hold short positions, meaning EUR/GBP may plunge below the 50-hour SMA and four-hour S1 at 0.7918/7 that act as a strong support zone. If overcome, the short-term SMA may push the mark of 0.7915/3 (four-hour SS2, S3; daily S1) to the fore, below which only two levels – 0.7905 (daily S2) and 0.7898 (daily S3) are capable to stop the downswing.
This overview can be used only for informational purposes. Dukascopy SA is not responsible for any losses arising from any investment based on any recommendation, forecast or other information herein contained.
Recommended Content
Editors’ Picks
AUD/USD failed just ahead of the 200-day SMA

Finally, AUD/USD managed to break above the 0.6500 barrier on Wednesday, extending the weekly recovery, although its advance faltered just ahead of the 0.6530 region, where the key 200-day SMA sits.
EUR/USD met some decent resistance above 1.0700

EUR/USD remained unable to gather extra upside traction and surpass the 1.0700 hurdle in a convincing fashion on Wednesday, instead giving away part of the weekly gains against the backdrop of a decent bounce in the Dollar.
Gold keeps consolidating ahead of US first-tier figures

Gold finds it difficult to stage a rebound midweek following Monday's sharp decline but manages to hold above $2,300. The benchmark 10-year US Treasury bond yield stays in the green above 4.6% after US data, not allowing the pair to turn north.
Bitcoin price could be primed for correction as bearish activity grows near $66K area

Bitcoin (BTC) price managed to maintain a northbound trajectory after the April 20 halving, despite bold assertions by analysts that the event would be a “sell the news” situation. However, after four days of strength, the tables could be turning as a dark cloud now hovers above BTC price.
Bank of Japan's predicament: The BOJ is trapped

In this special edition of TradeGATEHub Live Trading, we're joined by guest speaker Tavi @TaviCosta, who shares his insights on the Bank of Japan's current predicament, stating, 'The BOJ is Trapped.'


