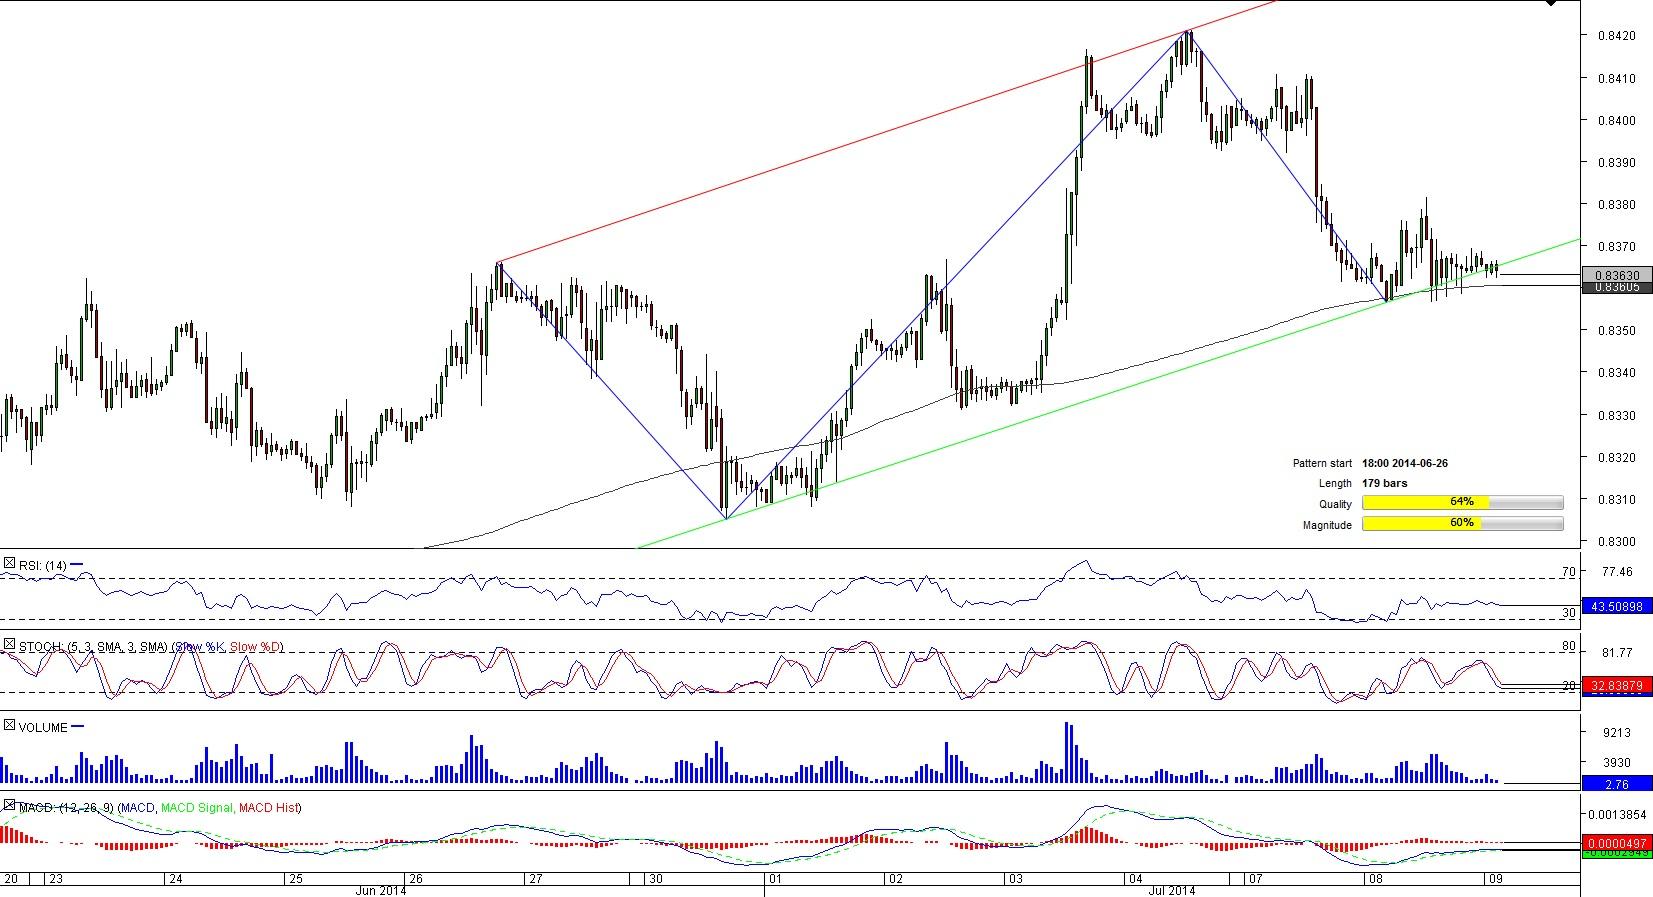
CAD/CHF 1H Chart: Channel Up
Comment: A drop to a three-year low of 0.7806 in mid-March provoked a long-lasting appreciation of the loonie against the Swiss Franc.
However, the bullish trend might have come to an end since the currency couple plunged below the lower limit of the 179-bar long channel up pattern. Now the instrument is sitting at the 200-hour SMA at 0.8360, a strong support zone reinforced by the four-hour S1. If this mark is broken, the currency couple is likely to move down to 0.8357/4 (four-hour S2, S3; daily S1), below which only 0.8342 (daily s2) and 0.8329 (daily S3) are capable of preventing a massive sell-off.
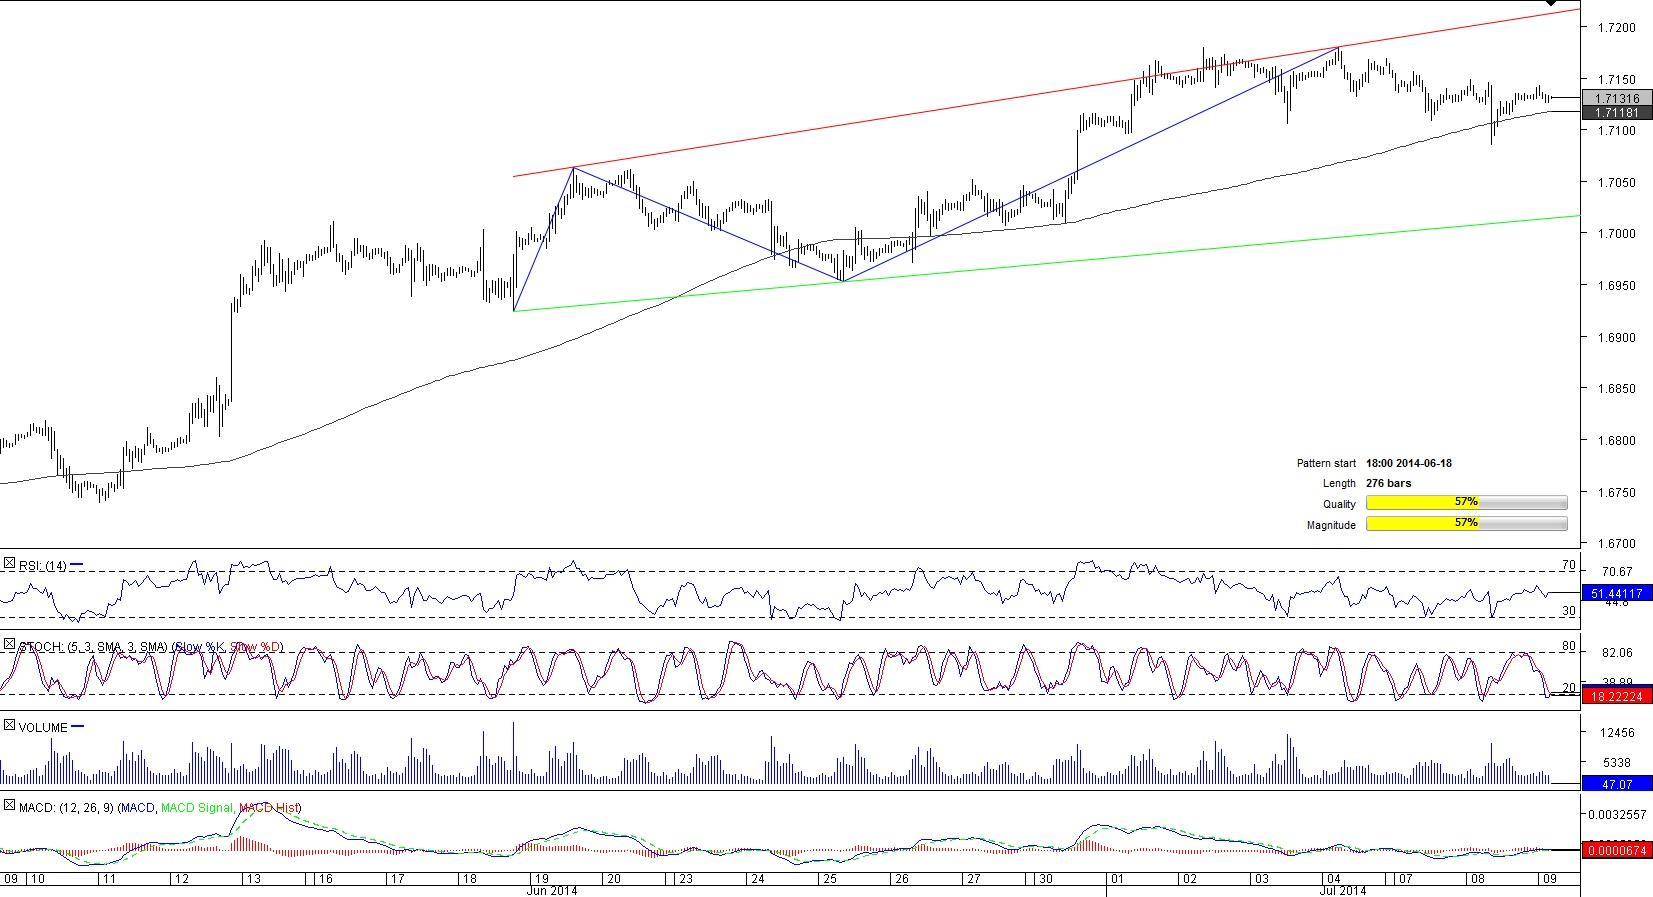
GBP/USD 1H Chart: Channel Up
Comment: Since the beginning of the year, the British Pound has been unremittingly gaining value versus the greenback. This helped the pair to attain 1.7180, the highest level since at least 2009 that lies on the upper trend-line of the bullish tunnel, inside which GBP/USD is vacillating now.
Despite being able to consolidate above the 50-hour SMA at 1.7131 about an hour earlier, the currency couple still is under the risk of halting its winning streak given the disposition of the SMAs. The short-term SMA is approaching the long-term SMA at 1.7118; if the 50-hour SMA dives below the 200-hour SMA, the ‘death cross’ will occur thus putting a notable selling pressure on the instrument.
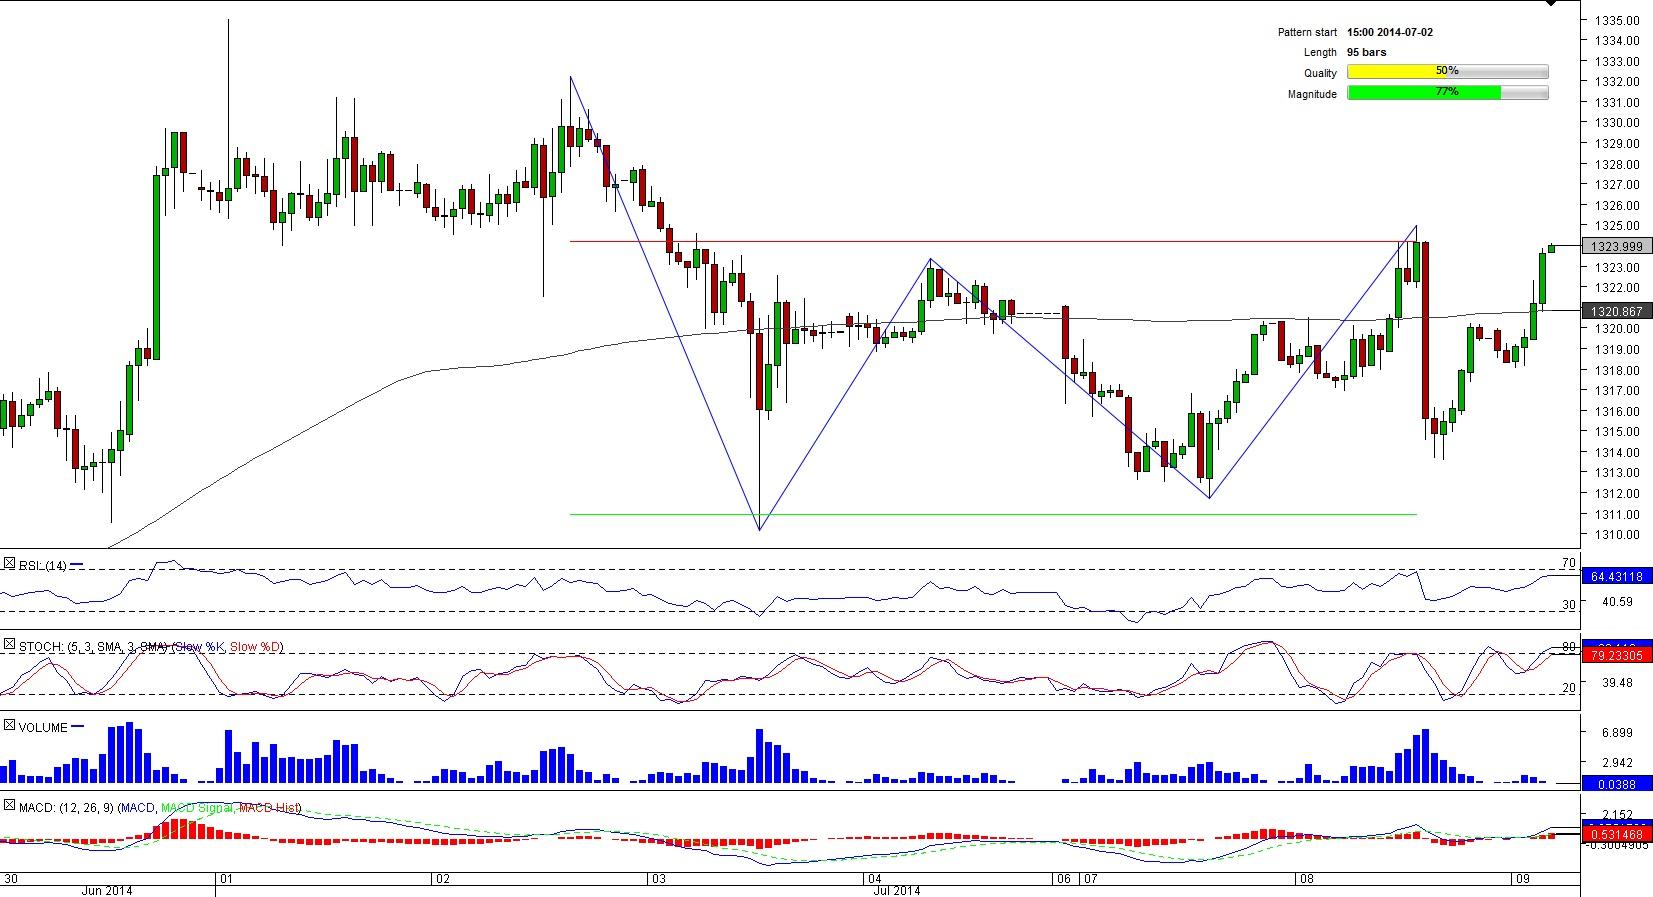
XAU/USD 1H Chart: Rectangle
Comment: XAU/USD has already confirmed the trend-lines of the 95-bar long rectangle for several times but the recent stab to the pattern’s resistance may not lead to a usual retreat. The pair jumped above this formidable level two hours earlier and considering bullishness on the market – over 71% of all orders are placed to buy the bullion – we may witness an upward exit followed by a further escalation in the hours to come. To make this come true, the pair has to overcome 1,324.33/7.64 (daily R1; four-hour R1, R2) as well as 1,330.33/1.42 (daily R2; four-hour R3) that will open the way towards a three-month high of 1,335.00.
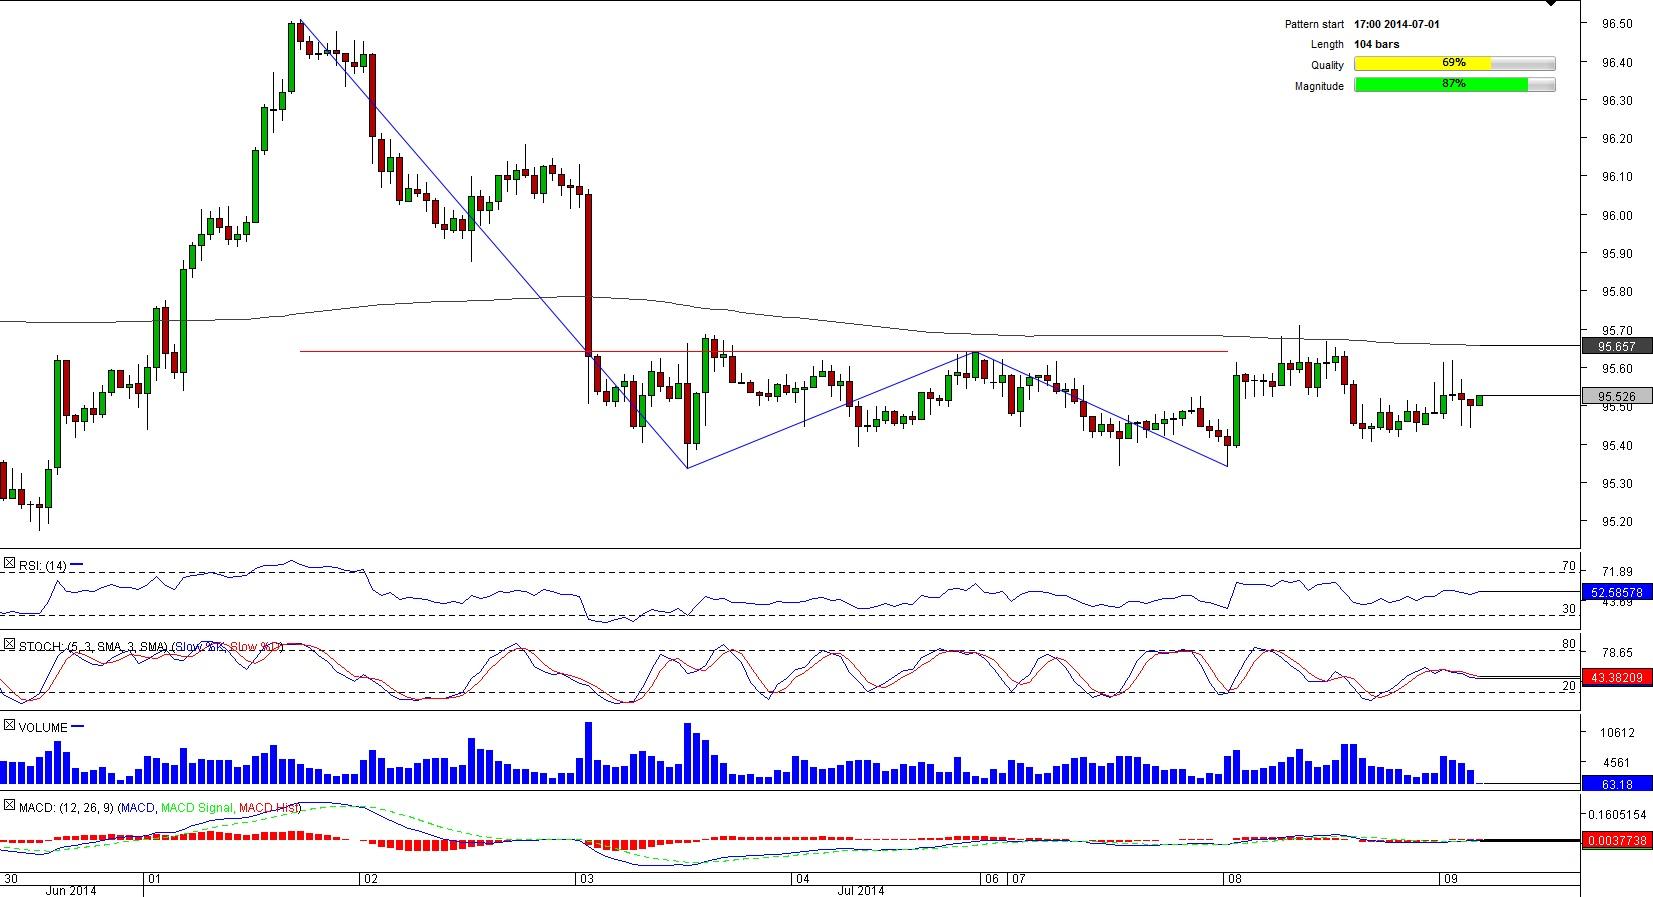
AUD/JPY 1H Chart: Double Bottom
Comment: A double bottom pattern formed by AUD/JPY originated at a three-month high of 96.50 hit early July and has already lasted for 104 hours. Surprisingly, we did not see a breakout a day earlier after the pair managed to penetrate the neck-line at 95.64. The reason is that the pair failed to surpass the 200-hour SMA and was forced to come back to the area beneath the neck-line. However, the instrument is likely to receive a bullish impulse soon taking into account that 84% of traders on the SWFX bet on appreciation of the pair. Notwithstanding this, the pair’s ability to exit the pattern remains questionable as the neck-line is still well-supported by the 200-hour SMA.
This overview can be used only for informational purposes. Dukascopy SA is not responsible for any losses arising from any investment based on any recommendation, forecast or other information herein contained.
Recommended Content
Editors’ Picks
EUR/USD hovers around 1.0700 after German IFO data

EUR/USD stays in a consolidation phase at around 1.0700 in the European session on Wednesday. Upbeat IFO sentiment data from Germany helps the Euro hold its ground as market focus shifts to US Durable Goods Orders data.
USD/JPY refreshes 34-year high, attacks 155.00 as intervention risks loom

USD/JPY is renewing a multi-decade high, closing in on 155.00. Traders turn cautious on heightened risks of Japan's FX intervention. Broad US Dollar rebound aids the upside in the major. US Durable Goods data are next on tap.
Gold price trades with mild negative bias, manages to hold above $2,300 ahead of US data

Gold price (XAU/USD) edges lower during the early European session on Wednesday, albeit manages to hold its neck above the $2,300 mark and over a two-week low touched the previous day.
Worldcoin looks set for comeback despite Nvidia’s 22% crash Premium

Worldcoin price is in a better position than last week's and shows signs of a potential comeback. This development occurs amid the sharp decline in the valuation of the popular GPU manufacturer Nvidia.
Three fundamentals for the week: US GDP, BoJ and the Fed's favorite inflation gauge stand out Premium

While it is hard to predict when geopolitical news erupts, the level of tension is lower – allowing for key data to have its say. This week's US figures are set to shape the Federal Reserve's decision next week – and the Bank of Japan may struggle to halt the Yen's deterioration.


