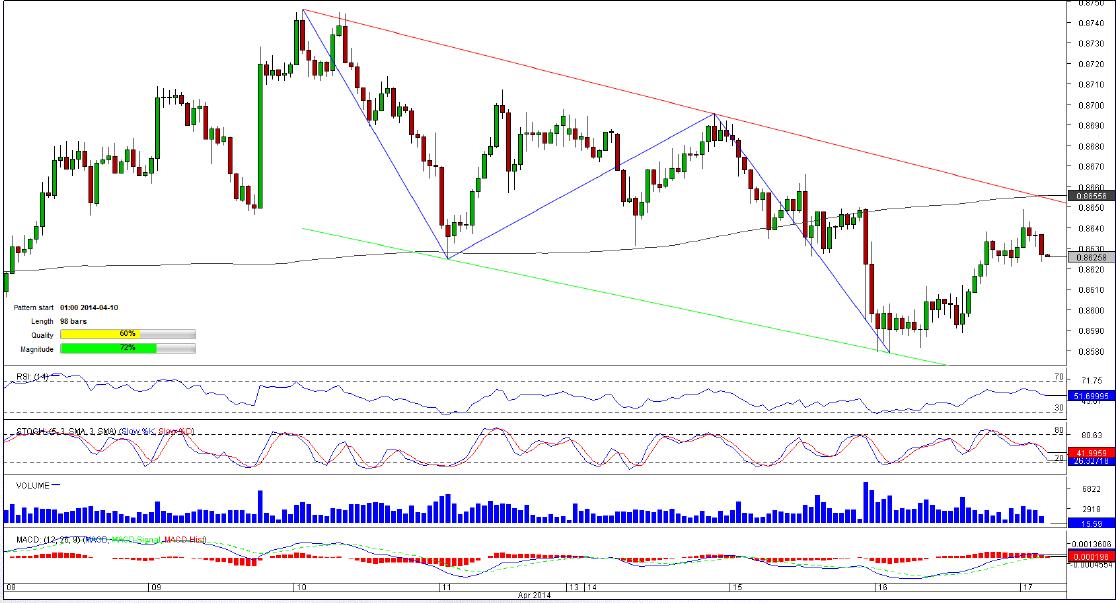
NZD/USD 1H Chart: Channel Down
Comment: NZD/USD was advancing during two months ended April 2 when it touched a three-year high of 0.8746. Since then, the instrument has been forming a broad channel down pattern that now is almost a hundred-bar long.
At the moment, the currency couple is sitting at the 50-hour SMA at 0.8624 but it is likely to bounce off this mark as over 60% of market players are bullish on the pair. To make this happen, the currency pair has to approach 0.8633/42 (four-hour PP, R1) that if overcome will send NZD/USD to the next bunch of resistances that beset the pattern’s upper boundary , lying at 0.8652/74 (daily R1, R2; 200-hour SMA and four-hour R2, R3).
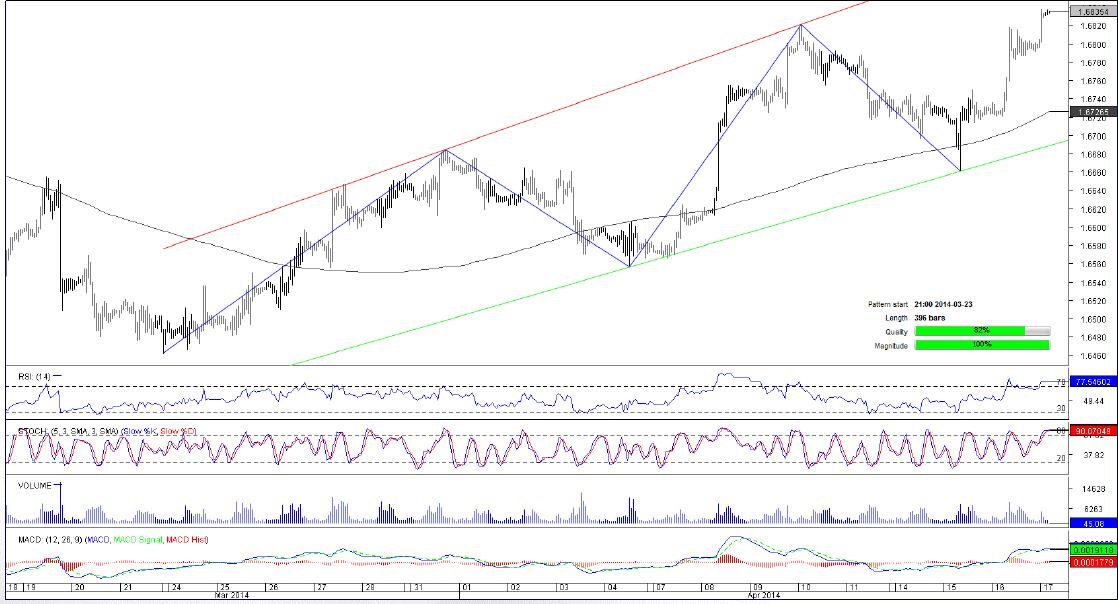
GBP/USD 1H Chart: Broadening Rising Wedge
Comment: Being a subject to a strong bullish pressure, GBP/USD managed to attain a five-year high of 1.6839, close to which it is meandering now. According to the SWFX data, market players believe the pair has not exhausted its potential yet and may continue ascending in the hours to come; around two thirds of traders bet on appreciation of the currency couple. If these expectations materialize, the GBP/USD may reach a cluster of resistance lines at 1.6840/60 (daily R1; four-hour R1, R2) and may even try to near 1.6878/82 (daily R2; four-hour R3) that represent the last defence from a surge to the wedge’s upper limit.
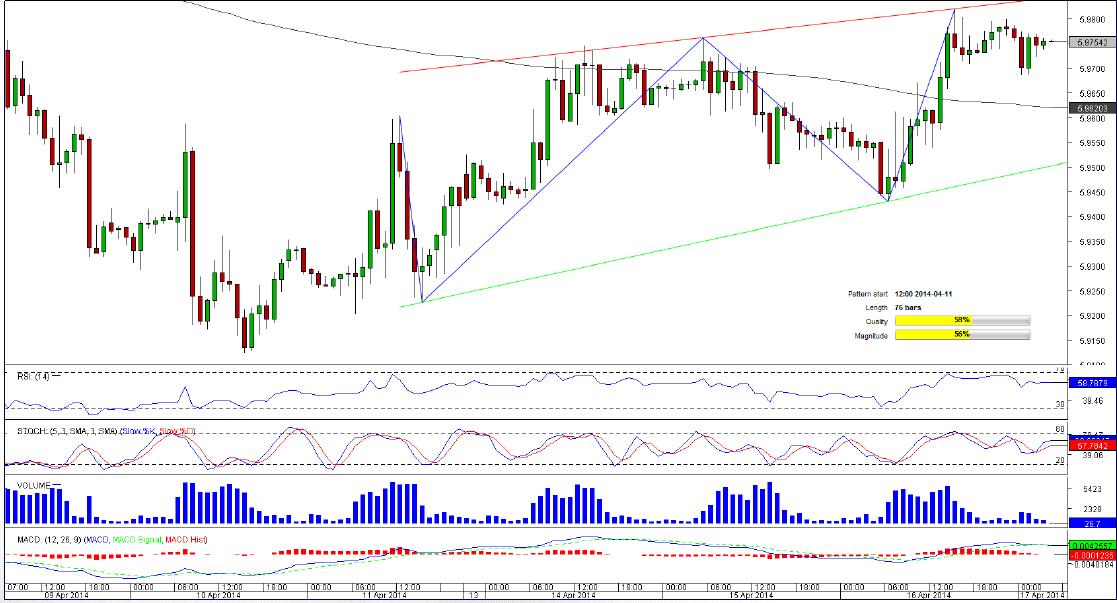
USD/NOK 1H Chart: Rising Wedge
Comment: After a long-term depreciation that lasted for almost two months started early February, the U.S. Dollar gained some ground versus the Norwegian Krone. A drop to a one-month low of 5.9127 in the second week of April marked the commencement of the bullish formation-rising wedge.
Currently, USD/NOK is trading within the pattern’s limits and demonstrates no intention to exit this area. In the foreseeable future, the currency couple is likely to move closer to the short-and long-term SMAs as market sentiment is strongly bearish. The SWFX data shows almost 80% of traders bet on depreciation of the instrument.
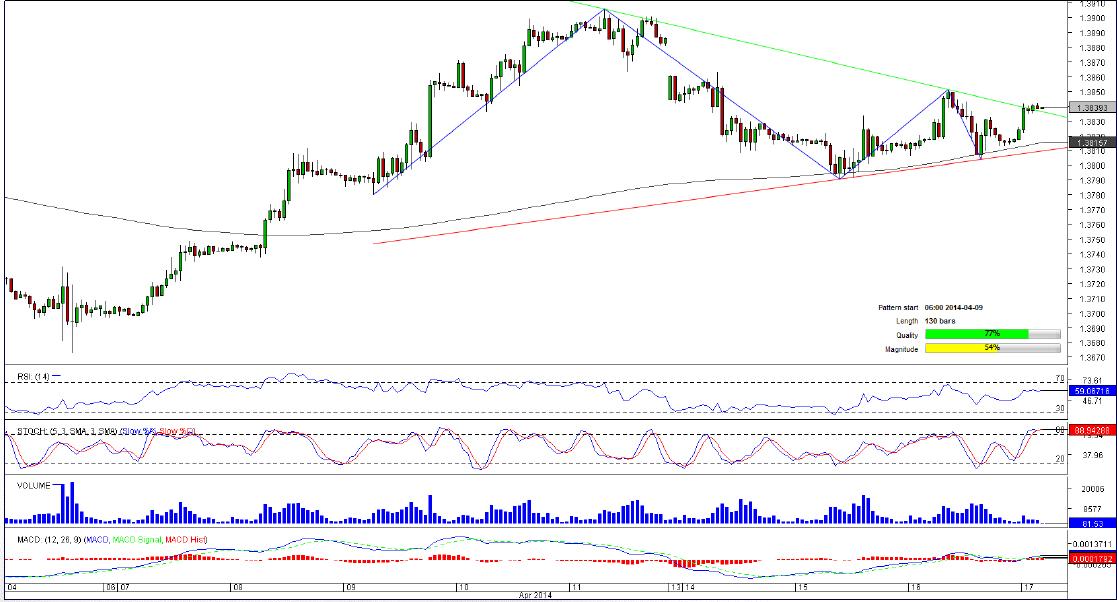
EUR/USD 1H Chart: Triangle
Comment: The most traded currency couple has been forming a triangle pattern since April 9, the time when EUR/USD was on the rise after a plunge to a two-month low of 1.3673 in the very beginning of April.
At the moment, the currency couple is on the brink of a bullish breakout as it has already surpassed the upper boundary of the triangle. If the pair manages to consolidate above this formidable resistance, we may expect an accelerating advancement before long. This is further supported by the SWFX numbers, indicating that almost 60% of all orders are placed to buy the pair.
This overview can be used only for informational purposes. Dukascopy SA is not responsible for any losses arising from any investment based on any recommendation, forecast or other information herein contained.
Recommended Content
Editors’ Picks
AUD/USD tumbles toward 0.6350 as Middle East war fears mount

AUD/USD has come under intense selling pressure and slides toward 0.6350, as risk-aversion intensifies following the news that Israel retaliated with missile strikes on a site in Iran. Fears of the Israel-Iran strife translating into a wider regional conflict are weighing on the higher-yielding Aussie Dollar.
USD/JPY breaches 154.00 as sell-off intensifies on Israel-Iran escalation

USD/JPY is trading below 154.00 after falling hard on confirmation of reports of an Israeli missile strike on Iran, implying that an open conflict is underway and could only spread into a wider Middle East war. Safe-haven Japanese Yen jumped, helped by BoJ Governor Ueda's comments.
Gold price pares gains below $2,400, geopolitical risks lend support

Gold price is paring gains to trade back below $2,400 early Friday, Iran's downplaying of Israel's attack has paused the Gold price rally but the upside remains supported amid mounting fears over a potential wider Middle East regional conflict.
WTI surges to $85.00 amid Israel-Iran tensions

Western Texas Intermediate, the US crude oil benchmark, is trading around $85.00 on Friday. The black gold gains traction on the day amid the escalating tension between Israel and Iran after a US official confirmed that Israeli missiles had hit a site in Iran.
Dogwifhat price pumps 5% ahead of possible Coinbase effect

Dogwifhat price recorded an uptick on Thursday, going as far as to outperform its peers in the meme coins space. Second only to Bonk Inu, WIF token’s show of strength was not just influenced by Bitcoin price reclaiming above $63,000.


