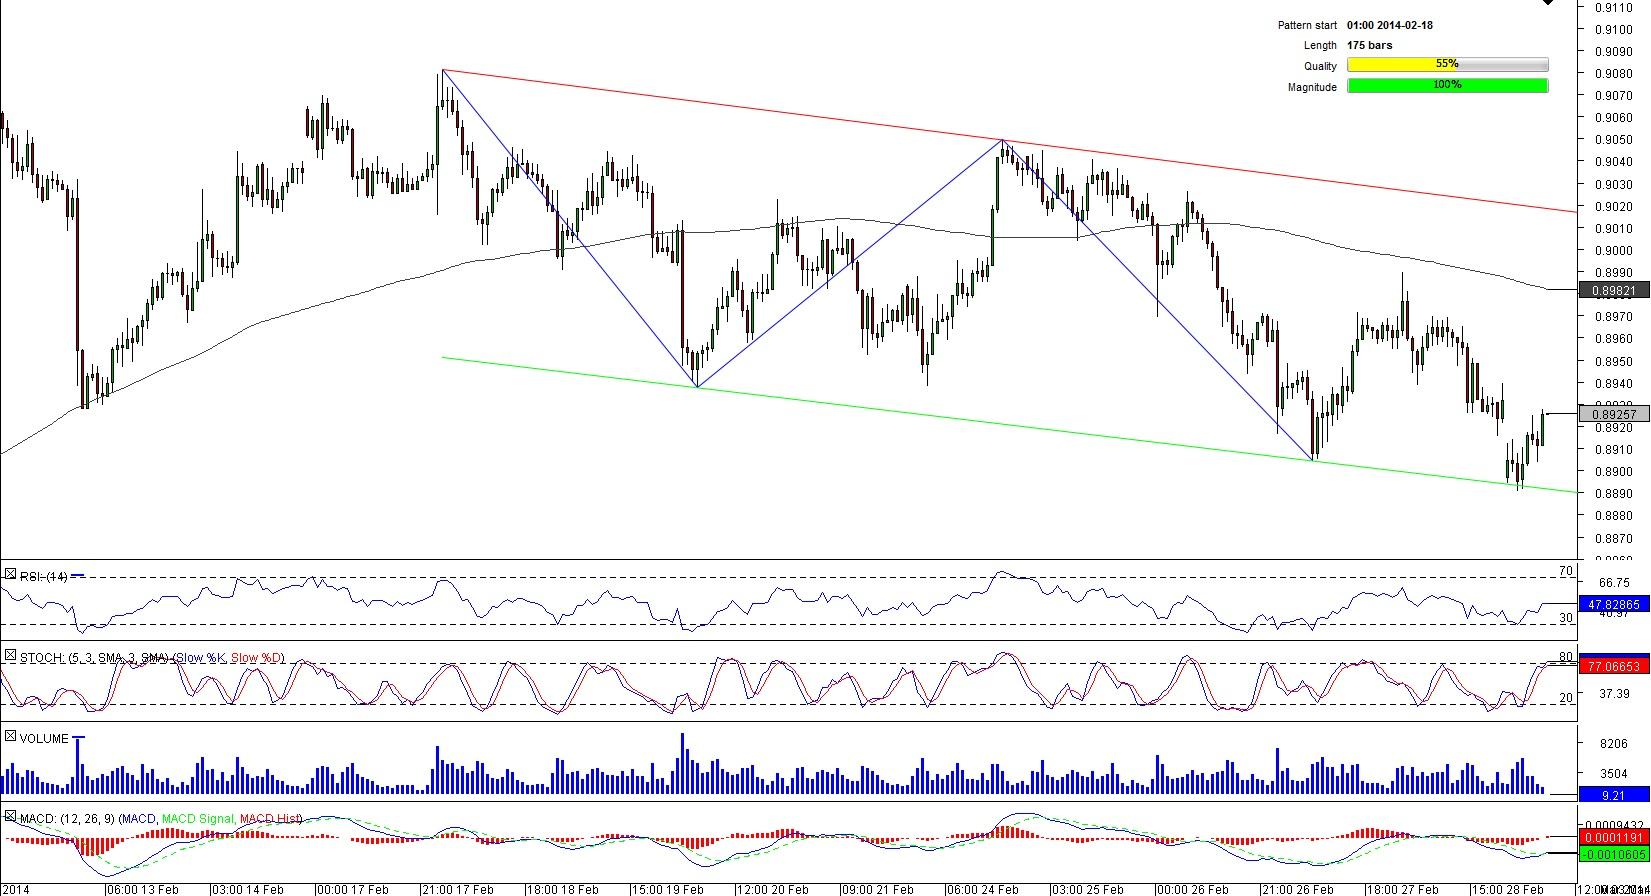
AUD/USD 1H Chart: Channel Down
Comment: AUD/USD did not manage to recover all losses after it slid to a four-year low of 0.8659 in the second part of January. Having touched this low, the pair followed an upside trend; however, the rally was short-lived and already on February 18 the currency couple entered a bearish channel, within which it has been locked for the last 175 hours.
At the moment the pair is in the uptrend that followed the third stab to the channel lower trend-line. At the same time, the pair’s future direction seems unclear, with proportion of long to short positions being 1:1. Technical indicators also are neutral for short and long terms but are bearish for medium term.
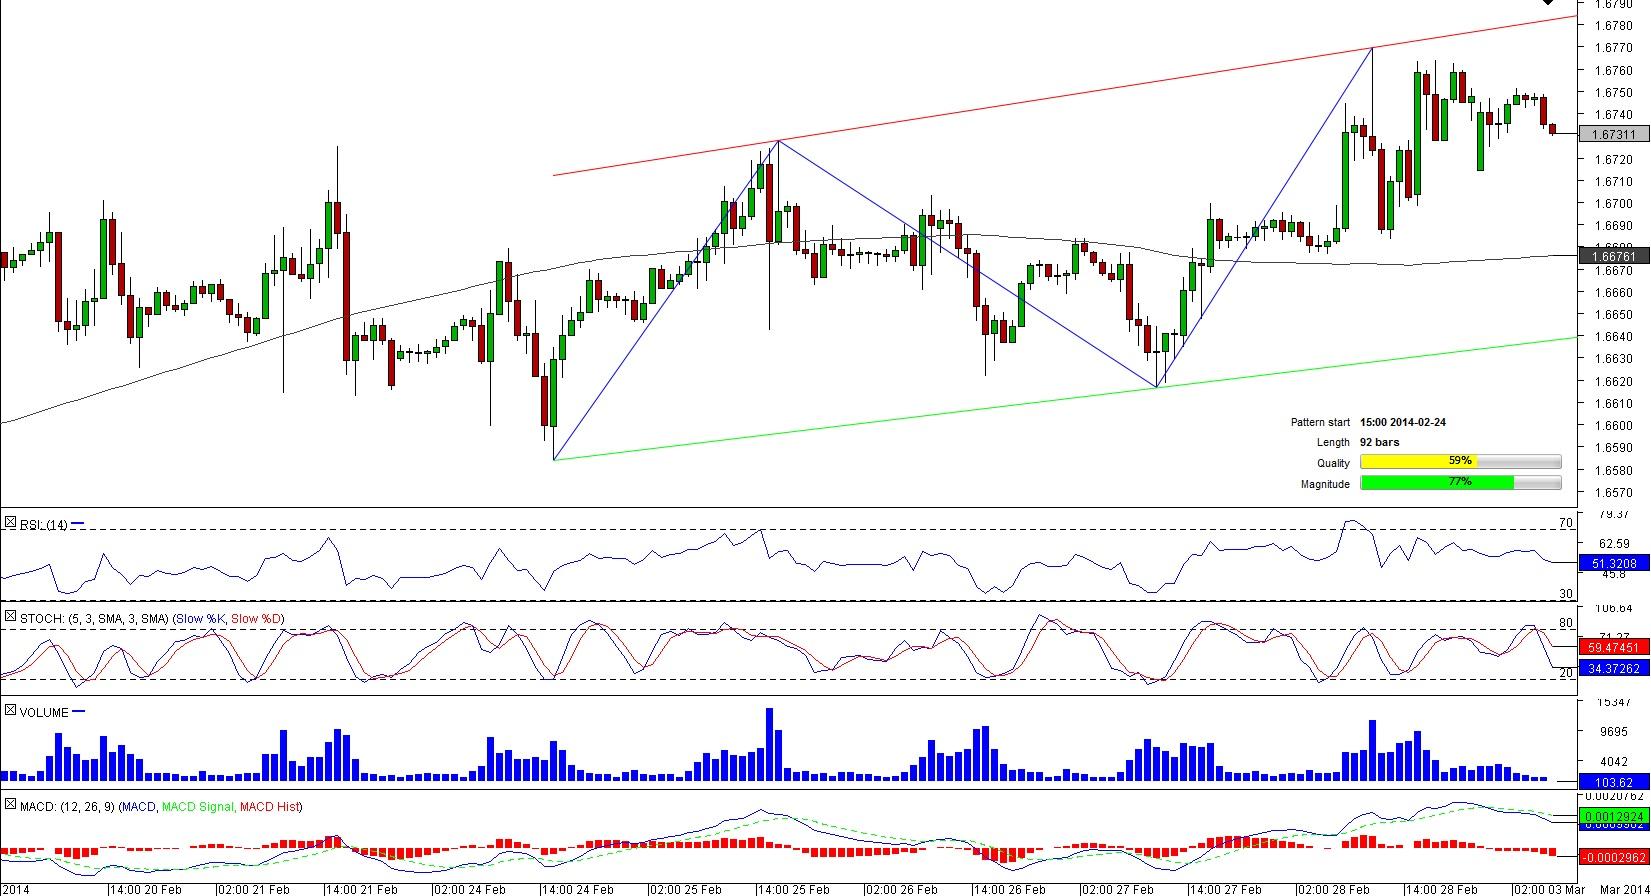
GBP/USD 1H Chart: Channel Up
Comment: After a short retreat from a five-year high of 1.6823 hit in mid-February, GBP/USD started to advance again, forming a 92-bar long bullish tunnel.
While trading within the channel, the pair has almost erased all earlier losses and now is heading towards the recent high. However, market players are not univocal, with a half of them being bullish and a half-bearish. Technical data is less bewildering, sending bullish signals for medium and log terms. To confirm the this, the currency couple has to bounce off the level of 1.6732 (daily PP, four-hour S1) and move to 1.6749 (daily R1) that is capable of stopping the advance for some time.
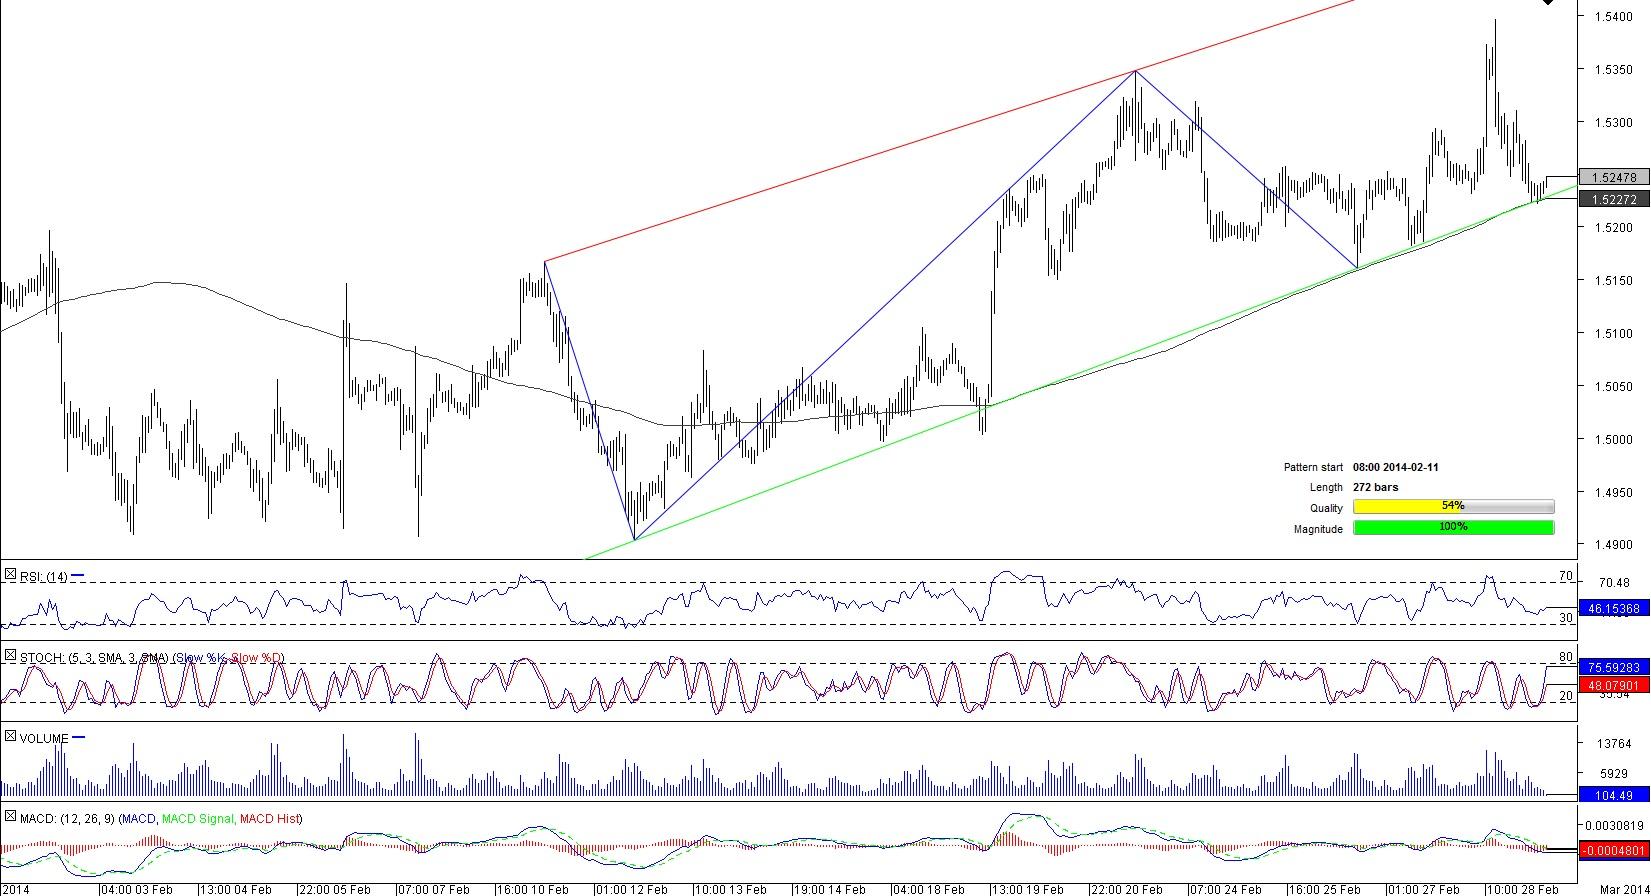
EUR/CAD 1H Chart: Channel Up
Comment: Since early November the single currency has been indefatigably rising against the Canadian Dollar. The latest part of the rally has been taking place within the area bounded by two parallel upward sloping lines that pushed the pair towards a four-year high of 1.5398 in last trading session of February.
Now the pair is trading near the lower trend-line that is considerably lower than the recent peak. However, the breakout is unlikely given a strong support pertaining to the 200-hour SMA that is meandering at the lower boundary of the channel. Technical data props up this, sending ‘buy’ signals in medium and long terms.
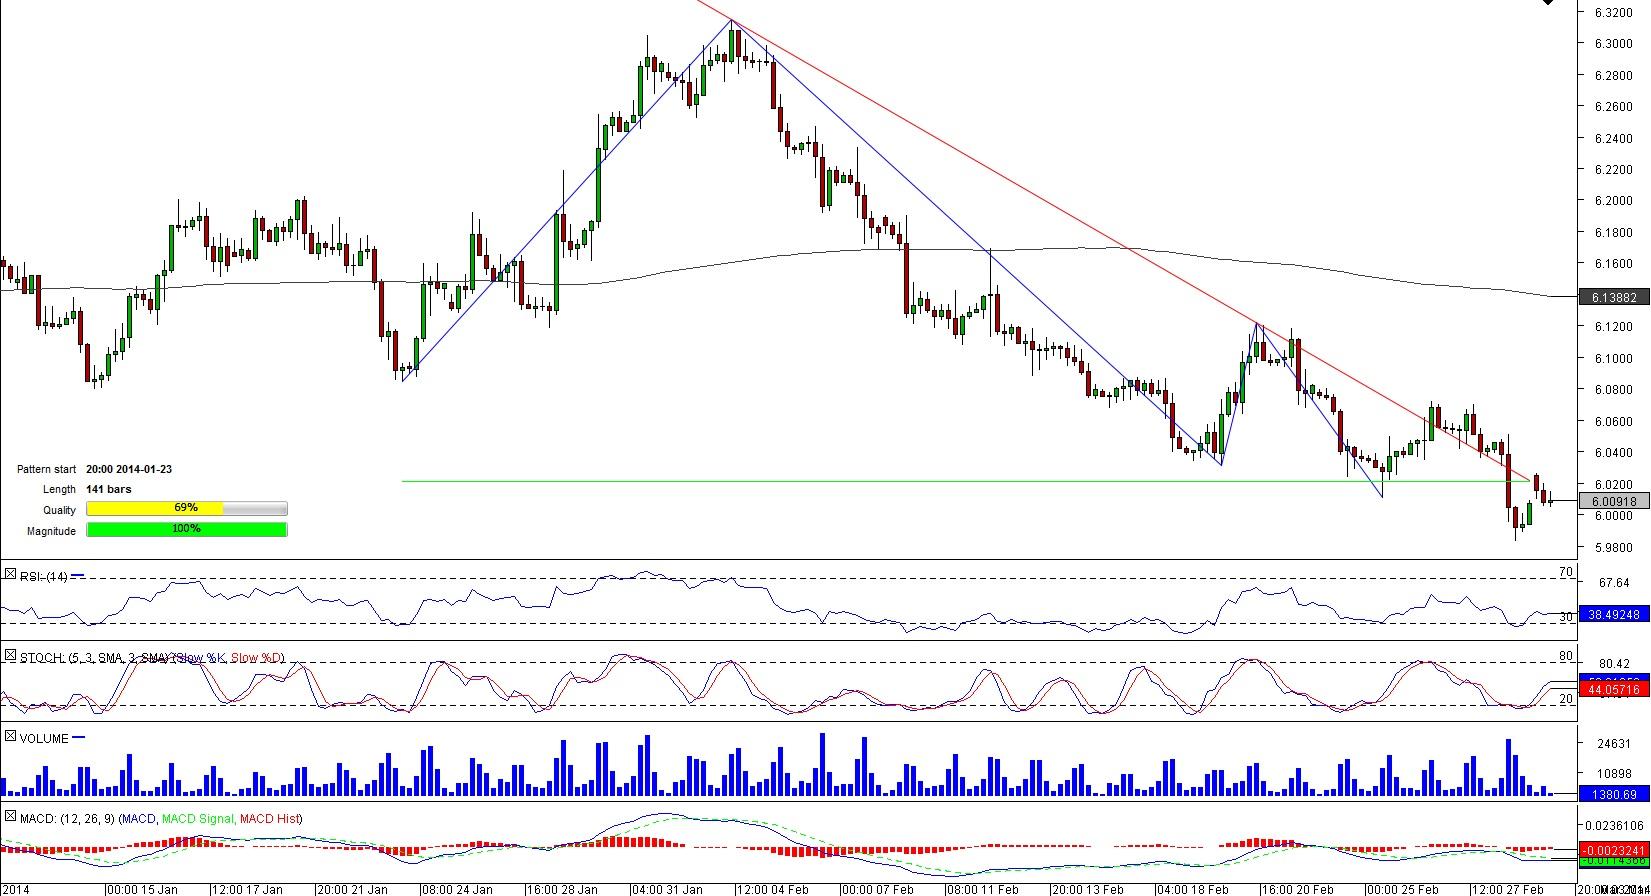
USD/NOK 4H Chart: Descending Triangle
Comment: The descending triangle pattern shaped by USD/NOK started on January 23, several days before the pair hit a four-year of 6.3134. Being a bearish formation, the channel was constantly pushing the pair lower to its support line at 6.0210 that was broken on February 28 when the pair approached the apex.
Currently the pair is vacillating below the triangle support, albeit slightly, meaning that now it represents a lucrative opportunity for traders as a sharp depreciation is likely to take place before long. This is also bolstered by SWFX data, indicating that 64.52% of all orders are to sell the pair.
This overview can be used only for informational purposes. Dukascopy SA is not responsible for any losses arising from any investment based on any recommendation, forecast or other information herein contained.
Recommended Content
Editors’ Picks
How will US Dollar react to Q1 GDP data? – LIVE

The US' GDP is forecast to grow at an annual rate of 2.5% in the first quarter of the year. The US Dollar struggles to find demand as investors stay on the sidelines, while waiting to assess the impact of the US economic performance on the Fed rate outlook.
EUR/USD holds gains above 1.0700, as key US data loom

EUR/USD holds gains above 1.0700 in the European session on Thursday. Renewed US Dollar weakness offsets the risk-off market environment, supporting the pair ahead of the key US GDP and PCE inflation data.
GBP/USD extends recovery above 1.2500, awaits US GDP data

GBP/USD is catching a fresh bid wave, rising above 1.2500 in European trading on Thursday. The US Dollar resumes its corrective downside, as traders resort to repositioning ahead of the high-impact US advance GDP data for the first quarter.
Gold price edges higher amid weaker USD and softer risk tone, focus remains on US GDP

Gold price (XAU/USD) attracts some dip-buying in the vicinity of the $2,300 mark on Thursday and for now, seems to have snapped a three-day losing streak, though the upside potential seems limited.
XRP extends its decline, crypto experts comment on Ripple stablecoin and benefits for XRP Ledger

Ripple extends decline to $0.52 on Thursday, wipes out weekly gains. Crypto expert asks Ripple CTO how the stablecoin will benefit the XRP Ledger and native token XRP.


