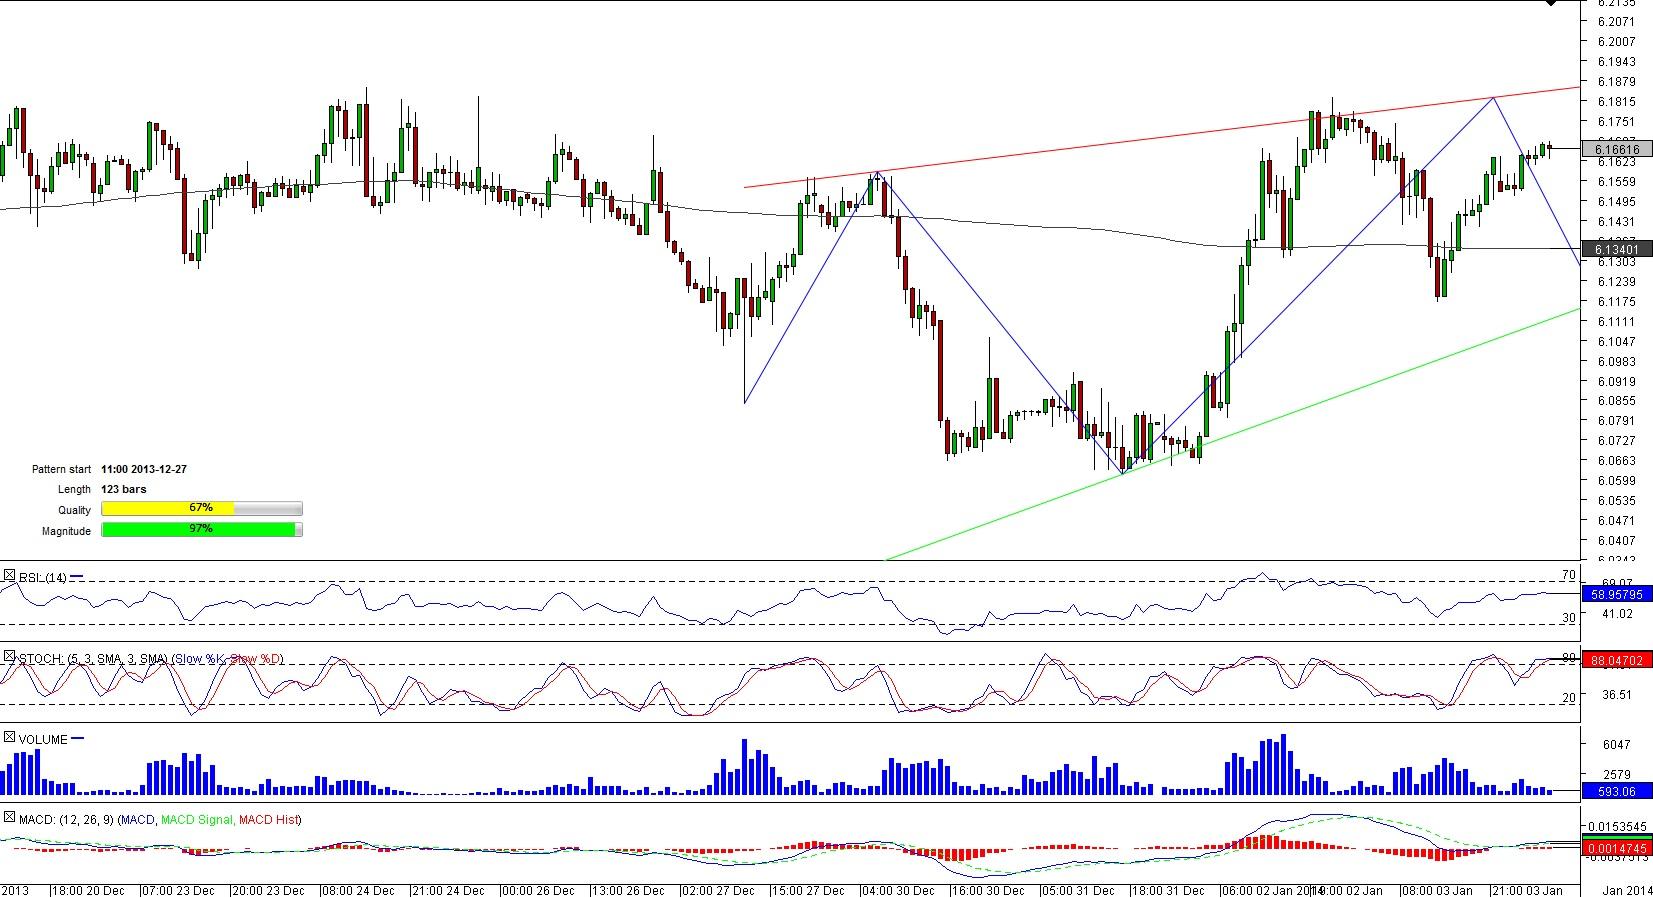
USD/NOK 1H Chart: Rising Wedge
Comment: Since mid-November USD/NOK has been trading sideways; however, it managed to perform several relatively wide swings in the last trading sessions of 2013 thus forming a rising wedge pattern.
Recently, the pair has bounced off its short-and long-term SMAs and now seesaws not far away from the pattern’s resistance but a further upside is unlikely as market participants are mostly bearish on the currency couple-about 52.63% of all positions are short. Technical indicators gainsay traders’ sentiment, sending bullish signals for short and medium terms.
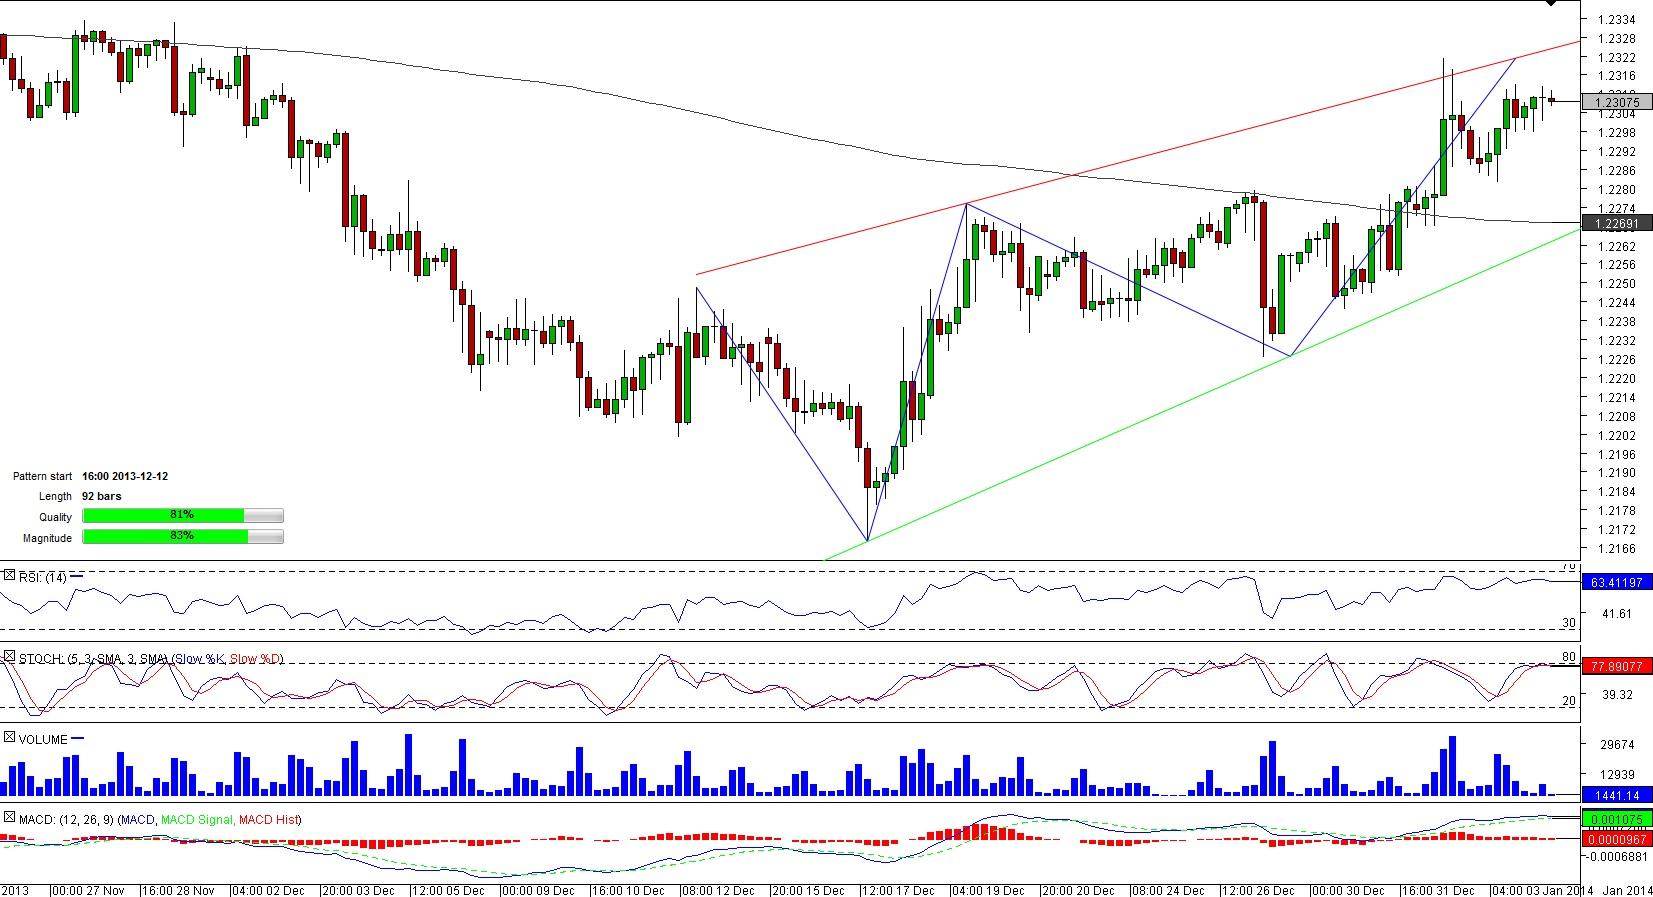
EUR/CHF 4H Chart: Rising Wedge
Comment: A sharp depreciation of the Euro against the Swiss Franc that lasted for three weeks ended December 18 helped the single currency to accumulate strength for a rebound versus its Swiss peer. The rebound was performed in the corridor of two upward sloping, gradually converging lines, in the other words, within the boundaries of the rising wedge pattern. Up to now, we have not observed any distinct attempts to breach the pattern trend-lines and the pair seems to have to intention to change it.
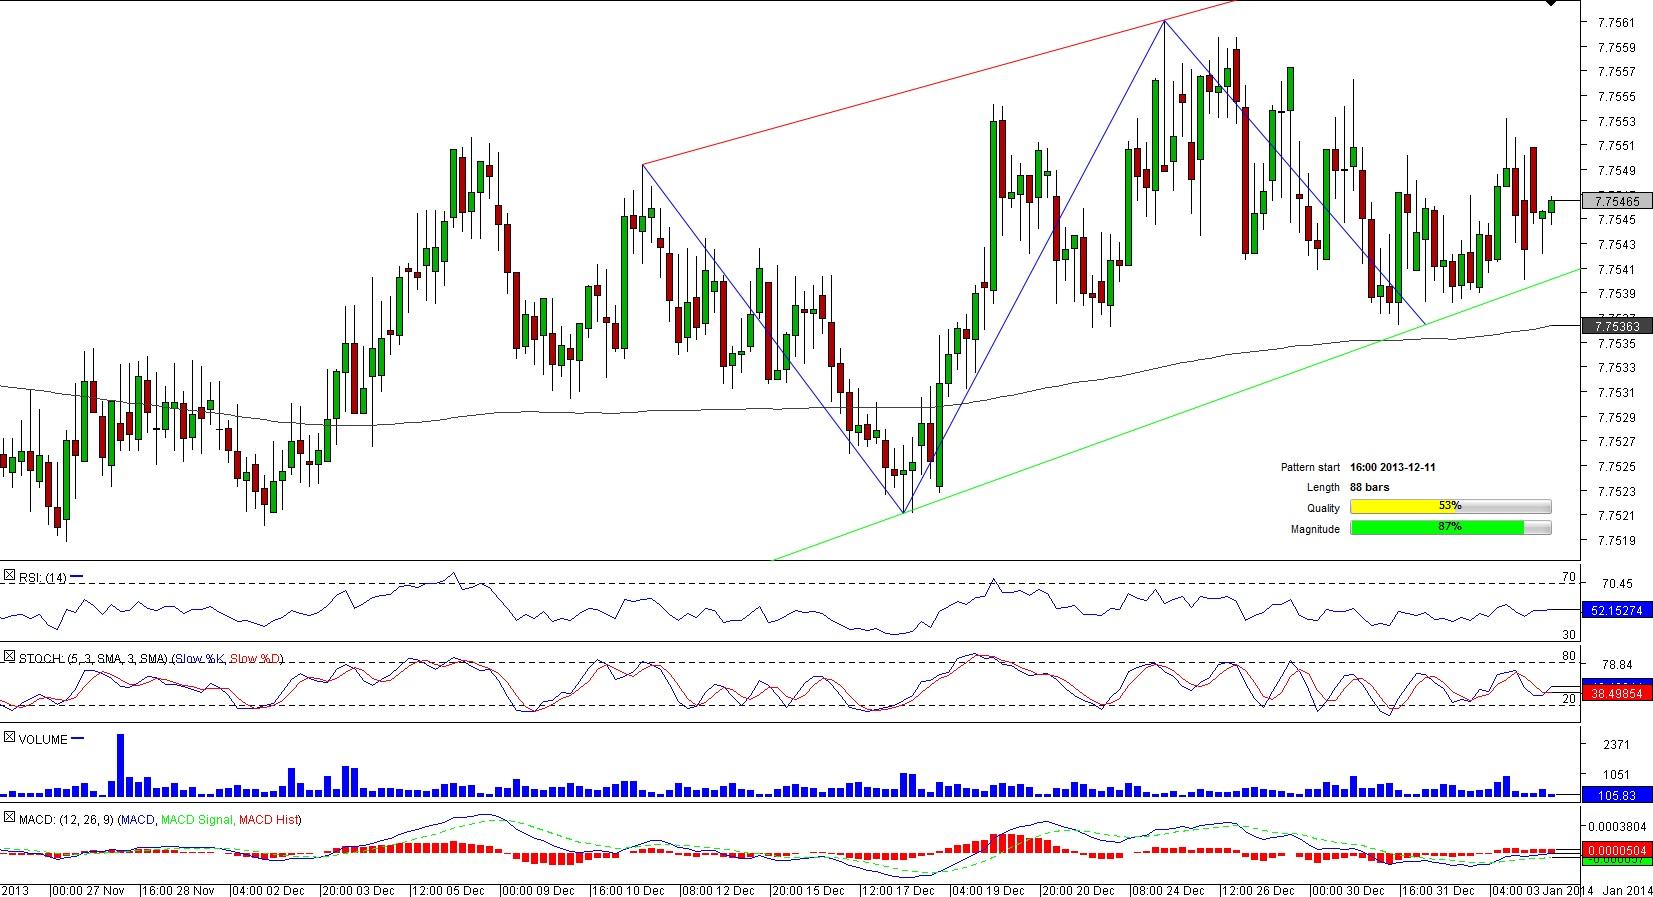
USD/HKD 4H Chart: Channel Up
Comment: After a long-lasting downside trend, the U.S. Dollar eventually altered its direction versus its Hong Kong peer, forming a 88-bar long channel up pattern.
Notwithstanding that since the very end of 2013 the currency pair has been trading close to the pattern’s support line, USD/HKD is not likely to break out of the pattern given a strong support level represented by its 200-bar SMA that meanders near the pattern’s lower boundary. At the same time, the upside also may be constrained by the 50-bar SMA that has been preventing a climb for several days already.
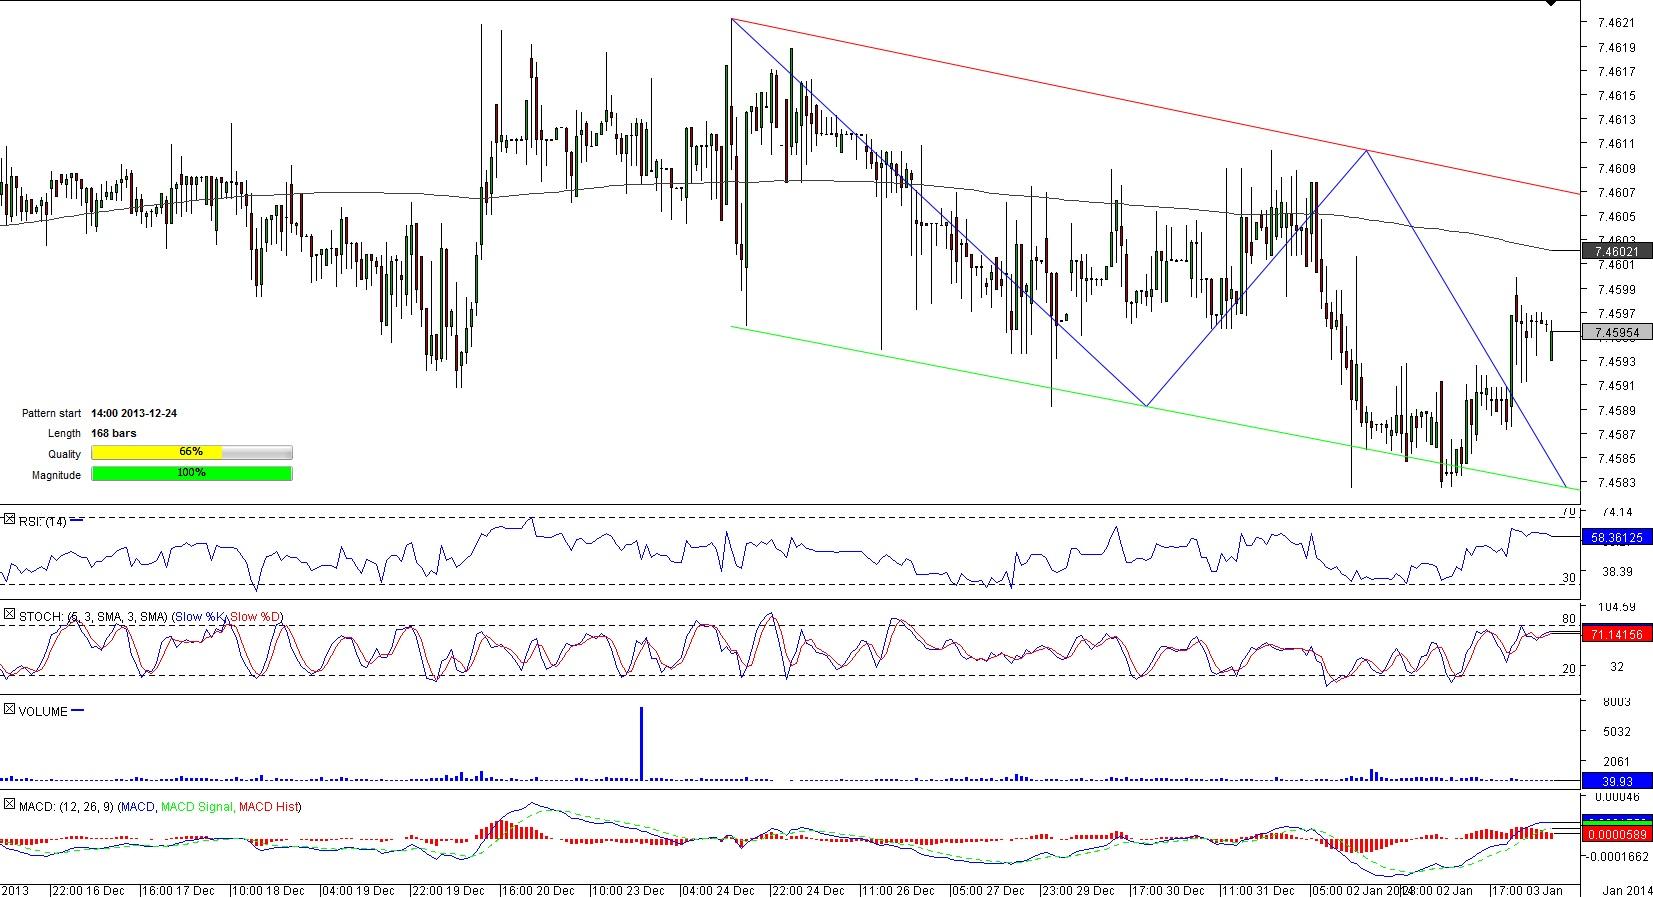
EUR/DKK 1H Chart: Channel Down
Comment: A plunge of the single currency versus the Danish Krone started on December 24 when the pair re-approached a multiple-month high of 7.4621. Throughout its retreat EUR/DKK tried to penetrate the lower limit of the channel down pattern, within which it performed a decline, for three times but all attempts proved to be unsuccessful. At the moment of writing, the pair was trapped by its 50-and 200-hour SMAs, with the 200-hour SMA acting as a formidable resistance and the 50-hour SMA representing a hindrance for any bearish moves.
This overview can be used only for informational purposes. Dukascopy SA is not responsible for any losses arising from any investment based on any recommendation, forecast or other information herein contained.
Recommended Content
Editors’ Picks
EUR/USD retreats below 1.0700 after US GDP data

EUR/USD came under modest bearish pressure and retreated below 1.0700. Although the US data showed that the economy grew at a softer pace than expected in Q1, strong inflation-related details provided a boost to the USD.
GBP/USD declines below 1.2500 as USD rebounds

GBP/USD declined below 1.2500 and erased the majority of its daily gains with the immediate reaction to the US GDP report. The US economy expanded at a softer pace than expected in Q1 but the price deflator jumped to 3.4% from 1.8%.
Gold drops below $2,320 as US yields shoot higher

Gold lost its traction and turned negative on the day below $2,320 in the American session on Thursday. The benchmark 10-year US Treasury bond yield is up more than 1% on the day above 4.7% after US GDP report, weighing on XAU/USD.
XRP extends its decline, crypto experts comment on Ripple stablecoin and benefits for XRP Ledger

Ripple extends decline to $0.52 on Thursday, wipes out weekly gains. Crypto expert asks Ripple CTO how the stablecoin will benefit the XRP Ledger and native token XRP.
After the US close, it’s the Tokyo CPI

After the US close, it’s the Tokyo CPI, a reliable indicator of the national number and then the BoJ policy announcement. Tokyo CPI ex food and energy in Japan was a rise to 2.90% in March from 2.50%.


