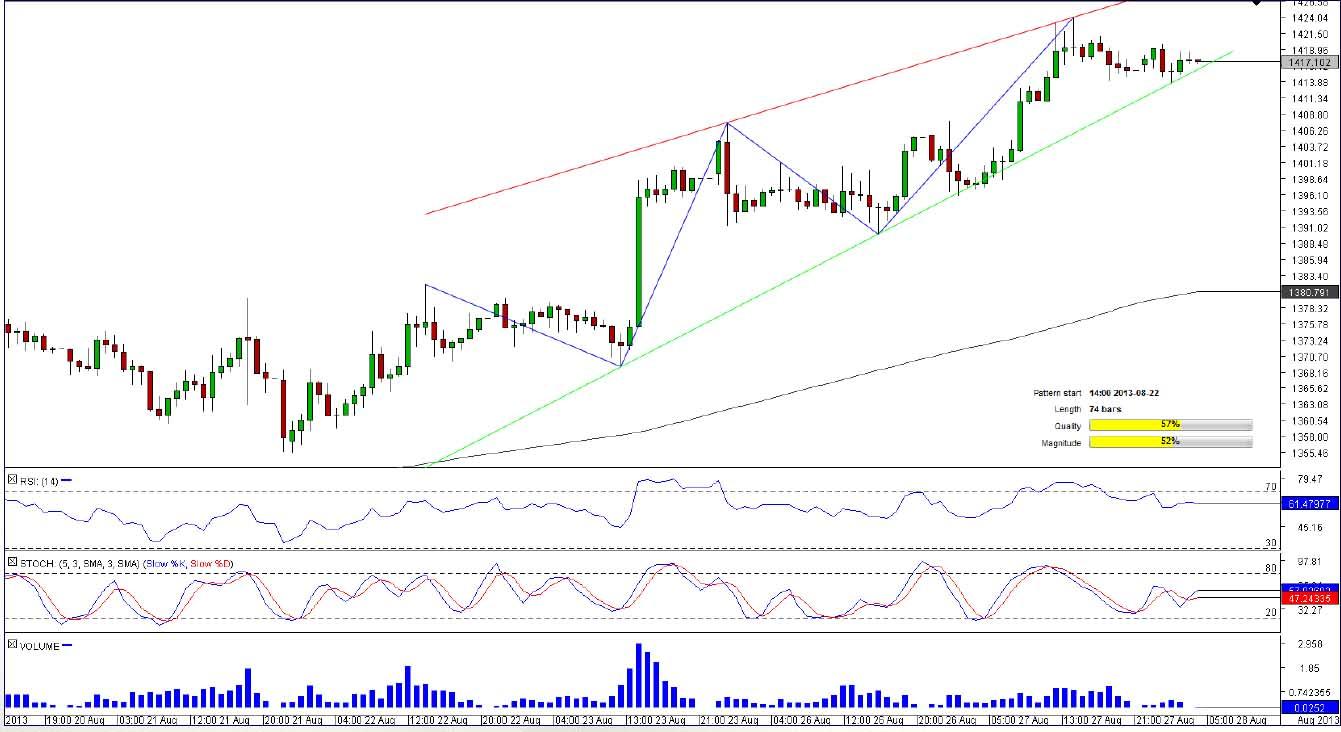
XAU/USD 1H Chart: Rising Wedge
Comment: Gold was trading above its 200-hour SMA after surpassing this level on August 8. Last Thursday, XAU/USD started to form a rising wedge pattern and now is moving closer to the convergence of the pattern’s trend-lines, implying that a bearish reversal is possible.
At the moment, the precious metal is struggling at the four-hour pivot point at 1416.94 that, if broken, may trigger a downswing towards the cluster of four-hour support levels at 11414.12/08.05 and, if the decline continues, XAU/USD may see itself falling to 1401.98 (daily S1) that may alleviate downside pressure.
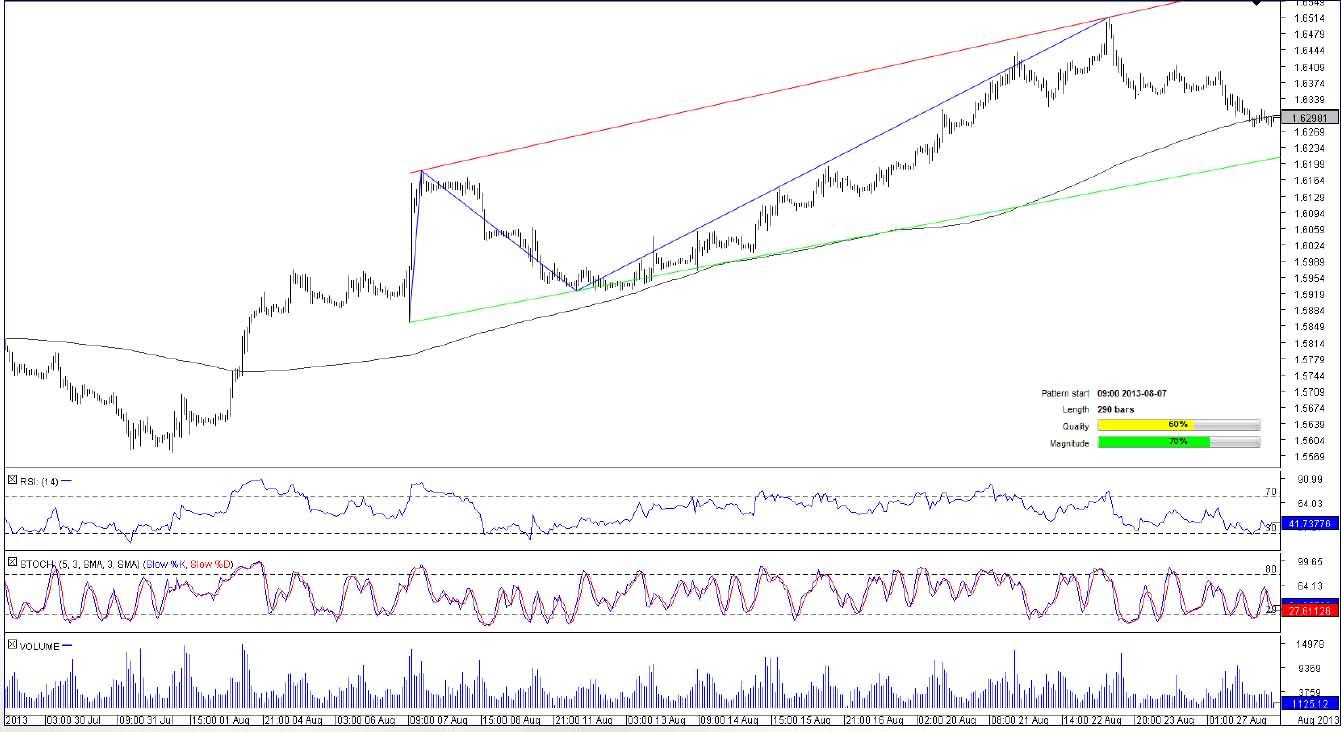
GBP/CAD 1H Chart: Channel Up
Comment: The 200-hour SMA represented a strong support level for GBP/CAD throughout three weeks ended August 21 when the pair failed to sustain its upward trend and dropped below its 200-hour SMA, the level close to which GBP/CAD was vacillating during the last nine hours. Currently, the currency couple is swinging slightly below 1.6301 (200-hour SMA) but a deeper sell-off is unlikely as market players are strongly bullish on the pair (72.29% of all traders hold long positions). To confirm the traders’ sentiment, the pair has to jump above its 200-hour SMA; this rise would suggest an on-going strength of GBP/CAD until it reaches the resistance zone at 1.6330/80 (daily PP and daily R1).
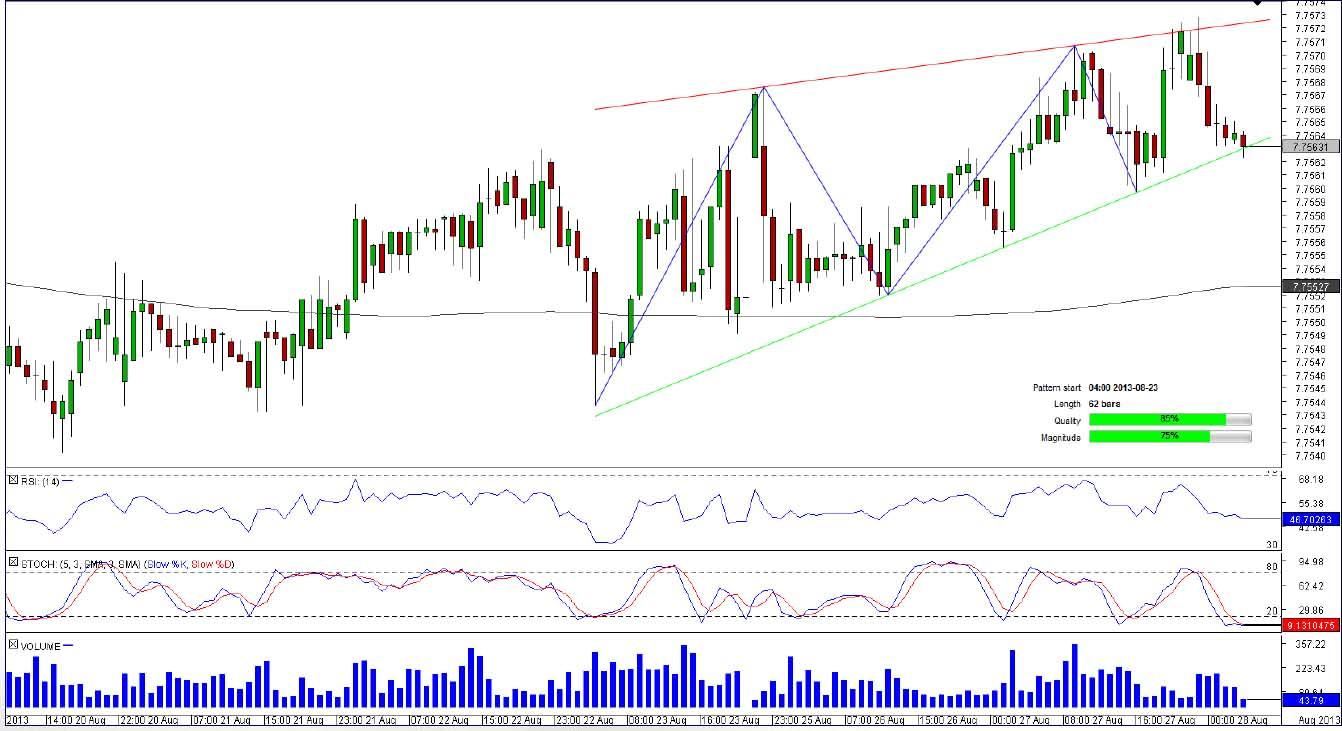
USD/HKD 1H Chart: Rising Wedge
Comment: Having received an impulse for a rally after crossing its 200-hour SMA, USD/HKD was following an upward trend until it topped a three-week high. The pair retreated from this mark to the pattern’s support, and now the level of 7.7563 (pattern’s support) prevents USD/HKD from a further decline towards the support zone sitting at 7.7558/7 (four-hour S2 and daily S1). At the same time, the pair is not expected to tumble, as traders buy the pair in 91.67% of cases. To meet the traders’ expectations, the pair should overcome its four-hour pivot at 7.7565 and cross the resistance at 7.7568 (daily R2) en its route towards the upper-limit of the pattern at 7.7572.
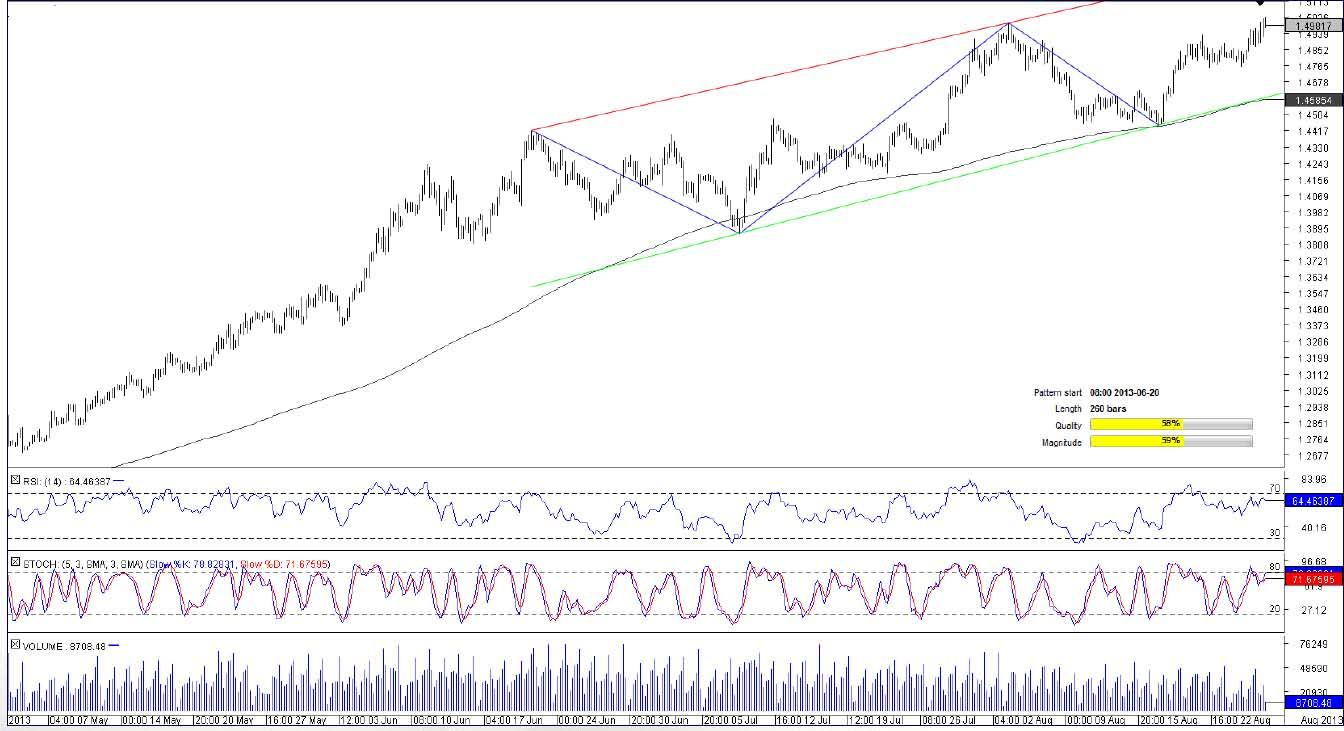
EUR/AUD 4H Chart: Channel Up
Comment: The pair managed to bounce off its 200-bar SMA twice between June 20 and August 28. Over this period, the pair neither dropped below the lower line of the pattern of 1.4711 nor surpassed the upper-boundary of 1.5414.
At the moment, EUR/AUD is faltering near the mark of 1.4940 (daily PP), and a decline beneath this level may create a notable selling pressure on the pair. At the same time, a jump above 1.5032 (daily R1) may provoke a sharp appreciation of EUR/AUD towards the next resistance zone 1.5091 (daily R2).
This overview can be used only for informational purposes. Dukascopy SA is not responsible for any losses arising from any investment based on any recommendation, forecast or other information herein contained.
Recommended Content
Editors’ Picks
EUR/USD retreats below 1.0700 after US GDP data

EUR/USD came under modest bearish pressure and retreated below 1.0700. Although the US data showed that the economy grew at a softer pace than expected in Q1, strong inflation-related details provided a boost to the USD.
GBP/USD declines below 1.2500 as USD rebounds

GBP/USD declined below 1.2500 and erased the majority of its daily gains with the immediate reaction to the US GDP report. The US economy expanded at a softer pace than expected in Q1 but the price deflator jumped to 3.4% from 1.8%.
Gold drops below $2,320 as US yields shoot higher

Gold lost its traction and turned negative on the day below $2,320 in the American session on Thursday. The benchmark 10-year US Treasury bond yield is up more than 1% on the day above 4.7% after US GDP report, weighing on XAU/USD.
XRP extends its decline, crypto experts comment on Ripple stablecoin and benefits for XRP Ledger

Ripple extends decline to $0.52 on Thursday, wipes out weekly gains. Crypto expert asks Ripple CTO how the stablecoin will benefit the XRP Ledger and native token XRP.
After the US close, it’s the Tokyo CPI

After the US close, it’s the Tokyo CPI, a reliable indicator of the national number and then the BoJ policy announcement. Tokyo CPI ex food and energy in Japan was a rise to 2.90% in March from 2.50%.


