USD/TRY 1H Chart: Channel Up

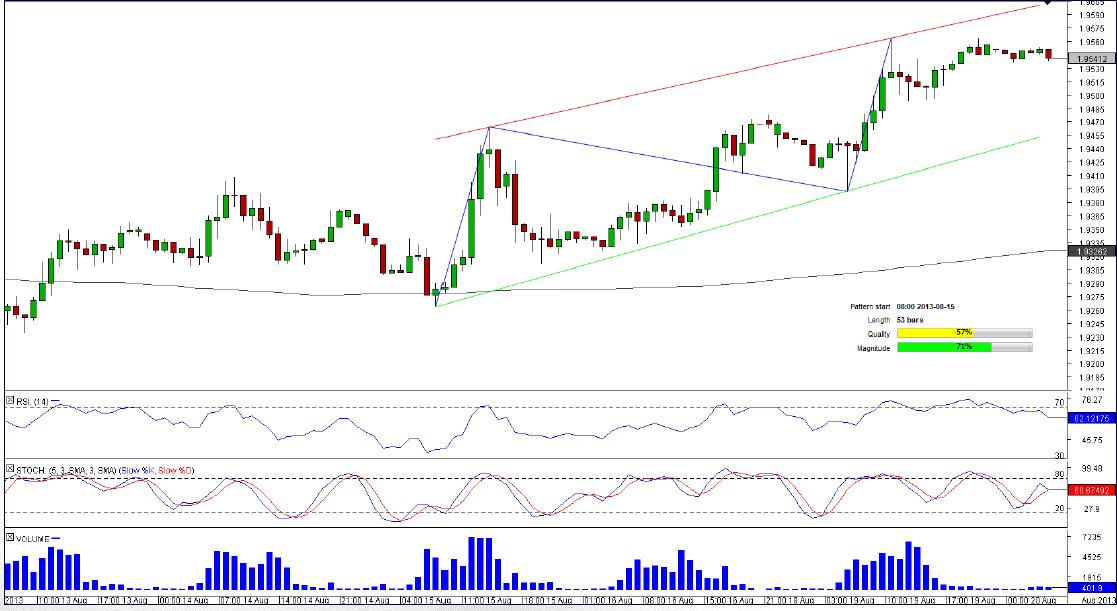
Comment: Even without the bullish pattern itself the near-term outlook on the currency pair is positive, being that hourly and four-hour technical indicators are largely giving ‘buy’ signals, the daily ones are mixed at the moment. Moreover, USD/TRY has recently overcome and then confirmed the 200-hour SMA as the support, adding to the pair’s upward potential.
A recovery from the moving average, however, is contained by two parallel trend-lines, the upper one of which may be currently found at 1.9612, while the bullish support line that is supposed to guide the price towards new highs is located at 1.9441.
EUR/CHF 1H Chart: Channel Up

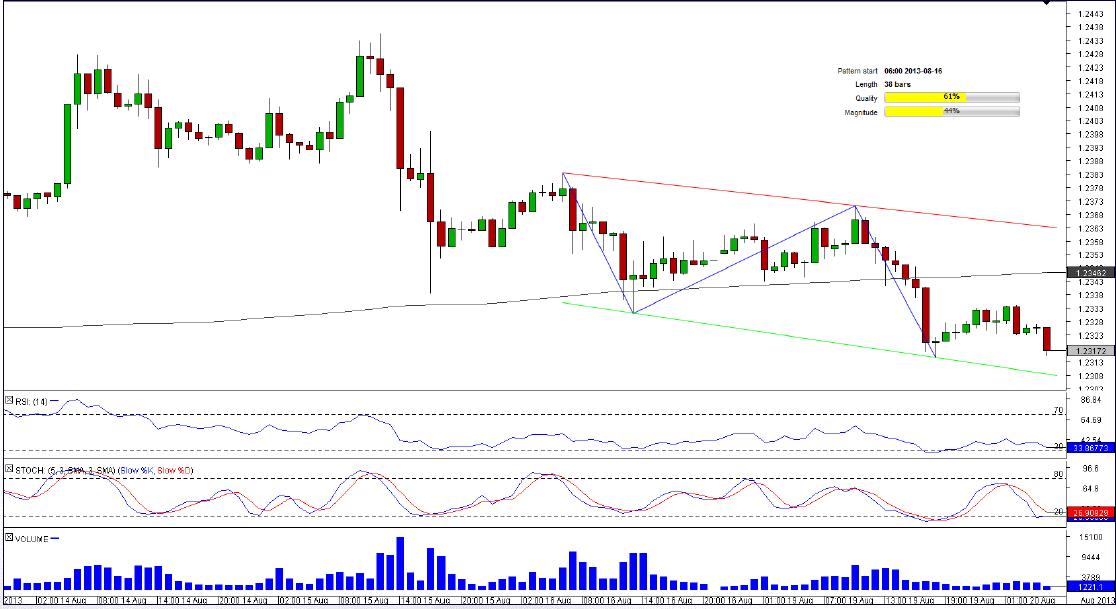
Comment: EUR/CHF has been on the decline since Aug 15, but the Euro started to depreciate in an orderly fashion 50 hours ago, on Aug 16, while attempting to breach the 200-hour SMA.
In the end this endeavour turned out to be successful and the pair continues trending downwards. The closest notable area it is likely to encounter is at 1.2304, where the daily S1, together with the down-trend support, stand ready to initiate short-squeezing. In the meantime, the bearish bias is preserved by the resistances at 1.2337 (200-hour SMA; daily pivot point) and at 1.2361 (daily R1; down-trend line).
USD/HKD 1H Chart: Channel Down

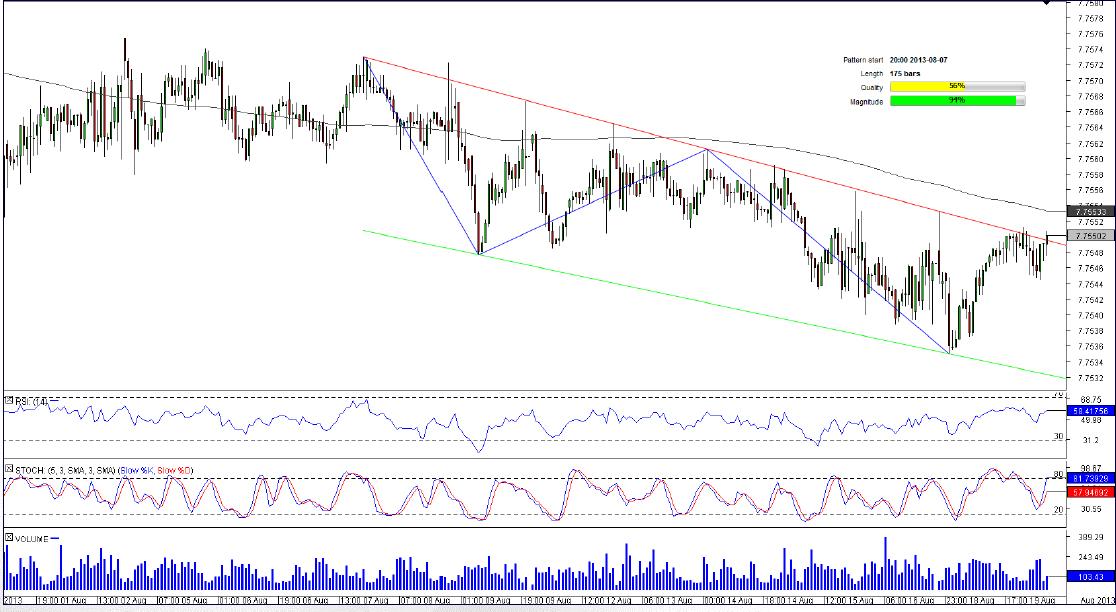
Comment: The last 180 hours USD/HKD has been trading below the 200-hour SMA and at the same time forming the bearish channel. Given considerable length of the pattern, its edges should be fairly reliable, but we would rather apply this characteristic only to the upper trend-line, since it has received significantly more confirmations than the lower one.
Right now the currency pair is found exactly near the upper trend-line, namely at 7.7550. Accordingly, we would expect the U.S. Dollar to stop appreciation and commence development of the leg down that in turn may extend down to 7.7532, but will meet 7.7545 and 7.7538 on the way there.
XAU/USD 1H Chart: Channel Up

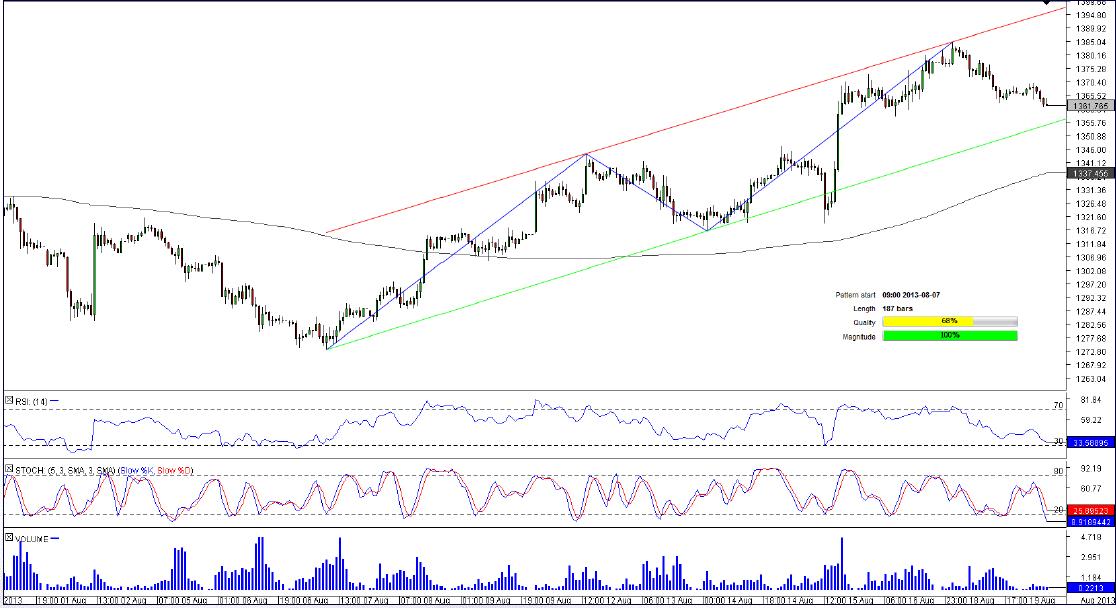
Comment: The channel up on an hourly chart of XAU/USD has been evolving throughout the last 215 hours, since Aug 7, when the price reached a bottom at 1,273.23. At some point of the pattern’s life, on Aug 15, the formation was at risk of being breached, but the break-out proved to be a false one and did not turn into a full-blown sell-off that would invalidate the channel.
A present position of XAU/USD predisposes for a strong rally. This is implied by the fact that the pair is standing right next to the up-trend support line that is reinforced by the daily S1. Additionally, there is the 200-hour SMA at 1,336.58 in case the bears do not stop pushing the price south soon enough.
This overview can be used only for informational purposes. Dukascopy SA is not responsible for any losses arising from any investment based on any recommendation, forecast or other information herein contained.
Recommended Content
Editors’ Picks
AUD/USD failed just ahead of the 200-day SMA

Finally, AUD/USD managed to break above the 0.6500 barrier on Wednesday, extending the weekly recovery, although its advance faltered just ahead of the 0.6530 region, where the key 200-day SMA sits.
EUR/USD met some decent resistance above 1.0700

EUR/USD remained unable to gather extra upside traction and surpass the 1.0700 hurdle in a convincing fashion on Wednesday, instead giving away part of the weekly gains against the backdrop of a decent bounce in the Dollar.
Gold stays firm amid higher US yields as traders await US GDP data

Gold recovers from recent losses, buoyed by market interest despite a stronger US Dollar and higher US Treasury yields. De-escalation of Middle East tensions contributed to increased market stability, denting the appetite for Gold buying.
Ethereum suffers slight pullback, Hong Kong spot ETH ETFs to begin trading on April 30

Ethereum suffered a brief decline on Wednesday afternoon despite increased accumulation from whales. This follows Ethereum restaking protocol Renzo restaked ETH crashing from its 1:1 peg with ETH and increased activities surrounding spot Ethereum ETFs.
Dow Jones Industrial Average hesitates on Wednesday as markets wait for key US data

The DJIA stumbled on Wednesday, falling from recent highs near 38,550.00 as investors ease off of Tuesday’s risk appetite. The index recovered as US data continues to vex financial markets that remain overwhelmingly focused on rate cuts from the US Fed.