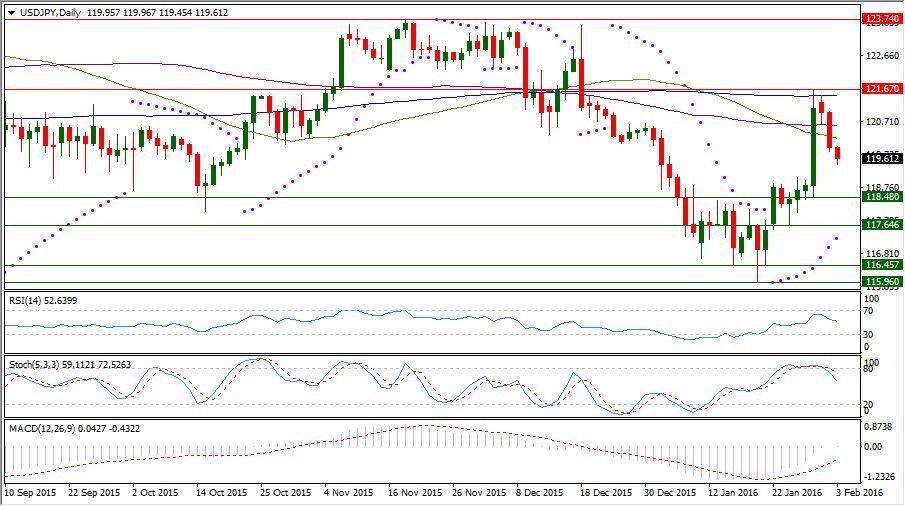
With the oil prices slide again, The US major stocks indexes came under increased downside pressure yesterday, after it had been tempered by The Fed's Vice President Stanley Fischer's comments that it is too difficult to gauge the impact on the U.S. economy from the recent turmoil in financial markets and the uncertainty over China. The risk aversion could bring USDJPY back below 120, after it had been boosted to reach 121.67 by BOJ's surprising decision to lower the interest rate to -0.1% to work with its monetary base expansion by 80 trillion yen annually for achieving the 2% price stability yearly target at the earliest possible time.
AUDUSD came down also further after today release of Dec Trade Balance which has shown 3.535b deficit versus 2.5b expected, after 2.727b deficit in November. AUD has been already under pressure following RBA's president Glenn's statement yesterday which kept the door opened for more easing steps to be taken, as the inflation is likely to remain low over the next year or two because of the oil and energy prices low prices, the lower than expected global expansion and the subdued wages pressure in Australia.
While GBPUSD is still trying to keep trading near 1.44, after the National Institute for Economic and Social Research said that it is expecting 0.3% annual inflation rate in UK down from 1.1% it has expected earlier last November.
NIESR sees no expected chance for raising the interest rate in UK, before the ‘Brexit’ Referendum but it said that the interest rate can go higher later to reach 1.5% by the end of next year with GDP expected expansion by 2.3% in 2016 and 2.7% in 2017.
Instrument in Focus: USDJPY
The risk-off sentiment could boost demand for the Japanese yen, as this low cost financing currency usually gains benefits during the dovish market sentiment. USDJPY which has peaked out at 121.67 has fallen again below its daily SMA200, daily SMA100 and daily SMA50.
USDJPY is now trading near 119.60 keeping existence above its daily Parabolic SAR (step 0.02, maximum 0.2) which is reading today 117.26 in its ninth day of continued being below the trading rate.
USDJPY daily RSI is referring now to existence in the neutral region reading now 52.639 and also its daily Stochastic Oscillator (5, 3, 3) which is more sensitive to the volatility is having its main line in the neutral area coming from the overbought area above 80 to read now 59.112 leading to the downside its signal line which is reading now 72.526.
Important levels: Daily SMA50 @ 120.21, Daily SMA100 @ 120.60 and Daily SMA200 @ 121.49
S&R:
S1: 118.48
S2: 117.64
S3: 116.45
R1: 121.67
R2: 123.74
R3: 124.61
USDJPY Daily Chart:
Commodities: Brent Apr. 16
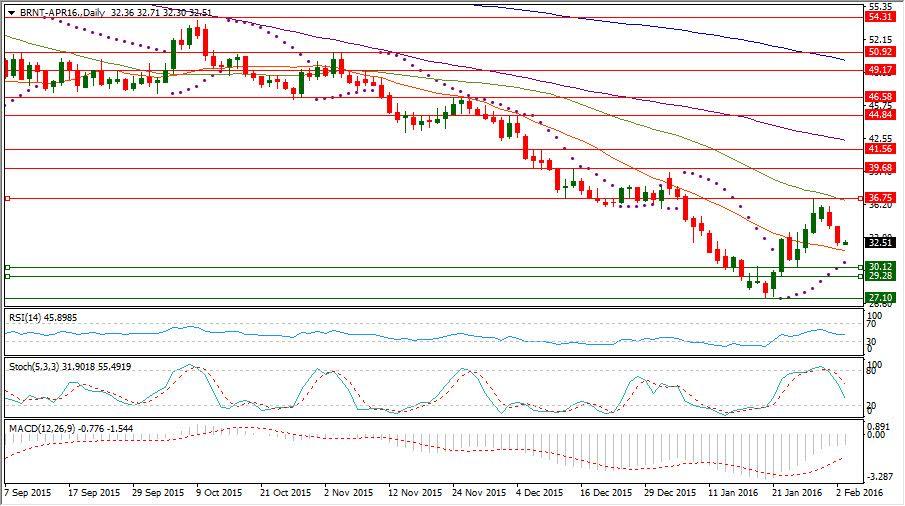
After last week rebound which has been extended to $36.75, Brent Apr. 16 came again under pressure this week to be traded now near $32.50.
Brent Apr. 16 which is still keeping existence until now above its daily SMA20 is still above its daily Parabolic SAR (step 0.02, maximum 0.2) is referring today to $30.56 in its ninth consecutive day of being below the trading rate.
Brent Apr. 16 daily RSI is now in the neutral region reading 45.898 and also its daily Stochastic Oscillator (5, 3, 3) which is more sensitive to the volatility is having now its main line in neutral area but close to the oversold area below 20 reading 31.901 and leading its signal line which is in a higher place in the neutral region reading now 55.491.
Brent Apr. 16 which has been unfazed of US EIA Oil stockpile growing in the week ending on Jan. 22 to 494,920m by gaining 8.383m barrels is waiting today for the crude inventory figure of the week ending on Jan.29 to be up by 4.733m, while surpassing 0.5b barrels may have bad psychological impact on the oil prices.
Important levels: Daily SMA20 @ $31.77, Daily SMA50 @ $36.57, Daily SMA100 @ $42.40 and Daily SMA200 @ $50.16
S&R:
S1: $30.12
S2: $29.28
S3: $27.10
R1: $36.75
R2: $39.68
R3: $41.56
Brent Apr. 16 Daily chart:
Hot instrument: GBPUSD
After dipping down to 1.4324 yesterday, The cable returned to be traded near 1.44 keeping its existence above its daily Parabolic SAR (step 0.02, maximum 0.2) which is reading today 1.4183 in its ninth day in a row of being below the trading rate. The cable daily RSI-14 is now in the neutral territory reading 46.561, while its daily Stochastic Oscillator (5, 3, 3) which is more sensitive to the volatility is having now its main line in overbought area above 80 reading 90.515, while its signal line is still keeping existence in the neutral region but close to the overbought area reading now 78.942.
The cable yesterday bottoming out at 1.4324 kept its existence above its hourly SMA200, its hourly SMA100 and its hourly SMA500 but it is still in a relatively deep place below its daily SMA50, its daily SMA100 and its daily SMA200 showing continued pressure on the it over the longer term.
Important levels: Daily SMA50 @ 1.4716, Daily SMA100 @ 1.5002 and Daily SMA200 @ 1.5260
S&R:
S1: 1.4324
S2: 1.4171
S3: 1.4078
R1: 1.4474
R2: 1.4643
R3: 1.4723
GBPUSD Daily chart:
Recommended Content
Editors’ Picks
EUR/USD regains traction, recovers above 1.0700

EUR/USD regained its traction and turned positive on the day above 1.0700 in the American session. The US Dollar struggles to preserve its strength after the data from the US showed that the economy grew at a softer pace than expected in Q1.
GBP/USD returns to 1.2500 area in volatile session

GBP/USD reversed its direction and recovered to 1.2500 after falling to the 1.2450 area earlier in the day. Although markets remain risk-averse, the US Dollar struggles to find demand following the disappointing GDP data.
Gold climbs above $2,340 following earlier drop

Gold fell below $2,320 in the early American session as US yields shot higher after the data showed a significant increase in the US GDP price deflator in Q1. With safe-haven flows dominating the markets, however, XAU/USD reversed its direction and rose above $2,340.
XRP extends its decline, crypto experts comment on Ripple stablecoin and benefits for XRP Ledger

Ripple extends decline to $0.52 on Thursday, wipes out weekly gains. Crypto expert asks Ripple CTO how the stablecoin will benefit the XRP Ledger and native token XRP.
After the US close, it’s the Tokyo CPI

After the US close, it’s the Tokyo CPI, a reliable indicator of the national number and then the BoJ policy announcement. Tokyo CPI ex food and energy in Japan was a rise to 2.90% in March from 2.50%.


