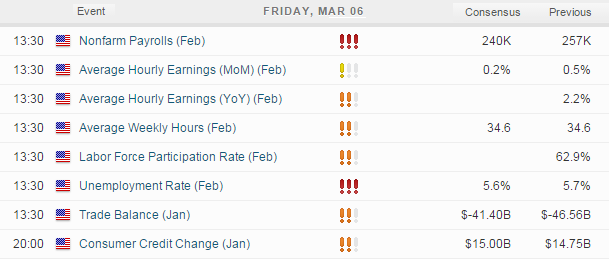
With ECB announcement of QE behind us the markets will now shift their attention to US Nonfarm Payroll data.
Whilst the markets frequently refer to Nonfarm Payroll, it is in fact a data set of several employment figures. The markets care because it is one of the key data sets used by the FED to aid monetary policy decision. With an expectation of FED to raise rates in June this year and using labour market conditions and growth to monitor the progress of this likelihood, then employment data is as important as ever as traders speculate on the likelihood of the FED raising rates.
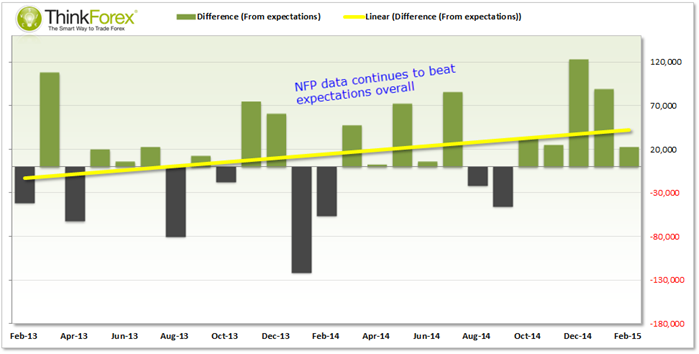
The chart above compares actual NFP to expectations, with a positive reading denoting above expatiations and a negative number denoting below expectations. Using two years of data we can see overall the trend is rising, meaning NFP is surpassing expectations and we are a gloomy bunch when it comes to forecasting. Whilst this trend overall is expected to continue we also have to keep in mind that a negative numbers (below expectations) is likely to cause more of a stir with the markets becoming accustomed to above-expectation job growth.
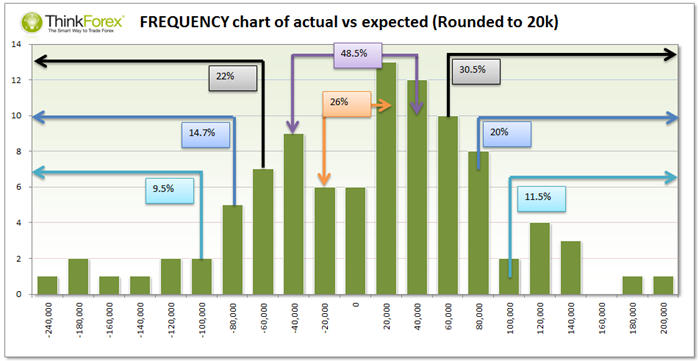
Using the last 95 data points, I have compared NFP expectations to the actual, rounded off to the nearest 20k (above or below expectation).
So using the above data we could assume that:
- 48.5% probability of NFP coming either above or below expectations by 40k
- 30.5% probability of 60k above expectation
- 20% probability of 80k above expectations
- 9.5% probability of being -100k from expectations
Observations/Assumptions:
- Above expectations gets extra weighting (which shows we have had gloomy expectations, overall)
- A higher deviation from expectations is less frequent, which should assume in a larger move
- Deviation below 40k above or below is not likely to cause much of a reaction
- Ideally looking for moves over 80k deviation from expectation for sustainable move
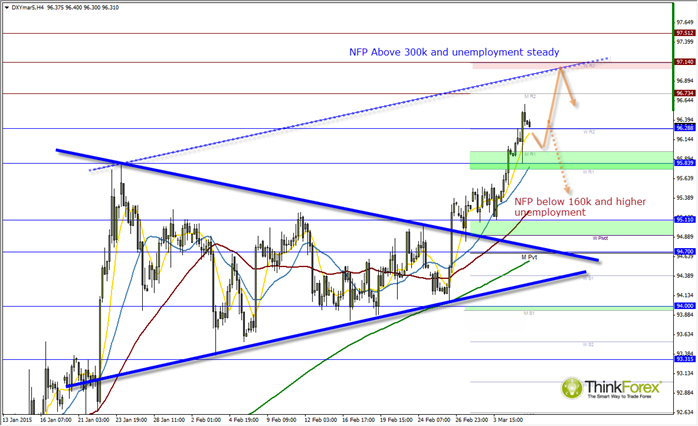
USD INDEX:
I have used the USD Index as a proxy for tonight's employment data. The key levels above are what I would use to plan TP, SL and reversals but it is the data set which will dictate how far, clean or the direction it moves.
Currently near 11-year highs and propped up by Eurozone QE then in simple terms, strong NFP data should push to new highs and weak data should see it retrace. It then comes down to how far away from expectations the data set is as to how large or sustained a move may be. If the data set is mixed (good and bad) and not too far from expectations then we can expect choppy and relatively small moves. If we some the data set unanimously in favour of US and well above expectations, we can assume a more direct upside move. By using a combination of the deviation from expectations and which data set is above or below we can make assumptions of the likely trend and duration.
Currency pairs to consider:
- USDJPY (Long for strong NFP data, short for weak data)
- EURUSD short (if strong employment to take advantage of QE and payrolls)
- Gold long (if soft data from employment)
- USD Index
- Oil (WTI, Brent)
- Oil (WTI, Brent)
CFD and forex trading are leveraged products and can result in losses that exceed your deposits. They may not be suitable for everyone. Ensure you fully understand the risks. From time to time, City Index Limited’s (“we”, “our”) website may contain links to other sites and/or resources provided by third parties. These links and/or resources are provided for your information only and we have no control over the contents of those materials, and in no way endorse their content. Any analysis, opinion, commentary or research-based material on our website is for information and educational purposes only and is not, in any circumstances, intended to be an offer, recommendation or solicitation to buy or sell. You should always seek independent advice as to your suitability to speculate in any related markets and your ability to assume the associated risks, if you are at all unsure. No representation or warranty is made, express or implied, that the materials on our website are complete or accurate. We are not under any obligation to update any such material. As such, we (and/or our associated companies) will not be responsible or liable for any loss or damage incurred by you or any third party arising out of, or in connection with, any use of the information on our website (other than with regards to any duty or liability that we are unable to limit or exclude by law or under the applicable regulatory system) and any such liability is hereby expressly disclaimed
Recommended Content
Editors’ Picks
AUD/USD hovers around 0.6500 amid light trading, ahead of US GDP

AUD/USD is trading close to 0.6500 in Asian trading on Thursday, lacking a clear directional impetus amid an Anzac Day holiday in Australia. Meanwhile, traders stay cautious due ti risk-aversion and ahead of the key US Q1 GDP release.
USD/JPY finds its highest bids since 1990, near 155.50

USD/JPY keeps breaking into its highest chart territory since June of 1990 early Thursday, testing 155.50 for the first time in 34 years as the Japanese Yen remains vulnerable, despite looming Japanese intervention risks. Focus shifts to Thursday's US GDP report and the BoJ decision on Friday.
Gold price lacks firm intraday direction, holds steady above $2,300 ahead of US data

Gold price remains confined in a narrow band for the second straight day on Thursday. Reduced Fed rate cut bets and a positive risk tone cap the upside for the commodity. Traders now await key US macro data before positioning for the near-term trajectory.
Injective price weakness persists despite over 5.9 million INJ tokens burned

Injective price is trading with a bearish bias, stuck in the lower section of the market range. The bearish outlook abounds despite the network's deflationary efforts to pump the price. Coupled with broader market gloom, INJ token’s doomed days may not be over yet.
Meta Platforms Earnings: META sinks 10% on lower Q2 revenue guidance Premium

This must be "opposites" week. While Doppelganger Tesla rode horrible misses on Tuesday to a double-digit rally, Meta Platforms produced impressive beats above Wall Street consensus after the close on Wednesday, only to watch the share price collapse by nearly 10%.


