Outlook:
Macro developments seem straightforward but they are not. We take the rise in gold as evidence of that. Uncertainty it actually quite high. If we understood what is going on in Big Picture macro, we wouldn’t have such messy charts. More than one chart is incomprehensible. One of our more useful rules is “when you can’t read the chart, change the timeframe.” But that is not helping this time until you get to the daily chart, and sometimes not even then—the dollar/yen, for example. To get a grip on the yen, you have to widen the timeframe all the way to monthly. For the euro, we have to move to the weekly chart to get any ideas.
The eurozone just beat the US in first quarter GDP, 0.6% vs. 0.5%. On the annualized basis, the euro-zone has 2.2% and the US has 0.5%. On this basis, growth is rising in the eurozone and falling back in the US. Here’s another metric--the US exited the Great Recession in 2011, measured by GDP in dollar terms recovering to the pre-crisis level ($15 trillion). It took the eurozone an extra five years to do that. The Q1 data put eurozone GDP at €2.48 trillion, compared to €2.47 trillion in early 2008. The US recov-ery was far faster and more robust than the eurozone recovery—but may not have lasting power. In this context, the eurozone may be “more stable” in the sense of being less choppy.
But at the same time, the eurozone has slid back into deflation, with CPI in the red in April (-0.2% from flat in March). The latest inflation rate in the US is 0.9% y/y as of end-March and we don’t get the next official number until May 17. But it was 1.4% in Jan and perhaps slipping backwards, too..
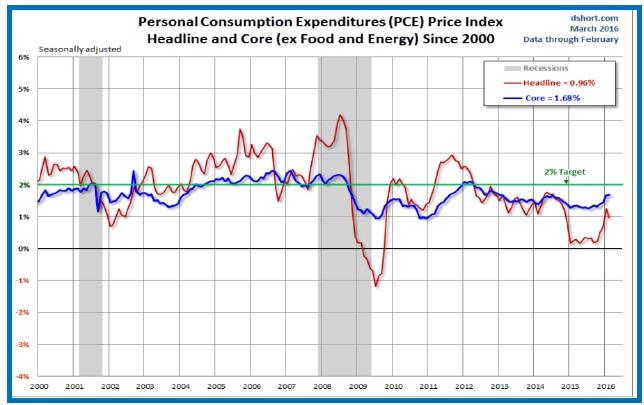
Today we get personal income and expenditures, including the PCE price index, the Fed’s preferred measure. Last time, in late March for Feb, the headline rate was 0.96% y/y, down from 1.24% the month before. The core PCE was 1.68% y/y from 1.66% the month before and the highest since Feb 2013. One forecast has core PCE falling from 1.7% (rounded) to 1.6%. Golly, when we have to go to the second decimal place to find meaning, we are probably in deep trouble. See the chart. Hope of a rising price index is hanging on by a fingernail.
The US consumer is pulling back, with household spending at only 1.9% in Q1 compared to 2.4% in Q4.
Business investment all but crashed, down 5.9% in Q1, the worst since Q2 2009. The WSJ reports this drop took 0.76% off GDP. “Spending on equipment dropped at an 8.6% pace and spending on structures fell at a 10.7% rate. But spending on intellectual-property products, such as software, picked up at a 1.7% pace.” And trade, of course, is a headwind, with the drop in exports taking 0.34% of Q1 GDP. What’s left? Housing, up 14.8% and contributing 0.49% to GDP. With GDP up 0.5%, residential investment basically contributed nearly all of it.
No wonder the stock market is down. The equity gang can be overly influenced by high-profile players. This time it was Carl Icahn, who said he had dumped all his Apple holdings and said he is “extremely cautious” on US equities. Icahn foresees “a day of reckoning unless we get fiscal stimulus.” This week-end Warren Buffett contributes to chatter at the annual Berkshire Hathaway shareholders meeting (streamed live on Yahoo, if you care). Congress never pays the slightest attention to fat-cat investors, but Icahn is right—the central bank’s tools are getting diminishing returns and the Solution is fiscal stimu-lus. Even the man on the street intuitively knows that the solution is fiscal stimulus. Look what the Tea Party has wrought, with its obsession about cutting the national debt and smaller government. Now the number of bridges at risk of literally falling down is over 1000. It says something that “bridges falling down in the US” is a Google category that gets 3.4 million entries.
To be sure, the national debt is a serious problem and so is overreach by some regulatory agencies, alt-hough look what EPA fear of overreach (or maybe incompetence) caused in Flint. The cost of an obses-sion with the national debt has been too high. No wonder Trump is so popular—he’s The Builder. Vot-ers want building. Never mind that the liberal press is up in arms about a Trump backer saying Trump has guts and would not be afraid to drop a nuclear bomb, like Truman, another non-politician. That’s the Show, or at least we all hope that’s what it is.
The stalling US economy, plus uncertainty about various developments elsewhere in the world, is be-hind the dollar’s persistent decline. This is one of those sometimes puzzling effects peculiar to FX—the US doesn’t get credit in the form of a rising dollar when conditions are good but does get a falling dollar when conditions turn bad. It’s asymmetrical. Likewise, the Teflon euro can withstand all manner of bad data that would fell a lesser currency, including inflation going from zero to negative but the euro put-ting in a new high on the same day.
A different kind of asymmetry is affecting the yen and we don’t understand it at all. The introduction of negative rates, plus the failure of policy to produce inflation, “should” be causing a weaker yen. We can’t blame the rising yen on panic “safe haven” repatriation when the world is not panicking and we don’t have any specific crisis. It can’t be capital inflows, since Japanese investors are busy buying both foreign bonds and equities. One possible explanation is that foreigners who had holdings in Japanese assets and short yen positions as a hedge are now unwinding those shorts. When you close a short, you have to buy.
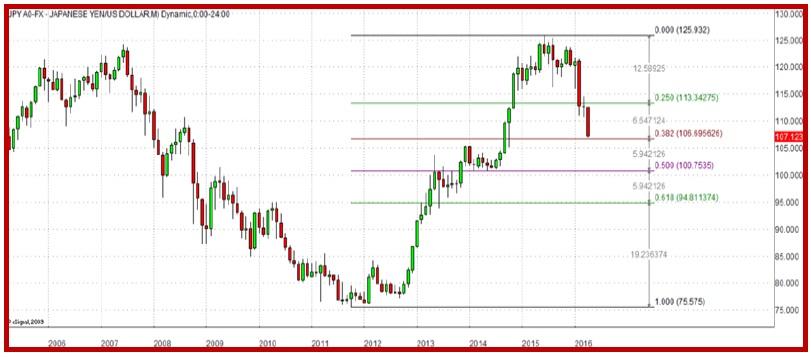
But the yen move seems too big for unwinding of hedges to be the sole cause. No doubt contributing is plain old-fashioned trend-following. Trend-following doesn’t require facts or analysis, just more trend-followers. Eventually they will peter out and when everybody and his brother is long yen, we will get a shocking, horrible, awful reversal. But nobody knows when or at what level that will occur, and worse, the chart doesn’t tell you, either. You can look at old historic highs and lows, and wonder at what point the Bank of Japan loses its cool. One idea is the 50% retracement at about ¥100. See the chart.
But the Japanese know more about FX market intervention than anyone on the planet. Instead of inter-vening, it’s not beyond imagination to think the BoJ will unveil a gigantic new plan at the June meet-ing—which comes one day after the Fed meeting. The Fed is June 14-15 and the BoJ, June 15-16. July has the same pattern. The Fed meets July 26-27 and the BoJ, July 28. What kind of coincidence is this? Assuming the Fed is going to act in June or July, the BoJ has to “coordinate” accordingly. Maybe a dou-ble-strike is in the cards, the Fed hiking and the BoJ offering a huge new stimulus at the same time. That’ll show ‘em.
The other place we are waiting for a shoe to drop is the pound. It’s fun to follow the polls and surveys and betting odds, but at some point the pound has to go into sell-off mode. Those who neglect history are condemned to repeat it. The current odds on the UK voting to stay in the EU are over 70%. But that doesn’t mean the sell-off won’t happen anyway, presumably closer to the Event (June 23). Old-timers are licking their chops. It’s not true that “nobody ever went broke shorting the pound,” but it is true that when traders go gunning for sterling, you need to get on the bandwagon or get out of the way.
| Current | Signal | Signal | Signal | |||
| Currency | Spot | Position | WEAK | Date | Rate | Gain/Loss |
| USD/JPY | 107.07 | SHORT USD | NEW*STRONG | 04/29/16 | 107.07 | 0.00% |
| GBP/USD | 1.4584 | LONG GBP | WEAK | 04/12/16 | 1.4309 | 1.86% |
| EUR/USD | 1.1385 | LONG EURO | WEAK | 03/11/16 | 1.1094 | 2.35% |
| EUR/JPY | 121.91 | LONG EURO | WEAK | 03/29/16 | 127.24 | -3.43% |
| EUR/GBP | 0.7806 | LONG EURO | STRONG | 03/11/16 | 0.7759 | 0.40% |
| USD/CHF | 0.9632 | SHORT USD | NEW*WEAK | 04/29/16 | 0.9632 | 0.00% |
| USD/CAD | 1.2517 | SHORT USD | STRONG | 02/01/16 | 1.4031 | 10.44% |
| NZD/USD | 0.6978 | LONG NZD | STRONG | 02/01/16 | 0.6478 | 7.46% |
| AUD/USD | 0.7632 | LONG AUD | STRONG | 01/25/16 | 0.6980 | 9.30% |
| AUD/JPY | 81.71 | LONG AUD | WEAK | 03/03/16 | 83.57 | -1.23% |
| USD/MXN | 17.1763 | SHORT USD | STRONG | 02/23/16 | 18.1208 | 4.21% |
This morning FX briefing is an information service, not a trading system. All trade recommendations are included in the afternoon report.
Recommended Content
Editors’ Picks
EUR/USD climbs to 10-day highs above 1.0700

EUR/USD gained traction and rose to its highest level in over a week above 1.0700 in the American session on Tuesday. The renewed US Dollar weakness following the disappointing PMI data helps the pair stretch higher.
GBP/USD extends recovery beyond 1.2400 on broad USD weakness

GBP/USD gathered bullish momentum and extended its daily rebound toward 1.2450 in the second half of the day. The US Dollar came under heavy selling pressure after weaker-than-forecast PMI data and fueled the pair's rally.
Gold rebounds to $2,320 as US yields turn south

Gold reversed its direction and rose to the $2,320 area, erasing a large portion of its daily losses in the process. The benchmark 10-year US Treasury bond yield stays in the red below 4.6% following the weak US PMI data and supports XAU/USD.
Here’s why Ondo price hit new ATH amid bearish market outlook Premium

Ondo price shows no signs of slowing down after setting up an all-time high (ATH) at $1.05 on March 31. This development is likely to be followed by a correction and ATH but not necessarily in that order.
Germany’s economic come back

Germany is the sick man of Europe no more. Thanks to its service sector, it now appears that it will exit recession, and the economic future could be bright. The PMI data for April surprised on the upside for Germany, led by the service sector.

