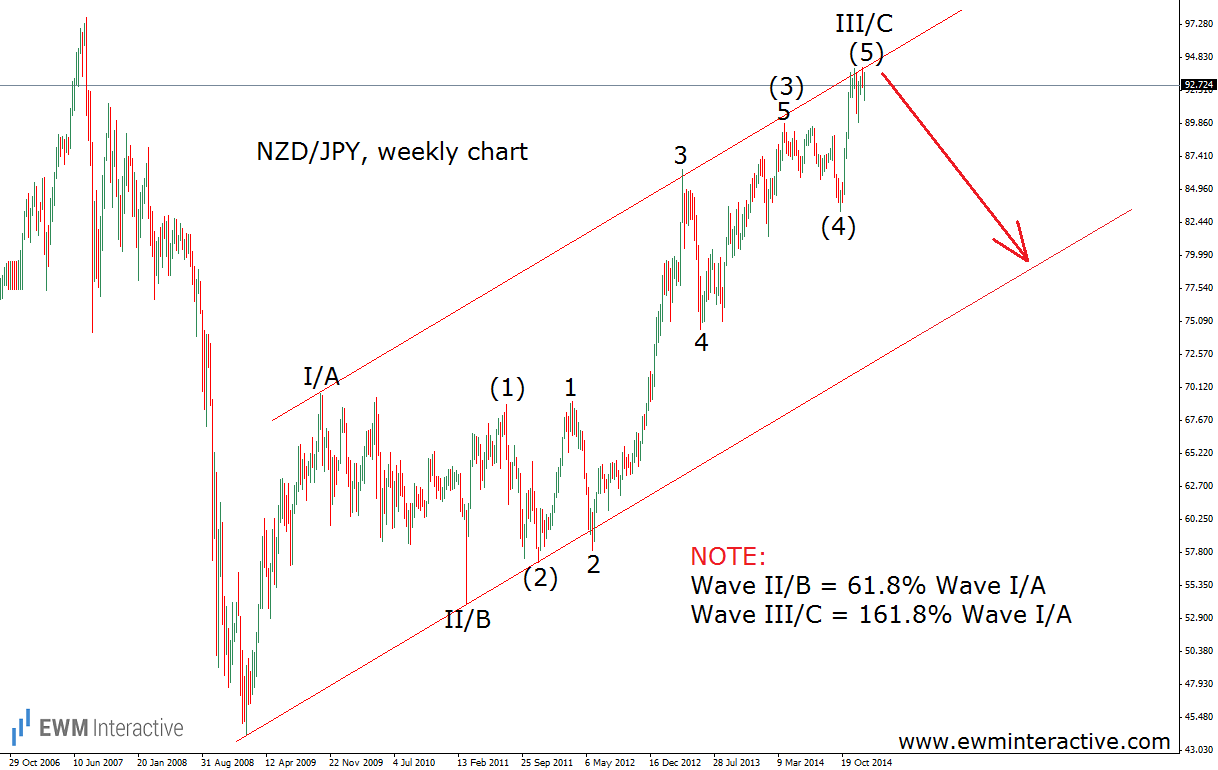
The NZDJPY exchange rate took a hard hit during the crash of 2007-2009, falling down from the heights of 97.70 to as low as 44.20. The first week of February 2009 gave the start of a huge recovery, which led the pair 50 figures higher to the 94.00 mark and is still in progress. However, there are at least four different technical reasons, which make us believe the bulls behind NZDJPY’s impressive comeback are running out of power.
First of all, the wave structure. As the chart shows, we could easily count three waves to the upside since the 2009 bottom, labeled I/A, II/B and III/C. We are even able to see two smaller degrees of trend within wave III/C. According to the Elliott Wave Principle, there are two options from now on: NZDJPY is in the middle of a five-wave impulse and we should prepare for its wave IV, or NZDJPY is about to finish an A-B-C zig-zag and the decline we are assuming could turn out to be even bigger.
Second, the rate has touched the upper line of a trend channel, which often serves as a resistance. If we add the horizontal resistance area around the 2007 top as a third reason, we will have enough evidence suggesting this is not the time to buy. Besides that, there is a fourth reason – the Fibonacci levels. Third waves usually are 1.618 or 2.618 times the length of the first wave. In this case, wave III/C is almost exactly 161.8% wave I/A. If this analysis is correct, NZDJPY should soon be expected to form a top and reverse to the downside, probably towards the lower line of the channel around 80.00 or maybe even lower.
Recommended Content
Editors’ Picks
EUR/USD clings to gains near 1.0700, awaits key US data

EUR/USD clings to gains near the 1.0700 level in early Europe on Thursday. Renewed US Dollar weakness offsets the risk-off market environment, supporting the pair ahead of the key US GDP and PCE inflation data.
USD/JPY keeps pushing higher, eyes 156.00 ahead of US GDP data

USD/JPY keeps breaking into its highest chart territory since June of 1990 early Thursday, recapturing 155.50 for the first time in 34 years as the Japanese Yen remains vulnerable, despite looming intervention risks. The focus shifts to Thursday's US GDP report and the BoJ decision on Friday.
Gold closes below key $2,318 support, US GDP holds the key

Gold price is breathing a sigh of relief early Thursday after testing offers near $2,315 once again. Broad risk-aversion seems to be helping Gold find a floor, as traders refrain from placing any fresh directional bets on the bright metal ahead of the preliminary reading of the US first-quarter GDP due later on Thursday.
Injective price weakness persists despite over 5.9 million INJ tokens burned

Injective price is trading with a bearish bias, stuck in the lower section of the market range. The bearish outlook abounds despite the network's deflationary efforts to pump the price.
Meta takes a guidance slide amidst the battle between yields and earnings

Meta's disappointing outlook cast doubt on whether the market's enthusiasm for artificial intelligence. Investors now brace for significant macroeconomic challenges ahead, particularly with the release of first-quarter GDP data.
