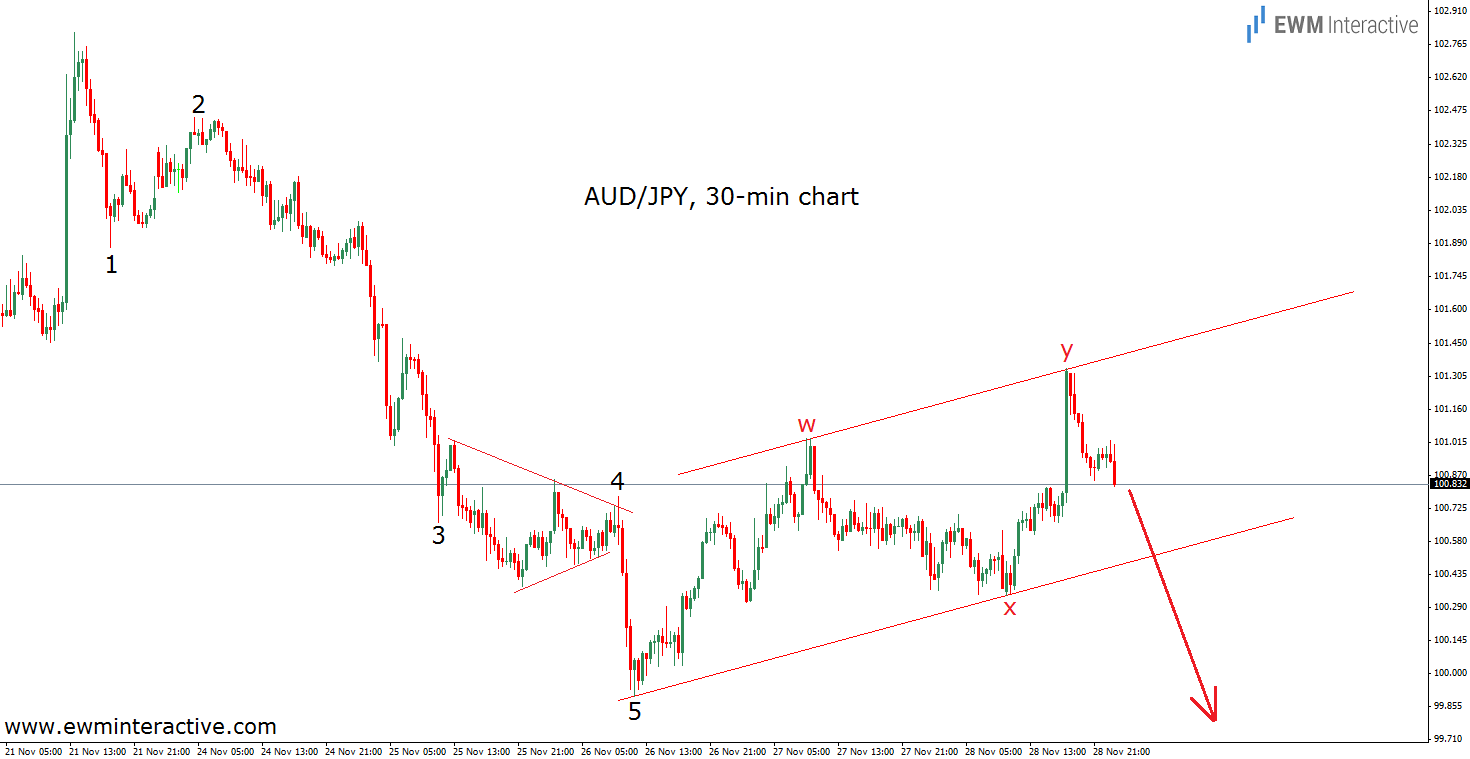
“We should not be surprised, if the support level around 100.00 gives up.” This is the last sentence of a forecast called “The Bears Are Ready To Attack AUDJPY”, which we published on November 29th, when the pair was trading close to 101. Our expectations were based on the wave structure visible on the 30-minute chart of AUDJPY given below.
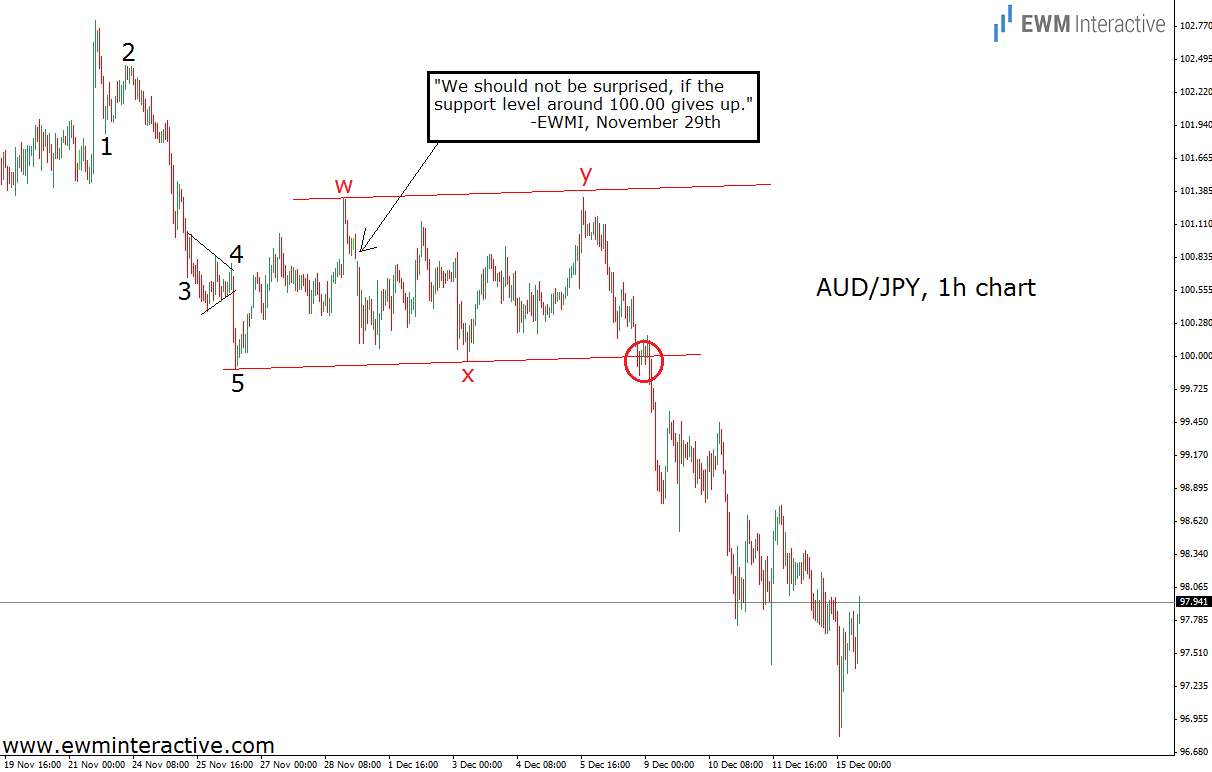
According to the Elliott Wave Principle, every 5-3 cycle, like the one shown on the chart, is followed by a move in the direction of the five-wave sequence. That is the reason why we anticipated that sooner or later AUDJPY should start declining again. On the next chart you will be able to see how the pair has been developing after this forecast.
As visible, the market decided to continue sideways for a while. However, this did not change the bearish expectations at all. As soon as this w-x-y double zig-zag retracement was over, the exchange rate resumed its downtrend. Last week the support zone around 100.00 finally gave up, which led to more weakness. Earlier today AUDJPY touched 96.80. Compared to the level it was at when the forecast was made, this is a sell-off of about 400 pips so far. Having in mind the big picture outlook, it may be just the beginning…
Trading financial instruments entails a great degree of uncertainty and a variety of risks. EMW Interactive’s materials and market analysis are provided for educational purposes only. As such, their main purpose is to illustrate how the Elliott Wave Principle can be applied to predict movements in the financial markets. As a perfectly accurate method for technical analysis does not exist, the Elliott Wave Principle is also not flawless. As a result, the company does not take any responsibility for the potential losses our end-user might incur. Simply, any decision to trade or invest, based on the information from this website, is at your own risk.
Recommended Content
Editors’ Picks
EUR/USD holds gains above 1.0700, as key US data loom

EUR/USD holds gains above 1.0700 in the European session on Thursday. Renewed US Dollar weakness offsets the risk-off market environment, supporting the pair ahead of the key US GDP and PCE inflation data.
GBP/USD extends recovery above 1.2500, awaits US GDP data

GBP/USD is catching a fresh bid wave, rising above 1.2500 in European trading on Thursday. The US Dollar resumes its corrective downside, as traders resort to repositioning ahead of the high-impact US advance GDP data for the first quarter.
Gold price edges higher amid weaker USD and softer risk tone, focus remains on US GDP

Gold price (XAU/USD) attracts some dip-buying in the vicinity of the $2,300 mark on Thursday and for now, seems to have snapped a three-day losing streak, though the upside potential seems limited.
XRP extends its decline, crypto experts comment on Ripple stablecoin and benefits for XRP Ledger

Ripple extends decline to $0.52 on Thursday, wipes out weekly gains. Crypto expert asks Ripple CTO how the stablecoin will benefit the XRP Ledger and native token XRP.
US Q1 GDP Preview: Economic growth set to remain firm in, albeit easing from Q4

The United States Gross Domestic Product (GDP) is seen expanding at an annualized rate of 2.5% in Q1. The current resilience of the US economy bolsters the case for a soft landing.

