![]() TradingDaze
TradingDaze
Aisys Technologies Inc.
The next 1/2 year Forecast Dates (July December 2016) are out.
SP500
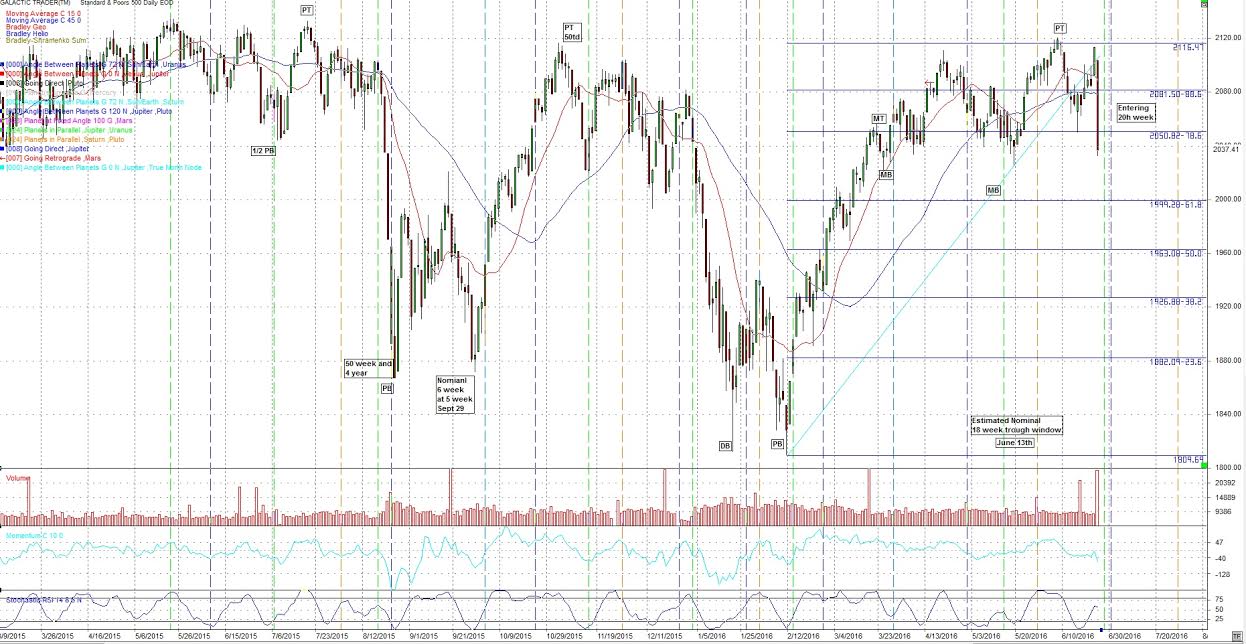
For the SP500, cyclewise Feb 11 was the Primary cycle trough. ;1 that started on Aug 24th. Feb 11th was a slightly lower low than Jan 20th low. Jan 20th was the low for a number of other indices. Feb 11th started a new nominal 18 week cycle in the SP500 and we are entering the 20th week. The nominal 6 week, there are often 3, 6 week cycles in the nominal 18 week cycle. The range is 5 to 7 weeks.
Another possibility was May 19th was a short (14 week) trough for the nominal 18 week cycle and we are now entering the 6th week of a Primary cycle that started on May 19th. We had noted May 19th as being important as it was a day for the 24 harmonic between the Sun and Saturn (chart further down) we have been following.
We'll treat this as 20th week of an older cycle and will probably drop May 19th as a possibility in the coming week. Subscribers will receive an ALERT if the Primary cycle is changed. Fridays move down now has the index testing the May 19th low. I've been looking for the SP500 to go lower than the May 19th low.
Currently June 8th looks like the Primary cycle top. If so then we can look for a 2 to 5 week decline. We are going into the 3rd week from June 8th so a low is expected within the next 2 weeks. The reason for Brexit , the sharp declines in world markets and possible other difficult events was the Astrology pointed out in an ALERT to subscribers and posted on this blog under "Special Update June 23, 2016".
So from that Special Update the exact date for Vedic Uranus entering zero degrees of Aries is Monday June 27. This is an approximate 84 year cycle so I wasn't expecting an event on the exact day. We may see further surprise events in either the markets, geophysical or other unusual happenings, see June 30/July 1st area further down.
Notice that price is now below the 15 and 45 day sma. The 15 is higher than the 45 day sma's but curling over. That may change quickly next week as we expect the Primary trough to be in this coming week or first the first week in July.
On the Astrology front this coming week has a number of meaningful aspects although I think we have just seen a powerful Astrological aspect per the last alert.
Coming up we have:
June 6 Jupiter waning trine Pluto Mild but consistent moves close to a Primary cycle low.
June 27 Venus waxing trine Neptune More effect for shorter cycles rather than a Primary cycle.
June 29 Mars Stationary Direct The dates around this aspect can be very volatile around a nominal 18 week (Primary) cycle. It can also be present at the trough of a 50 week. We are currently 44 weeks along from the last 50 week trough so we are in range. June 24th's violent market action could have been affected by Mars Direct. The Vedic Uranus transit at 0''Aries 0' was the main culprit.
June 30 Mars parallel Pluto Potential violence.
June 30 Venus opposition Pluto Present near Primary cycles given a broad orb (+2 weeks)
July 7 Venus square Uranus
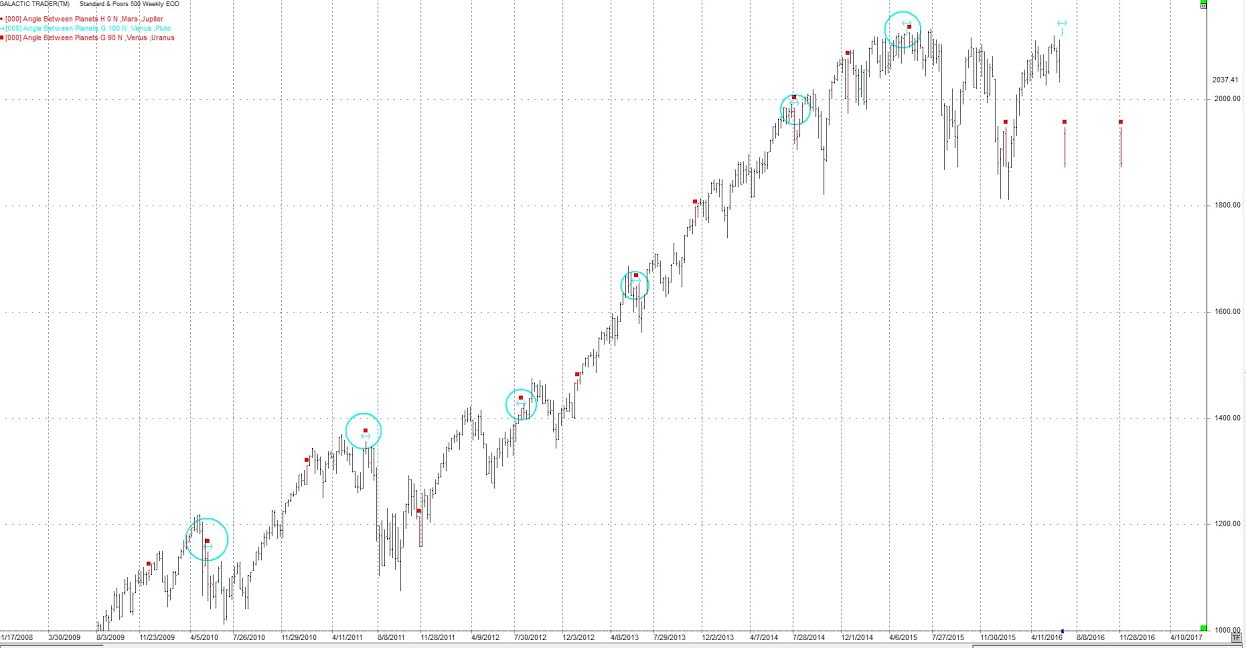
For the next two weeks Venus and Pluto are emphasized by transit. Venus is translating the Uranus/Pluto square we followed for a few years. The following weekly chart of the SP500 shows Venus opposition Pluto (blue double arrow) and Venus square Uranus (red squares). Previous occurrences are circled and show the index moved down shortly after these events. As mentioned, Venus, amongst other things is money while Pluto is power and control and big wealth.
There is a lot of Astro activity in the June 30/July 1st area. There is some indication of violence. The special update issued on June23 also indicated possible geophysical or violent events of some type, including violent weather. I mention but won't dwell on these.
The following transit is exact again in September but will be coloring this period of time (all year). Lies and deceit continue.
Saturn square Neptune in the middle of a 3 pass, 2 exact hits to come this year Saturn is about social order, structure and regulations. Neptune can be politically unrealistic and a desire to avoid confrontation. It can be devious, underhanded and use subversive tactics.
This aspect is often present near times when there is a change in trend for interest rates or inflation. It can also be a period of epidemics, pandemics suffering, depression and money valuation problems. This could be a change in the world's reserve currency or issues around it. A large increase in precious metals is also possible as it is a money valuation issue. This 36 year aspect has been associated with political changes, reforms and development of socialism. One wonders in regards to epidemics and sickness, would this be natural illnesses or manmade. If you feel depressed or not at ease this aspect may be the cause. One of these planets may be hitting a planet in your personal horoscope.
Neptune can be the height of spirituality or illusion, delusion and deceit. Saturn is reality, Karmic debt, contraction, depression, sorrow and disappointment. When these planets meet look for political changes and reforms. Self sacrifice may come to the fore. This aspect seems to have a history with the British Royal Family.
The above description of the Saturn/Neptune square has been repeated for a number of weeks. Think of the events that have taken place recently with mass murders in the U.S., alligators in Disneyland and the murder of a UK member of parliament. If these events seem unreal look to Neptune.
Looking for dates for the trough and turn up I'm looking at June 30 through July 7 +2 td's. Markets will be volatile for the next couple of weeks after such a surprise and big move.
I've noticed the Bradley indicator (mainly heliocentric) has been acting quite well as a forecasting tool. This indicator is often misunderstood. I'll include descriptions and the turns it is forecasting in the July subscribers report.
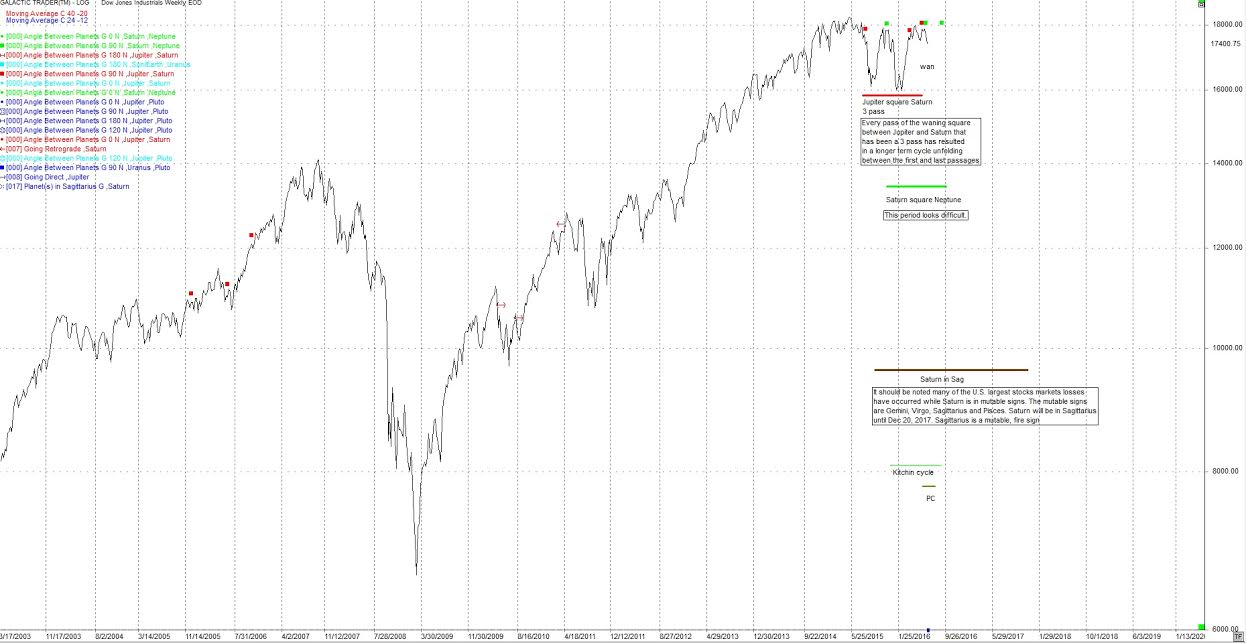
On the following weekly chart of the DJIA, the red squares are Jupiter square Saturn, now past, and the green squares are Saturn square Neptune. It's between these two events that I have been looking for the Primary cycle low.
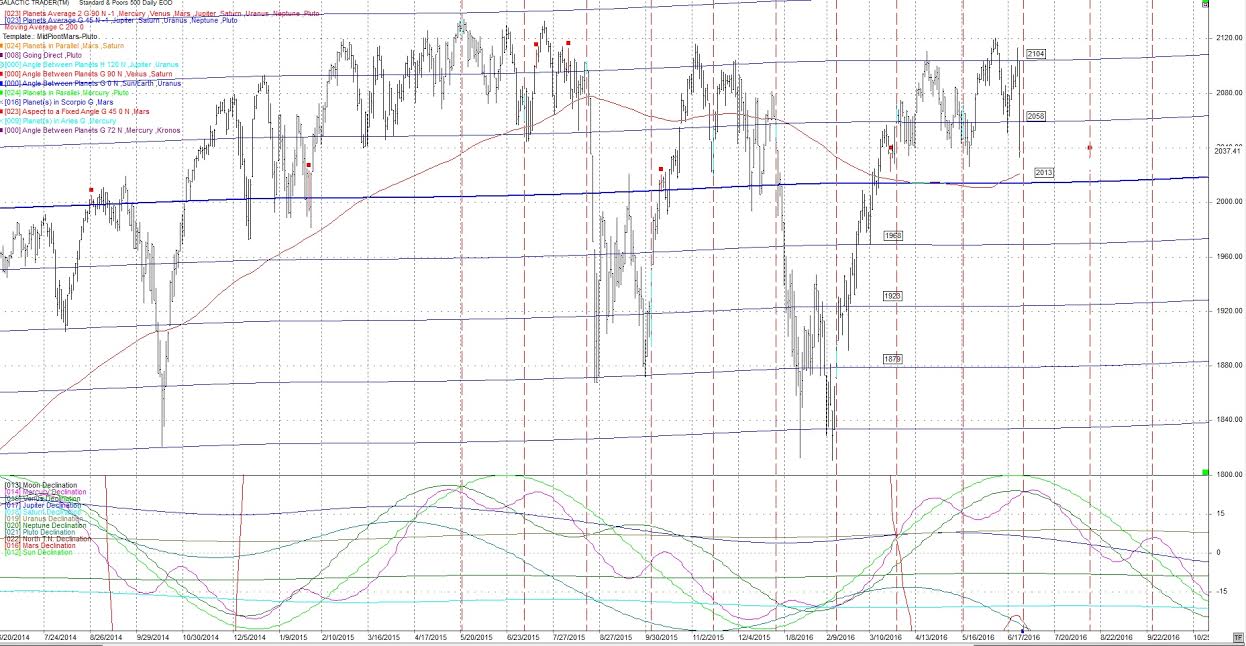
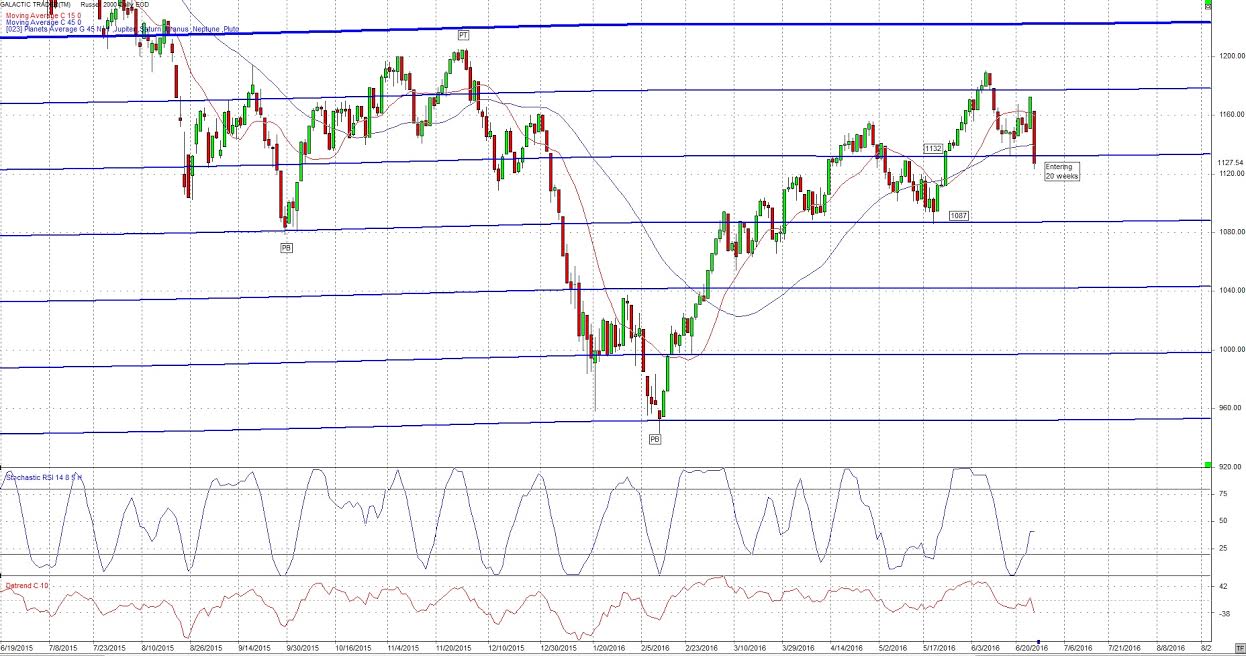
The next 2 charts are daily charts of the SP500, and the Russell 2000. The horizontal blue lines are the average longitude of the planets Jupiter, Saturn, Uranus, Neptune and Pluto on both charts This average is converted to price and displayed on the charts. Notice how well they have acted as support and resistance. We'll see shortly whether 2013 acts as resistance. The red vertical lines are a 45 cd cycle I've been following since the May 20, 2015 high.
The next chart is the Russell 2000. This index is subject to far less manipulation than the SP500. Notice how well it respects the Astrological average price lines. Here, the blue lines again are the average longitude of the planets Jupiter through Pluto converted to price. The Russell put in a low on May 19th and touched the planetary average line but I'm no longer looking at this as a new Primary cycle. We should be in the 20th week of an older cycle.
Other longer term cycles that we have been following may have found their trough on Jan 20 or Feb 11. This would include the 4 year and 6.5 year cycles. To confirm these cycles I'm waiting for the cycle low I'm expecting in June 2016. If Jan 20 and Feb 11 are the lows this would help explain the sharp move up starting in February. Assuming the 2009 low was an 18 year cycle low, we may be looking at a 9 year cycle low late 2017 2018.
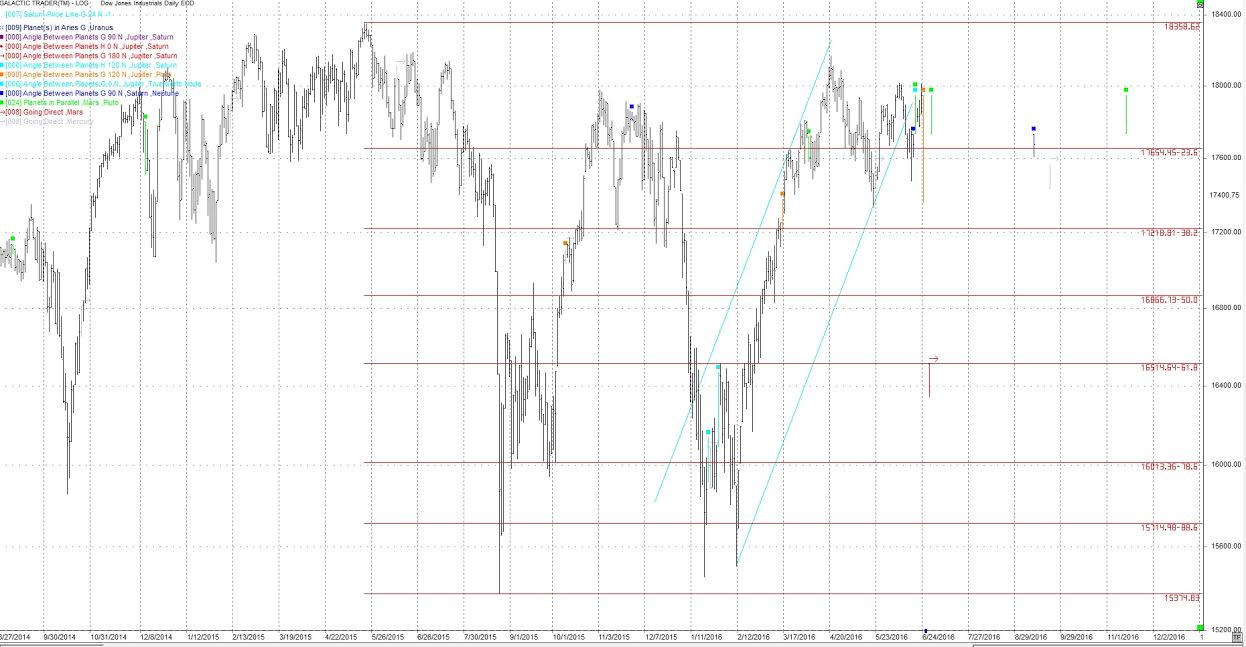
The following daily chart of the DJIA shows some of the important aspects coming up in June/early July. Note the channel which started in January. We got the price break through the bottom of this channel as mentioned. Price is now close to the 23.6% Fibonacci retracement based on the high at May 20, 2015 to the low on Aug 24, 2015. The aspects are as follows.
Blue Squares Saturn square Neptune
Green Squares Mars parallel Pluto
Orange Squares Jupiter trine Pluto
Light Blue Squares Jupiter conjunct North Node
Red Arrow Mars turning Direct
The first week in July has a number of potent aspects as well. It should be a volatile ride. Pluto is emphasized and so is Venus. Venus stands for money, amongst other things.
Harmonics
I continue to watch the 24th harmonic cycle (360/24) cycle which are the brown squares on the following daily chart. It just hit on June 17 the same day as the Saturn waning square to Neptune. Monday maybe very important.
The next date for the Sun/Saturn 24th harmonic is July 1st, so July 5th in the USA. Another date possibly signaling a change in direction.
Gold
I'm looking at March 28th as the start of a new nominal 18 week cycle ;1 trough. We had a low on May 31 which was slightly lower than the March 28th low. Our rules would state that we are now in a new Primary cycle starting May 31. This would make the Primary cycle which started on March 28th very short at 9 weeks.
Two other possibilities are:
The May 31 low was a Primary 1/2 cycle.
The May 31 low was the 26th week of an older Primary cycle which started on Dec 3, 2015
We'll need another week to sort out where we are in the Primary cycle for Gold.
Coming up we have Mars turning Direct on June 29th. Recent history for Mars Direct has Gold moving down after the Mars Direct signature.
Gold has followed general Mars transits in Scorpio. Starting with Mars entering Scorpio in early January 2016 Gold went up. The move ended when Mars entered Sagittarius on March 5th. Gold then went sideways until Mars turned retrograde on April 17th.
On May 27 Mars reentered Scorpio moving backwards. The red x's on the following daily chart of Gold show the effect of the Mars transits.
Mars will turn direct on June 29th and leave Scorpio for Sagittarius once again on August 2nd where Gold has a history of moving down or flat. We expect Gold to be flat to down once we get into August but the question remains. "What Primary cycle are we in". Recent activity would put it starting on May 31st, but as we said above we'll take a week to try and determine which cycle we are in.
Price is now above the 15 sma and 45 sma. Both moving averages have turned up with the 15 day above to move above the 45 day sma. Gold may benefit from the uncertainty over the next few weeks.
The red vertical lines are the 14 cd cycle which has been at tops and bottoms for short term trend changes. The next date is June 30th.
On the following daily Gold charts there are the Venus (green), Jupiter (blue). These are the longitude of the planet converted to price. Gold often makes a big move close to when the Venus and Jupiter price lines cross. The next cross is July 1st. This date is coming up alot.
Watch this area as Gold may follow the Venus price line (green) up into the July 1st date. Pluto is active by transit. Although not a direct ruler, Pluto has an effect on Gold price changes. Gold prices may get volatile.
Crude
Feb 11 had another lower low and is now marked a Primary cycle trough which has us starting the 20th week of the nominal 18 week cycle. It is possible June 16th was a Primary cycle trough but we'll need a couple of days of price action to confirm. Until we do it is marked as the 20th week of an older Primary cycle.
Mentioned many times Jupiter and Neptune are the corulers of crude. Neptune is in Pisces, the sign that it rules, making it stronger. Following are dates to watch for crude.
June 26 Jupiter trine Pluto
June 27 Venus trine Neptune
July 3 Sun trine Neptune
We have 1 more exact hit of the Jupiter/Pluto trine, that is June 26th. The previous dates were Oct 9, 2015 and March 16, 2015. This aspect has tended to be near highs. I suspect this will be near a Primary cycle turn if it has not already been in by then.
The next daily chart of crude has the Jupiter (blue) and Neptune (grey) Price Lines. These are the two planets that rule crude. Price is following both price lines sideways. I'm looking for a move and probably down first then up. The red squares are the 24th harmonic between the Sun and Neptune. Amongst other things this harmonic is for a "short term change in trend". The next date is July 1st hmmmm, seeing June 30 and July 1st quite abit. I'm looking for crude to break through the Jupiter and Neptune price lines at 48.00 and 47.75 approx. for signs of a move to a Primary cycle trough. Look at MACD on the following chart. Turning up, just crossing zero.
I've been experimenting with another Astro/Gann technique to forecast price. I emphasize experimenting so watch oil price but I wouldn't trade based on this forecast until I have more history. If the following is correct it is probably indicating the Primary cycle trough is in.
Oil Price Forecast Test (June 17)
July 7 price range 52.40 56.80
This blog will cover the stock market from a timing perspective. As such there will be no coverage of fundamental analysis. The approach will be to look for market cycles which are timed with Astrological cycles. When found technical analysis will be used to fine tune entries and exits. Most articles will include examples. For those who are dubious because it "just should not work", read a few posts. You may be very surprised. I am a certified accountant, computer programmer and astrologer. NORMAL STUFF The projections and information provided does not constitute trading advice, nor an invitation to buy or sell securities. The material represents the personal views of the author. Anyone reading this blog should understand and accept they are acting at their own risk. Each person should seek professional advice in view of their own personal finances.
Recommended Content
Editors’ Picks
EUR/USD holds steady near 1.0650 amid risk reset

EUR/USD is holding onto its recovery mode near 1.0650 in European trading on Friday. A recovery in risk sentiment is helping the pair, as the safe-haven US Dollar pares gains. Earlier today, reports of an Israeli strike inside Iran spooked markets.
GBP/USD recovers toward 1.2450 after UK Retail Sales data

GBP/USD is rebounding toward 1.2450 in early Europe on Friday, having tested 1.2400 after the UK Retail Sales volumes stagnated again in March, The pair recovers in tandem with risk sentiment, as traders take account of the likely Israel's missile strikes on Iran.
Gold: Middle East war fears spark fresh XAU/USD rally, will it sustain?

Gold price is trading close to $2,400 early Friday, reversing from a fresh five-day high reached at $2,418 earlier in the Asian session. Despite the pullback, Gold price remains on track to book the fifth weekly gain in a row.
Bitcoin Price Outlook: All eyes on BTC as CNN calls halving the ‘World Cup for Bitcoin’

Bitcoin price remains the focus of traders and investors ahead of the halving, which is an important event expected to kick off the next bull market. Amid conflicting forecasts from analysts, an international media site has lauded the halving and what it means for the industry.
Geopolitics once again take centre stage, as UK Retail Sales wither

Nearly a week to the day when Iran sent drones and missiles into Israel, Israel has retaliated and sent a missile into Iran. The initial reports caused a large uptick in the oil price.