It’s been a torrid start to 2016 and there has been plenty of hyperbole in the media about the markets. Some of that may have been justified. But it never hurts to take a step back and look behind the headlines and sound bites at what’s really happening. Perhaps the best way to do that is to look at what the data is telling us and if you like let the facts speak for themselves.
A picture can speak a thousand words
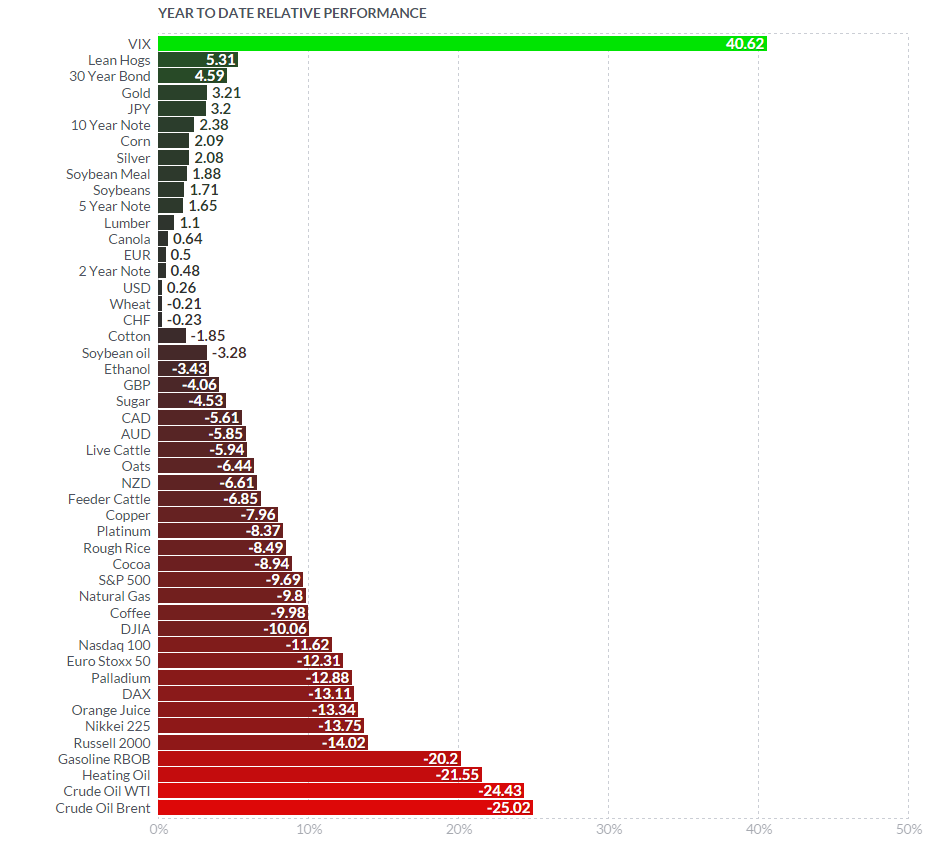
As we can see from the chart below we are in “Risk off” mode. The VIX index which is often thought of as measure of “Fear & Greed” has performed strongly year to date. The higher the volatility index rises the more fear there is in the market. Note though that even after this sharp rise the VIX is still less than half way to its 52 week intraday high, seen in the turmoil that characterized the later part of August last year.

The chart shows the performance YTD of selected US futures contracts (Source Finviz.com)
We can also see that Safe-haven assets have made gains since the turn of the year. Gold, the US 30 year bond and the Japanese Yen (JPY) have added at least 3.2% as of the close 19-01-2016 (for more detail about JPY as safe haven see my recent article the perpetual learning curve )
Equities have been hit hard
The biggest casualties Year to Date, apart from Oil and Gas, have been global equities. The Japanese Nikkei has been particularly hard hit. The index has many large exporters within its ranks and as a consequence it has been hit by a weaker Chinese Yuan and a strengthening Yen. Both of which combine to make Japanese exports more expensive relative to their Asian peers.
Remember that a weak Yen was one of Shinzo Abe’s Three Arrows policies, which were intended to reflate the Japanese economy. It remains to be seen at what point the BOJ will try to weaken the Yen if at all. But presumably they won’t wish what little success they have had in rebooting the economy swept away.
Oil & Inflation
Oil prices continue to fall and the focus may now move from the absolute price of Oil (which is surely not too far from making the move to capitulations lows. whether that be at $10, $15 or $20 per barrel) to the effect that low Oil prices are having on levels of inflation. That effect is to depress levels of inflation and to keep them rooted very closely to and in some cases below zero, particularly in developed economies.
More over prolonged low levels of inflation are having a pronounced negative effect on market expectations about future inflation growth.

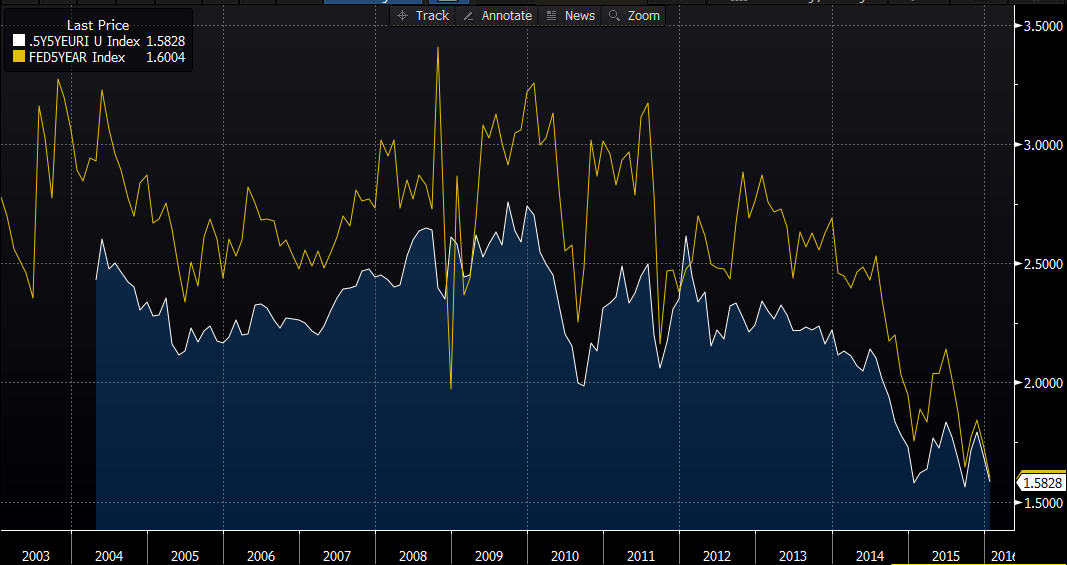
The chart below shows the implied levels of future Inflation in both Eurozone and USA
(USA in yellow, EZ in white: Rates are derived from the respective Futures and Swaps markets) source Blonde Money.
As we can see from the chart above the inflation outlooks on both sides of the Atlantic are heading lower once more .This chart takes on added significance when you realise that these implied rates of inflation are forecasts for inflation five years hence.
An unpleasant surprise
Inflation is often seen as a proxy for or companion to economic growth. I looked at the prospects for global growth in the article Growing Pains on the 13th Of January and I have seen nothing to dispel my concerns, since then. Indeed the IMF has trimmed its global growth forecast by -0.2% since I wrote the article.
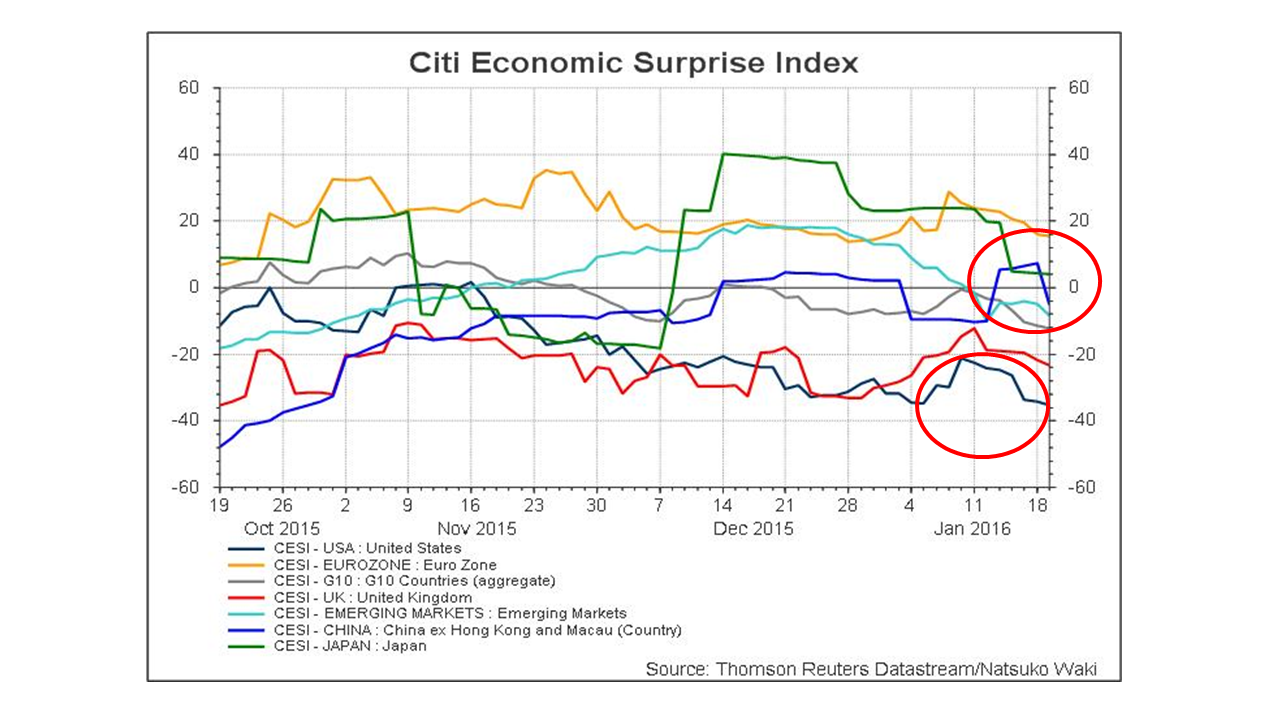
In assessing the macroeconomic background and the implications for markets and prices I like to look at the trends in the underlying data. One tool I find very effective in aiding this is the Citi Economic Surprise Index. Which measures the deviation of economic data releases from the consensus of analyst’s forecasts, on a geographic/ regional basis. The higher the index score above zero the bigger the cumulative beat, the lower the score below zero the bigger the disappointment.

Charts shows the deviation of economic data from the consensus of analyst’s forecasts
I have highlighted, in the red ellipses above, the current situation for both the USA (dark blue line) and China (bright blue line) both of which have seen their readings dip and trend lower in recent weeks. The scores are cumulative and could of course reverse direction on any substantial positive surprises. However the charts suggests to me that this is not what we will see in the medium term.
Worse before it gets better
As I write the Nikkei has officially moved into a bear market, having fallen by more than 21% from its recent high, to its closing level as of the 20-01-16. Dollar Yen (JPY USD) has tested down to 115.97 before bouncing and European equity indices are sharply lower. Many by as much as 3%.
I said on television a week ago that the current downturn was a correction rather than a crash. That view still stands as we haven’t had a “Lehman Brothers moment “which completely derails the situation.
There are pinch points however, such as high levels of Dollar denominated debt in China and the Emerging Markets and of course the ongoing commodity price plunge and deflationary spiral mentioned above. Which means we can’t rule that sort of inflection point out of the picture entirely I am afraid.
Note several other leading equity indices have now moved into technical bear markets and whilst it’s probably best to judge these things on a weekly or even monthly basis, this will inevitably weigh further on investor sentiment.
The “smart money” is cautious but not panicking
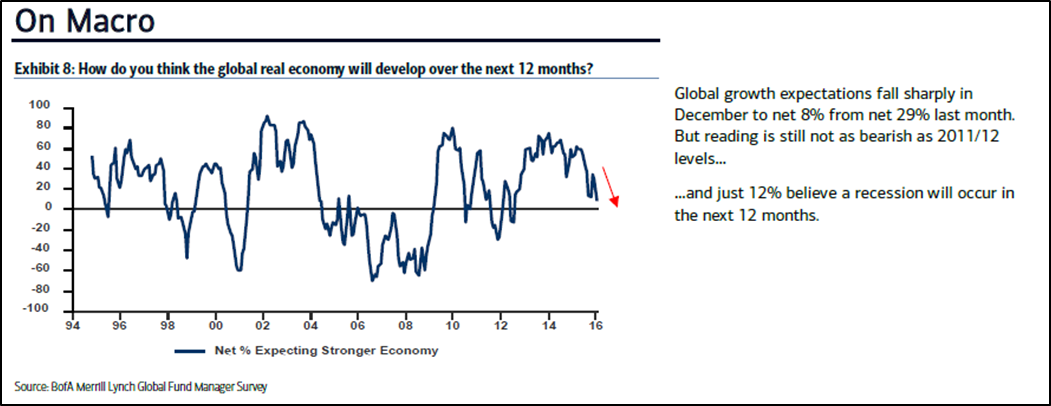
Let’s leave the last word to Fund Managers that control more than $500 bln in assets. As questioned by Bank of America Merrill Lynch in their influential and informative monthly survey.
As we can see from the graphic below the respondents are increasingly bearish on the global growth outlook but only 12% of them believe we will see a recession in the next 12 months.

Chart shows expectations for global growth amongst the Fund Managers participating in the BOA ML Survey.
Finally I should remind readers that in periods of heightened volatility and uncertainty markets may be less liquid and price action more exaggerated. In these situations it’s sensible to review your exposure and risk, your trade sizes and placement of stop losses.
Trading with currencies and CFDs is speculative in nature and could involve the risk of loss. Such trading is not suitable for all investors. Before using the services of Admiral Markets AS please acknowledge the risks associated with trading, terms and conditions of the services and consult and expert if necessary.
Recommended Content
Editors’ Picks
EUR/USD climbs to 10-day highs above 1.0700

EUR/USD gained traction and rose to its highest level in over a week above 1.0700 in the American session on Tuesday. The renewed US Dollar weakness following the disappointing PMI data helps the pair stretch higher.
GBP/USD extends recovery beyond 1.2400 on broad USD weakness

GBP/USD gathered bullish momentum and extended its daily rebound toward 1.2450 in the second half of the day. The US Dollar came under heavy selling pressure after weaker-than-forecast PMI data and fueled the pair's rally.
Gold struggles around $2,325 despite broad US Dollar’s weakness

Gold reversed its direction and rose to the $2,320 area, erasing a large portion of its daily losses in the process. The benchmark 10-year US Treasury bond yield stays in the red below 4.6% following the weak US PMI data and supports XAU/USD.
Here’s why Ondo price hit new ATH amid bearish market outlook Premium

Ondo price shows no signs of slowing down after setting up an all-time high (ATH) at $1.05 on March 31. This development is likely to be followed by a correction and ATH but not necessarily in that order.
Germany’s economic come back

Germany is the sick man of Europe no more. Thanks to its service sector, it now appears that it will exit recession, and the economic future could be bright. The PMI data for April surprised on the upside for Germany, led by the service sector.