Jack Steiman, On Not Bullish, Not Bearish, But Correcting (SwingTradeOnline.com)
The short-term charts have some pretty compressed down oscillators that normally lead to a bounce, especially when they have a positive divergence in place. We have that here, and while we can't rule out a complete crater down, I don't think the market is quite ready for the next leg lower. Sure, in time, but not right here, although you don't let your guard down and you avoid froth stocks like you would the plague. No reason to be involved with those types of stocks, even if we get the bounce. While this divergence gives hope for a short-term bounce, the medium term looks poor for the bulls at this moment in time. Things can always change, but the charts are suggesting lower in time.
Monday started out with lots of hope as Citigroup Inc. (C) released a solid earnings report. The stock beat on the top and bottom line and was rewarded throughout the day, although it closed off the highs. The financials held up well, but once the Nasdaq was up 50 points it was all downhill from there as the bears are now getting aggressive on moves higher. They have the indexes below their 50-day exponential moving averages and are going to fight like mad to keep it that way.
While Monday wasn't a disaster for the bulls, closing so far off the highs wasn't good, even with good divergences in place. This is what often occurs when a market is shifting from bullish to more bearish for the short term. That's the case even with divergences and oversold. It's just tougher to maintain upside action. Monday was certainly a case in point for how difficult the game is for the bulls now. Hopefully, the existing divergences can take us higher before falling once again with force.
When markets turn like this from bullish to mostly lower it's all about adaptation. If they don't adapt they pay the piper in a way that's unpleasant and mostly unnecessary. If you recognize what's going on you can deal with things in a more positive fashion. Not only do you need to be able to recognize bull and bear markets, but these types of markets as well. Not bullish. Not bearish. But correcting. We still do not have a single open gap down on the Nasdaq 100, even though it's well below the 50-day exponential moving average, which is utterly amazing. Gaps should occur along the way but far less in terms of numbers of them due to the fact that this is not a bear market, but a correction.
Watch for strong resistance at 1847 on the S&P 500.
Mike Paulenoff, On Critical Resistance Should Contain Any Upside Follow-Through (MPTrader.com)
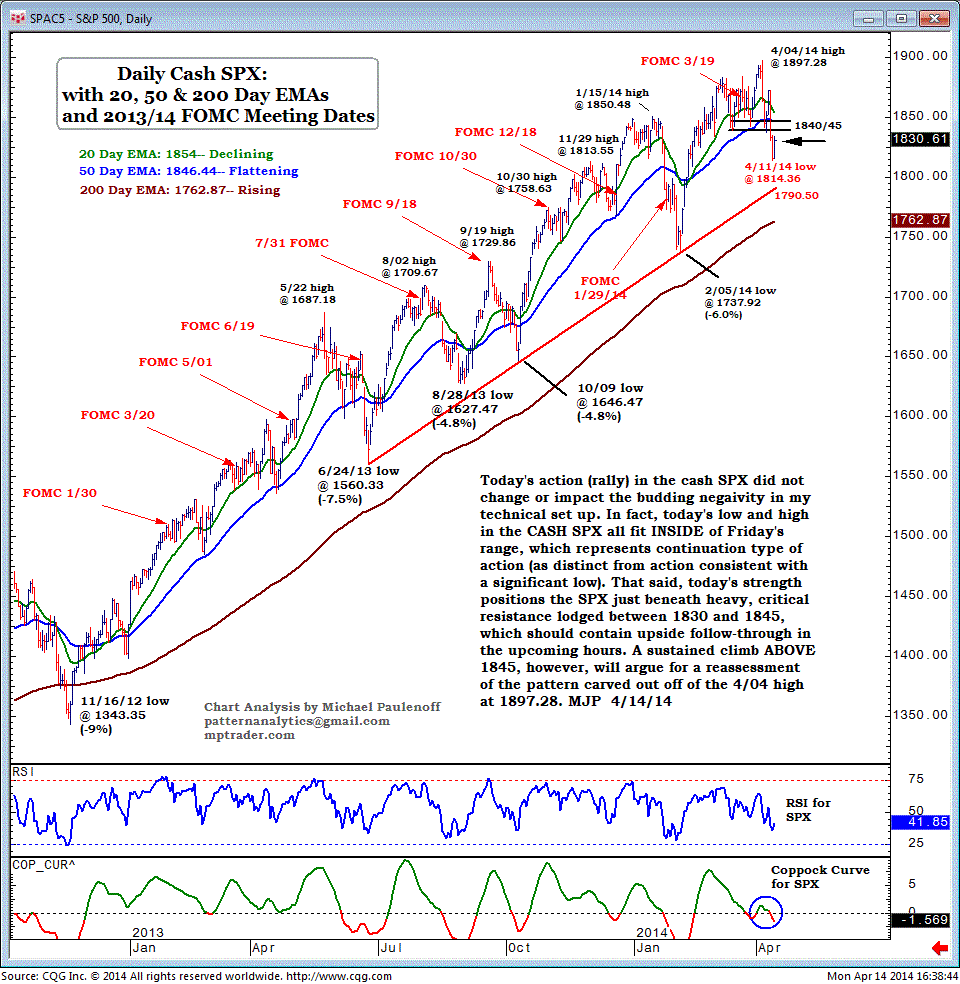
Monday's action (rally) in the S&P 500 did not change or impact the budding negativity in my technical set-up. In fact, Monday's low and high in the cash SPX all fit inside of Friday's range, which represents a continuation type of action (as distinct from action consistent with a significant low).
That said, Monday's strength positions the SPX just beneath heavy, critical resistance lodged between 1830 and 1845, which should contain upside follow-through in the upcoming hours.
A sustained climb above 1845, however, will argue for a reassessment of the pattern carved out off of the April 4 high at 1897.28.
Garrett Patten, On We Got Our Bounce ... Now What? (ElliottWaveTrader.net)
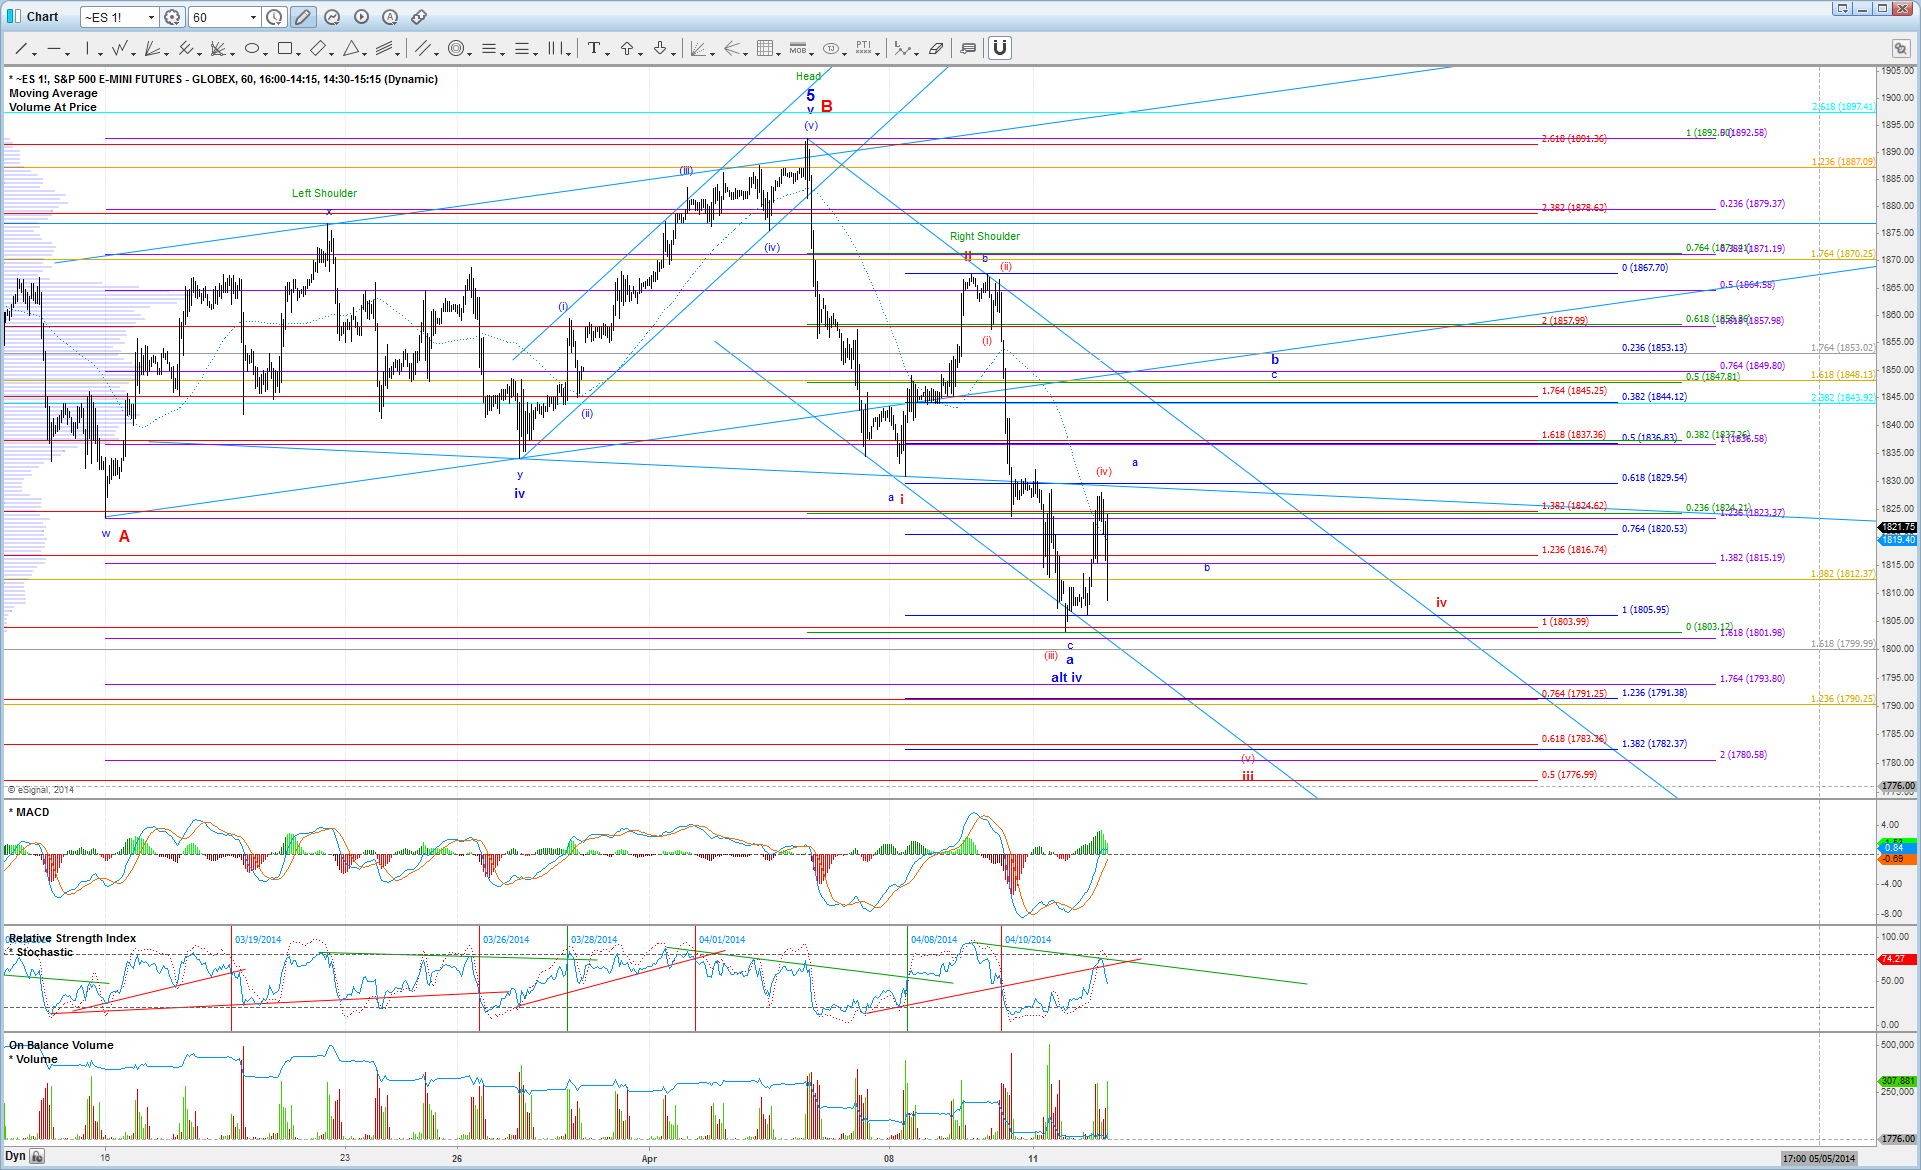
After spiking slightly below the 1806 target that we had been watching on Sunday night, the ES managed to stage a nice bounce today that took price almost back to the 1829.50 resistance that was cited this morning (came 1.50 shy of the target). From there, price turned back down and started to melt lower into the afternoon, but only gave us what looks like a micro 3 waves off the high.
Because the ES did not take advantage of the setup to head to a new low in wave (v) of iii of the red count (unless we are dealing with an ending diagonal), the blue count has proved to have a slight advantage here. Under the blue count, price would be in the beginning stages of a b-wave bounce that should see 1837 at a minimum, and potentially as high as 1858. However, as is typical with b-waves, the manner in which price reaches those levels is likely to be very choppy and difficult to trade, so a bit of discrimination and use of tight stops is advised when looking for scalp setups (today was a perfect example with the spike down and reversal in the afternoon).
Immediate resistance above is still 1829.50, which if price stays below can keep the red count alive. I would even be willing to give the red wave (iv) up to 1833.50, but above there and it is pretty much dead. That would turn our focus solely on the blue count, and we can then look for a clear corrective move into the 1837 - 1858 target for the next short setup. For now, I will not be expecting new all-time highs from here unless I get a clear impulsive structure out of this bounce.
Harry Boxer, On Charts to Watch for Tuesday (TheTechTrader.com)
Right now we're very cautious about the market, and so we'll take a look at some shorts in addition to our longs.
On the long side, the ProShares UltraShort Nasdaq Biotech (BIS) has done very well for us. Since it broke out late March, it pulled back, popped, and pulled back, each time holding the trendline and the 20-day. The last two days it continued to move up, and on Monday, it reached its target zone up around 21.70, and then backed off again. It's at resistance, but if it gets through here, look for a move up towards 23 1/2-24, which is the target for this stock.
Goodrich Petroleum Corp. (GDP) had a big day on Monday, exploding 5.56, or 30%, on 12.4 million shares. It certainly had a great session. Look for it to make a move up towards the 28-29 zone short term.
On the short side, Barrett Business Services Inc. (BBSI), one of our swing trades, is on the Boxer Shorts list. After the little flag that formed in the mid 70s rolled over, it bounced, and formed another little consolidation, and then broke down. On Monday, it was down another 1.09, or 2%, on low volume. It looks like this stock has more designs to the downside.
DexCom, Inc. (DXCM) has a toppy-looking pattern, or a little mini head-and-shoulders that broke down to the trendline on Friday, formed a bear flag, dropped lower, bounced to resistance, and then on Monday, it dropped another 33 cents. It looks like it may be headed down towards the high 20's.
Other stocks on Harry's Charts of the Day are Alcoa Inc. (AA), Callon Petroleum Company (CPE), CARBO Ceramics Inc. (CRR), First Solar, Inc. (FSLR), GasLog Ltd. (GLOG), Halc (HK), Hewlett-Packard Company (HPQ), Kodiak Oil & Gas Corp. (KOG), RadNet, Inc. (RDNT), and WebMD Health Corp. (WBMD).
Stocks on the short side include American Airlines Group Inc. (AAL), American Public Education, Inc. (APEI), 3D Systems Corp. (DDD), ITT Educational Services Inc. (ESI), Home Inns & Hotels Management Inc. (HMIN), Icahn Enterprises (IEP), ManpowerGroup Inc. (MAN), NeuStar, Inc. (NSR), Newell Rubbermaid Inc. (NWL), and The ExOne Company (XONE).
This Web site is published by AdviceTrade, Inc. AdviceTrade is a publisher and not registered as a securities broker-dealer or investment advisor either with the U.S. Securities and Exchange Commission or with any state securities authority. The information on this site has been obtained from sources considered reliable but we neither guarantee nor represent the completeness or accuracy of the information. In addition, this information and the opinions expressed are subject to change without notice. Neither AdviceTrade nor its principals own shares of, or have received compensation by, any company covered or any fund that appears on this site. The information on this site should not be relied upon for purposes of transacting securities or other investments, nor should it be construed as an offer or solicitation of an offer to sell or buy any security. AdviceTrade does not assess, verify or guarantee the suitability or profitability of any particular investment. You bear responsibility for your own investment research and decisions and should seek the advice of a qualified securities professional before making any investment.
Recommended Content
Editors’ Picks
EUR/USD holds gains near 1.0650 amid risk reset

EUR/USD is holding onto its recovery mode near 1.0650 in European trading on Friday. A recovery in risk sentiment is helping the pair, as the safe-haven US Dollar pares gains. Earlier today, reports of an Israeli strike inside Iran spooked markets.
GBP/USD recovers toward 1.2450 after UK Retail Sales data

GBP/USD is rebounding toward 1.2450 in early Europe on Friday, having tested 1.2400 after the UK Retail Sales volumes stagnated again in March, The pair recovers in tandem with risk sentiment, as traders take account of the likely Israel's missile strikes on Iran.
Gold price defends gains below $2,400 as geopolitical risks linger

Gold price is trading below $2,400 in European trading on Friday, holding its retreat from a fresh five-day high of $2,418. Despite the pullback, Gold price remains on track to book the fifth weekly gain in a row, supported by lingering Middle East geopolitical risks.
Bitcoin Weekly Forecast: BTC post-halving rally could be partially priced in Premium

Bitcoin price shows no signs of directional bias while it holds above $60,000. The fourth BTC halving is partially priced in, according to Deutsche Bank’s research.
Geopolitics once again take centre stage, as UK Retail Sales wither

Nearly a week to the day when Iran sent drones and missiles into Israel, Israel has retaliated and sent a missile into Iran. The initial reports caused a large uptick in the oil price.

