Jack Steiman, On Ominous Market for Bulls (SwingTradeOnline.com)
The market looked promising with futures up on Sunday night, but that quickly eroded overnight as Germany was down huge. U.S. equities gapped down, but immediately filled those gaps. After a small rush into the green, or flat, depending on the index, the market started to fall again. This time it fell with force, with all the indexes falling below the 50's at the same time for the first time.
Of course, we bounced some, allowing the S&P 500 to close just 2 points below, while the Dow closed a few points above. Still no close with force below the 50's on either index, which is rather amazing when you consider some of the carnage we've seen on the Nasdaq froth stocks. Some of them were down over 40% in just six weeks. If you've chased those stocks you know the pain all too well.
So, the bears once again failed to accomplish what they will need to, but Monday was the third test of those key 50-day exponential moving averages. They're slowly working on the bulls here, but have yet to do what they will ultimately need to do. When will they get it done? Who knows, but the odds are increasing quite a bit here. It's do or die time for both sides.
The Nasdaq has fallen nearly 300 points off the top, and there is still not one open gap down unfilled. That is stunning. Bull markets find ways to unwind without creating too much technical damage, so when it's likely to blast back up down the road there won't be too many head winds other than moving averages. They are tough resistance, but nothing is tougher than those wide open gaps. Small gaps are headaches enough, but when you get huge open gaps, and multiple ones at that, the journey back higher is very tough. So far there's not a single one, and we're down nearly 7% off the top.
The Nasdaq went green Monday intraday, and thus the day's gap was closed even though the gap down was strong. The bears still have to get that open gap in their arsenal if they're to feel really good about creating the type of technical damage that can take this market down a long way from here. Maybe in the next few days they'll accomplish it. The reason it may take a little time is because we're oversold on the short-term 60-minute charts. It's always possible we'll stay oversold, but that didn't work today with regards to the gap. It worked with price, but not with the gap as the final bell rung.
When markets fall, the key element to watch is how volume reacts to that selling. Volume has been increasing as we work our way towards removing those key 50's. Going lower on light volume is not bearish. But if you do so with higher volume than the recent buying volume, it becomes clearer that the tide is turning for this market.
Volume is ominous for the bulls here. Once the 50's go away on the S&P 500 and Dow the bears will become braver. I expect the volume to stay on the heavy side, which causes damage technically. If the bears want the knockout, then they need that volume day with a huge gap down and a run that doesn't come back. Then the nail is driven deep into that bullish coffin, and it's lights out for some time.
Things do not look good for the bulls here. Even if we bounce here, it's not a positive for the short-term. The bulls would need a huge gap up and run. To be blunt, that's unlikely, but you never count the bulls out until those 50's are gone on the S&P 500 and Dow. 4070 Nasdaq gap is next support. 4000 after that. On the S&P 500, it's 1848 and then 1800. One day at a time here folks. The bears still haven't gotten the job done until those 50's are gone with force on the S&P 500 and Dow.
Garrett Patten, On Another Victory for Bears (ElliottWaveTrader.net)
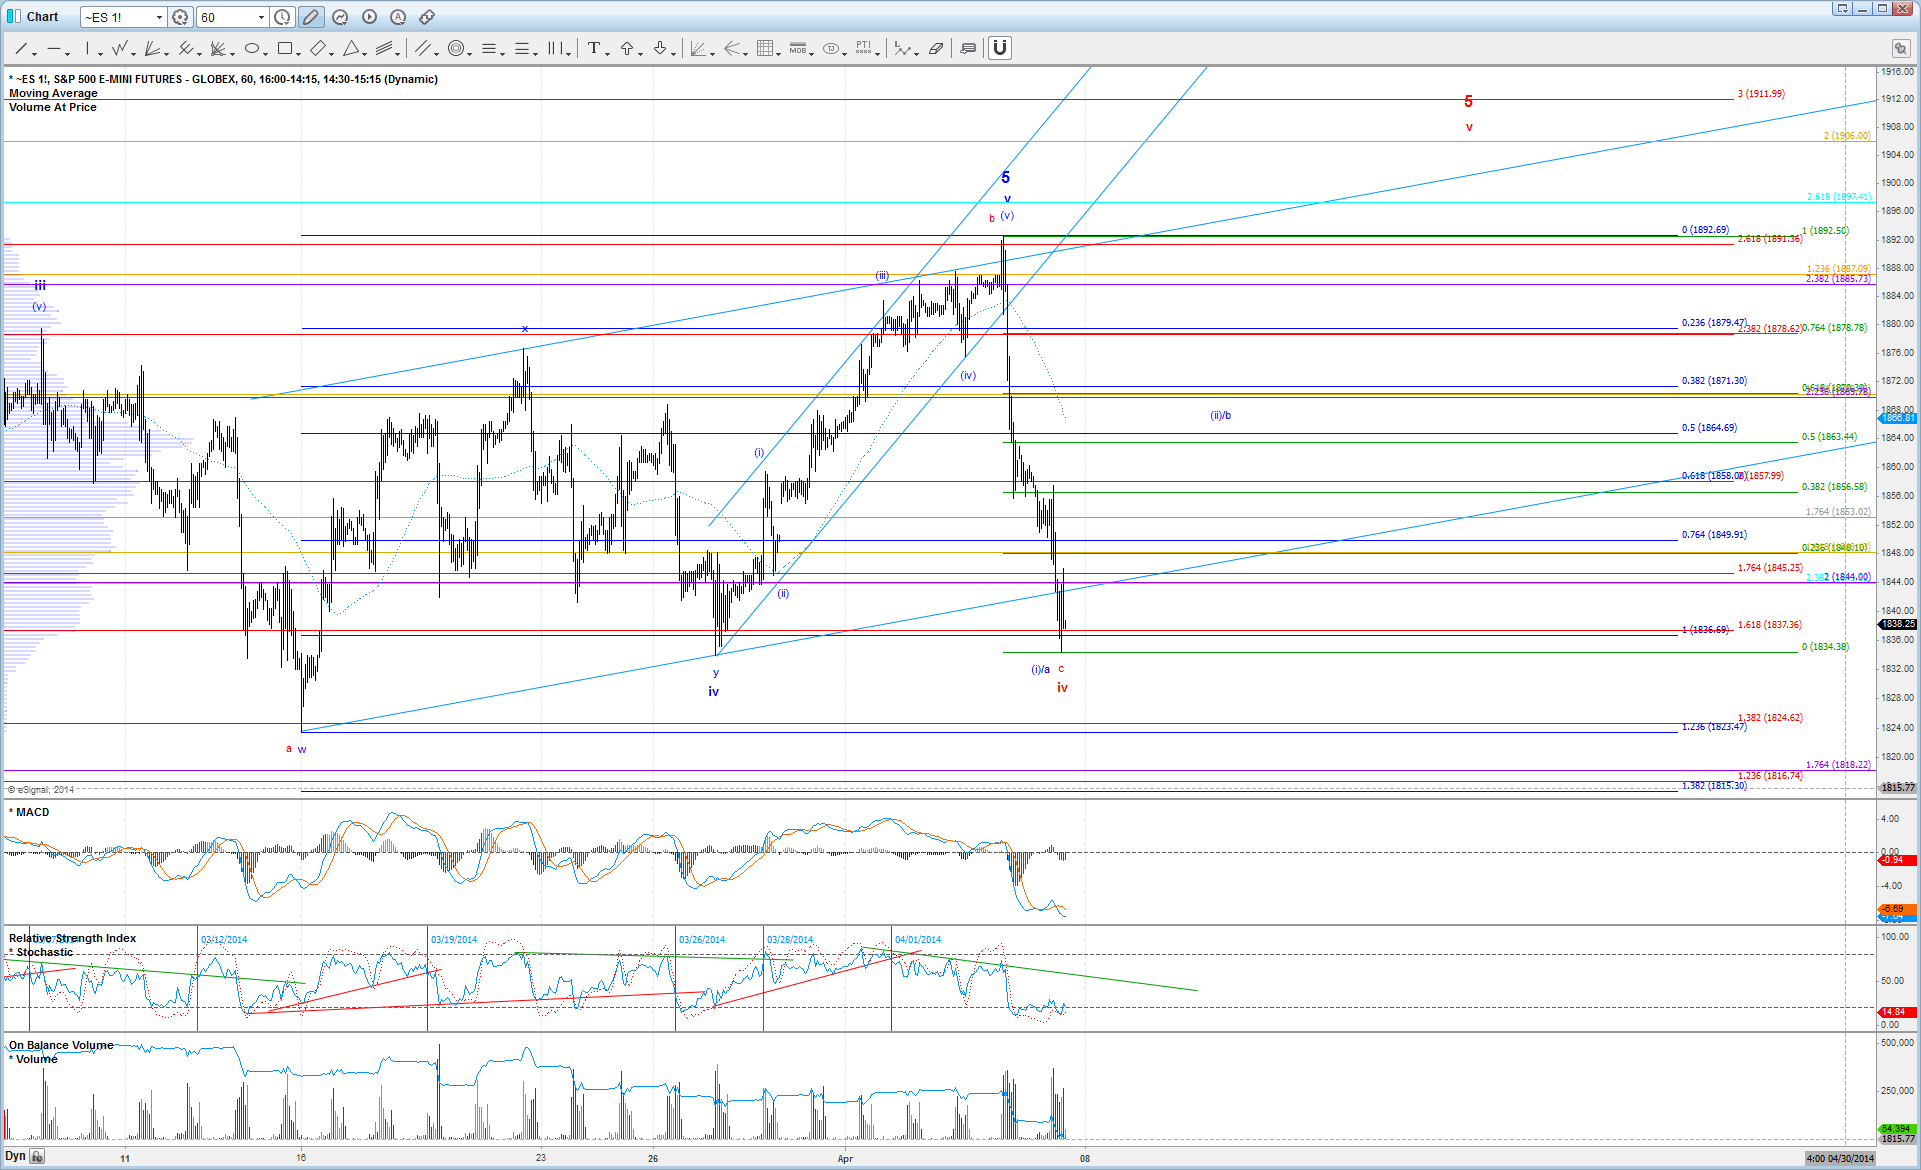
Monday's price action in the ES and further extension down from the Friday high was another "victory" you could say for the bears, primarily because it knocked one more potential bullish count off the table. At this point, I really only see one potential bullish count left that can still take price to a new ATH in the coming weeks.
For this potential bullish scenario, which is shown on my chart in red, price would be close to completing a c-wave down of an expanded flat that began from the 3/7 high, making Friday's high the top of a b-wave. If this c-wave is not already complete, it should find support between here and 1824 ideally. However, in order to have any faith in seeing it play out, we must see an impulsive bounce off the next low, in which case you may attempt a long on a corrective pullback. No need to try and bottom tick here.
Alternatively, if we do have a more lasting top in place, and wave 5 is complete as suggested by the blue count, then I believe that price should be close to completing a wave (i) or wave a off the high, and we should see a corrective bounce soon in wave (ii) or b. Ideally, such a bounce would take price back to 1864 - 1878, which would setup a nice head & shoulders pattern to support lower levels after the corrective bounce completes.
In summary, I think it is more likely to see a bounce soon here, rather than an acceleration further from here, but the latter is not impossible, so please have a plan ready in the event that does happen. The key, if we do bounce, will be determining whether the price structure is impulsive or corrective off the low. That should tell us whether the next swing trade is going to be on the long side, or short side.
Mike Paulenoff, On Support Levels to Watch on the SPY (MPTrader.com)
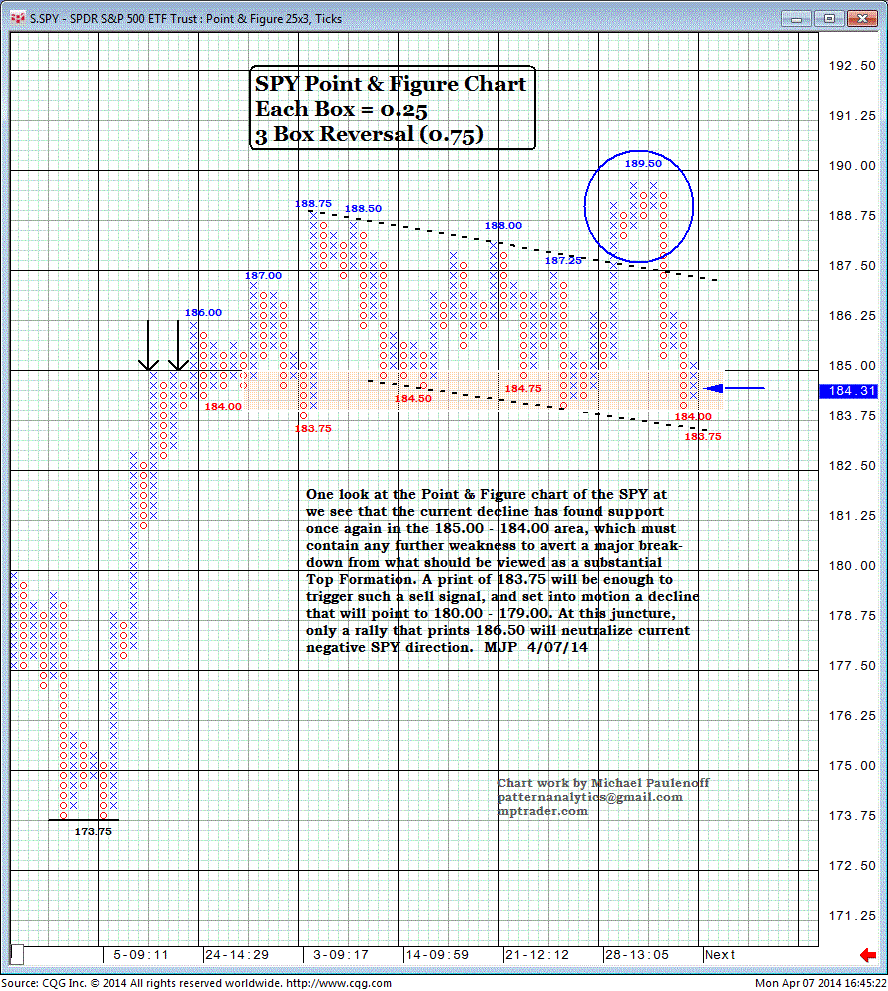
One look at the point-and-figure chart of the SPY and we see that the current decline has found support once again in the 185.00-184.00 area. This must contain any further weakness to avert a major breakdown from what should be viewed as a substantial top formation.
A print of 183.75 in the SPY will be enough to trigger such a sell signal and set into motion a decline that will point to 180.00-179.00.
At this juncture, only a rally that prints 186.50 will neutralize current negative SPY direction.
Harry Boxer, On Charts to Watch for Tuesday (TheTechTrader.com)
Another ugly day on Wall Street on Monday, and a bad way to start the week. There was a late bounce, and then a pullback, but futures were also up slightly on Monday evening so you never can be sure what's going to happen next. For now, we'll go over both longs and shorts here.
Agios Pharmaceuticals, Inc. (AGIO) was really strong on Friday, reversing from 32, and then on Monday, it jumped as high as 46, which was our first target. It backed off to 45.35, and closed up 9.87, or 28%, on 2.7 million shares. That's the biggest day this stock has had in a very long time. The long-term pattern indicates a possibility of this stock getting up into the mid 50's.
Select Medical Holdings Corporation (SEM) broke out on Monday and ran 54 cents, or nearly 5%, on 1.4 million shares. That's the biggest volume on an up-day since Jan. There's a long-term trend forming, and if this is to be the channel, there could be a substantial run-up to near 16.
Stocks on the Short Side....
Bed Bath & Beyond Inc. (BBBY), which formed a 3-wave corrective bull-wedge after the big break-away gap to the downside, and a long decline, recovered on Thursday and Friday. On Monday, it rolled over hard, down another 1.85, and looks like that if it can take out 67, it could get down into the 64, and then the 61 range. Those are the targets.
NetSuite Inc. (N) had a big topping pattern, and then a massive crack, although it did trendline here. It wouldn't be wise to be too aggressive here until we see whether it rallies back up toward 88-90 zone. It has had a 5-wave decline, so there may be a 3-wave corrective move back up. We'll know in a day or so.
Other stocks on Harry's Charts of the Day are Agios Pharmaceuticals, Inc. (AGIO), Neuralstem, Inc. (CUR), Direxion Daily Financial Bear 3X Shares (FAZ), IsoRay, Inc. (ISR), Petr (PBR), RadNet, Inc. (RDNT), Select Medical Holdings Corporation (SEM), iShares Russell 2000 (IWM), Direxion Daily Small Cap Bear 3X Shares (TZA), and Vertex Energy, Inc. (VTNR).
Stocks on the short side include Alcoa Inc. (AA), Barrett Business Services Inc. (BBSI), CME Group Inc. (CME), 3D Systems Corp. (DDD), ITT Educational Services Inc. (ESI), First Cash Financial Services Inc. (FCFS), Chart Industries Inc. (GTLS), Icahn Enterprises (IEP), NeuStar, Inc. (NSR), and The ExOne Company (XONE).
Sinisa Persich, On Free Stock Picks for Tuesday (TraderHR.com)
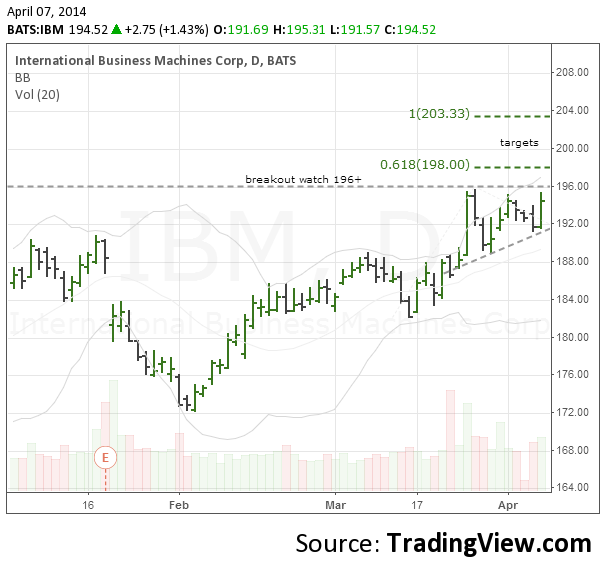
Keep an eye on IBM (IBM) for a breakout on a move able 196. First target is 198, and then 203.33.
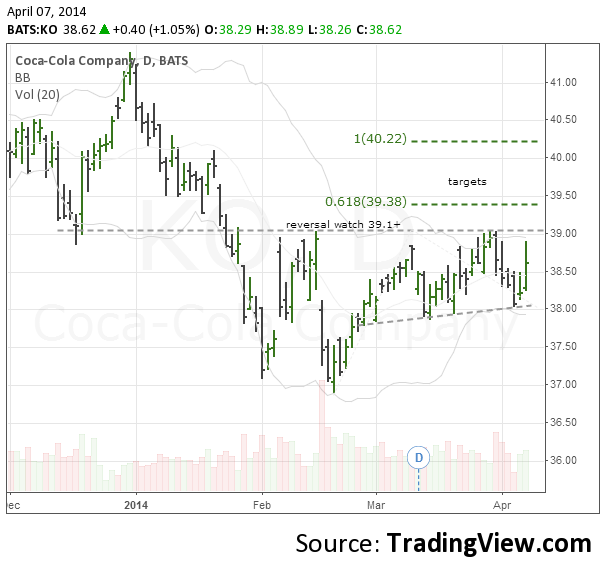
Watching for a couple possible reversals of downtrends, first on The Coca-Cola Company (KO) on a break of 39.10, with a target of 39.38 and then 40.22.
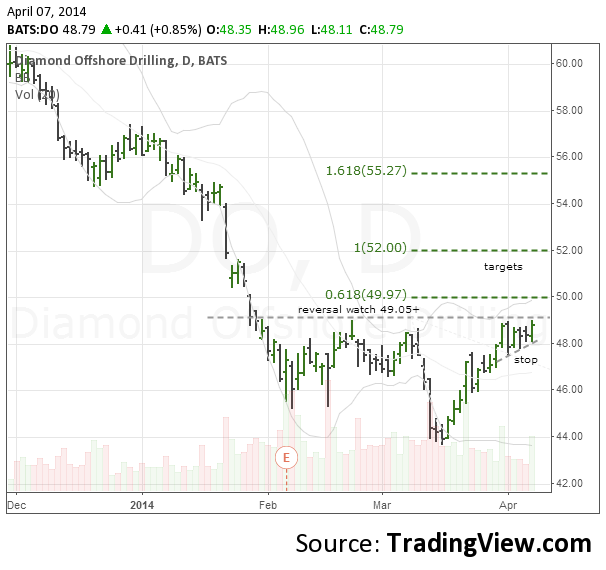
Next would be Diamond Offshore Drilling (DO) on a break above 49.05. First target 52 and then 55 1/4.
This Web site is published by AdviceTrade, Inc. AdviceTrade is a publisher and not registered as a securities broker-dealer or investment advisor either with the U.S. Securities and Exchange Commission or with any state securities authority. The information on this site has been obtained from sources considered reliable but we neither guarantee nor represent the completeness or accuracy of the information. In addition, this information and the opinions expressed are subject to change without notice. Neither AdviceTrade nor its principals own shares of, or have received compensation by, any company covered or any fund that appears on this site. The information on this site should not be relied upon for purposes of transacting securities or other investments, nor should it be construed as an offer or solicitation of an offer to sell or buy any security. AdviceTrade does not assess, verify or guarantee the suitability or profitability of any particular investment. You bear responsibility for your own investment research and decisions and should seek the advice of a qualified securities professional before making any investment.
Recommended Content
Editors’ Picks
AUD/USD hovers around 0.6500 amid light trading, ahead of US GDP

AUD/USD is trading close to 0.6500 in Asian trading on Thursday, lacking a clear directional impetus amid an Anzac Day holiday in Australia. Meanwhile, traders stay cautious due ti risk-aversion and ahead of the key US Q1 GDP release.
USD/JPY finds its highest bids since 1990, near 155.50

USD/JPY keeps breaking into its highest chart territory since June of 1990 early Thursday, testing 155.50 for the first time in 34 years as the Japanese Yen remains vulnerable, despite looming Japanese intervention risks. Focus shifts to Thursday's US GDP report and the BoJ decision on Friday.
Gold price lacks firm intraday direction, holds steady above $2,300 ahead of US data

Gold price remains confined in a narrow band for the second straight day on Thursday. Reduced Fed rate cut bets and a positive risk tone cap the upside for the commodity. Traders now await key US macro data before positioning for the near-term trajectory.
Injective price weakness persists despite over 5.9 million INJ tokens burned

Injective price is trading with a bearish bias, stuck in the lower section of the market range. The bearish outlook abounds despite the network's deflationary efforts to pump the price. Coupled with broader market gloom, INJ token’s doomed days may not be over yet.
Meta Platforms Earnings: META sinks 10% on lower Q2 revenue guidance Premium

This must be "opposites" week. While Doppelganger Tesla rode horrible misses on Tuesday to a double-digit rally, Meta Platforms produced impressive beats above Wall Street consensus after the close on Wednesday, only to watch the share price collapse by nearly 10%.
