Jack Steiman, On Not Overplaying the Market (SwingTradeOnline.com)
Monday was another day of the Q's (QQQ) closing below the open, and the SPDR S&P 500 (SPY) closing above. Not that the SPY was great, as it did come down off the top, but those froth Nasdaq stocks just can't get out of their own way. Stocks, such as Apple (AAPL), Priceline (PCLN), LinkedIn (LNKD) and Google Inc. (GOOG) were up huge early on and finished red.
However, if you live in the world of non-froth then you are surviving. Not thriving necessarily, but surely you're surviving. And to be truthful, that's about the best you can hope for now. Still no breakout above 1883 on the S&P 500, but it's trying to work on it. It's hard to imagine the S&P 500 breaking out in these market conditions, but you never know. I would think not, with the Nasdaq so underperforming, but we shall see.
Is Monday's market action indicative of a market trying to top out? Many would say yes due to the Nasdaq, but there's still no evidence. No black candle on the SPY. We all know it should fall, but thus far it hasn't. Maybe we wake up to a massive gap down soon, but where is it? Monday wasn't great again on the Nasdaq, but nothing devastating either. The market can correct internally without much overall price erosion, and for now the only selling we're seeing is in the land of froth while the daily charts unwind. If this continues for another month, or so, then the unwinding will be complete.
Again, it's hard to imagine, but so far the bulls have had their way with things as rotation is protecting the bigger market picture, while the undeserving get their day in the rain. The market is telling us to stick with the lower P/E stocks for now, and, thus, we shall do that. There will be a time again for froth, but it's apparently not here now. That said, there's nothing good about those MACD's right here even on the non-froth indexes like the S&P 500 and Dow. It says all of us should respect the message and get on with our lives away from over-playing anything. Keep things very light folks!
In the end, it really is all about the S&P 500 clearing back above the old double top at 1883. Until it does, or until it loses the 50-day exponential moving average, were still in the noise zone. That level being 1841. Noise can be lethal to your port if you over play.
Avi Gilburt, On Still Not Bullish Yet (ElliottWaveTrader.net)
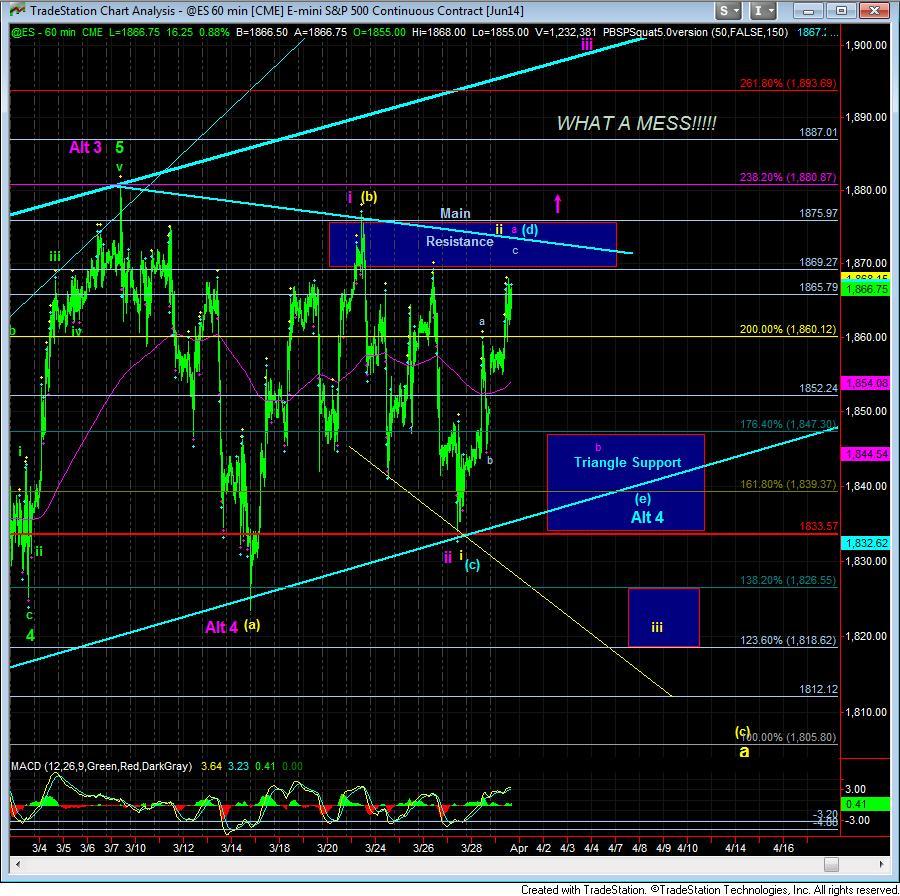
Even with the rally Monday to invalidate the red count we mentioned over the weekend, there is still not a good impulsive pattern off the lows that suggests that the market is heading appreciably higher.
Rather, on Monday it seems that the market was completing a c-wave up off of Friday's b-wave bottom. As I write this at almost 3:30, it looks as though the market is now in a 4th wave in this c-wave, which means that we should see one more push higher before the market reacts towards the downside again.
Even in the most bullish count I can see on the chart, this would only be an a-wave in the purple wave iii perspective, which should still take us down towards the purple b on the 60 minute chart. This is also the noted support zone for the triangle count as well. Furthermore, due to how high we have come, I have also re-labeled the yellow count, which would suggest a much larger ending diagonal taking us well into April before it completes.
But, the important thing to note about all these perspectives is how important the blue support box below is for the market to set up to head higher sooner rather than later. In fact, its inability to maintain over 1833ES on the next drop could be a very bearish indication.
So, as the market sets up for its next expected leg lower, we will be on the lookout for a 5 wave rally once the blue box for the triangle support region is met. If we should see such a 5 wave structure off that support region, that will be the signal for a long trade to take us towards the 1900 region, and potentially beyond. However, should that region not hold as support, it would not surprise me to see a 17 handle once that region is breached.
Mike Paulenoff, On Divergence between S&P and Nasdaq (MPTrader.com)
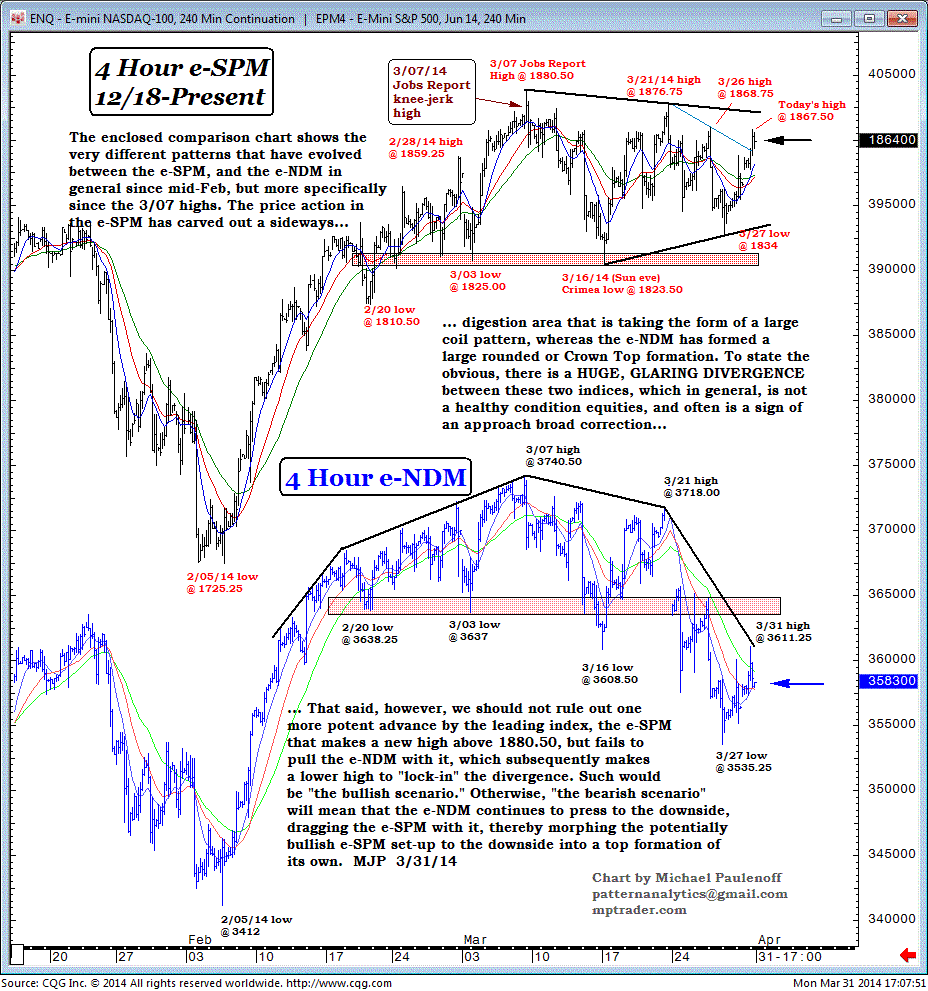
Very different patterns have evolved between the S&P 500 and Nasdaq 100, especially since the March 7 highs.
The price action the Emini S&P 500 (e-SPM) has carved out is a sideways digestion area that is taking the form of a large coil pattern, where the Emini Nasdaq 100 (e-NDM) has formed a larger rounded Crown Top formation.
To state the obvious, there is a huge, glaring divergence between the two indices, which in general is not a healthy condition for equities and often is a sign of an approaching broad correction.
That said, however, we should not rule out one more potent advance by the leading index, the e-SPM, that makes a new high above 1880.50, but fails to pull the e-NDM with it, which subsequently makes a lower high to "lock-in" the divergence.
Such would be "the bullish scenario."
Otherwise, "the bearish scenario" will mean that the e-NDM continues to press to the downside, dragging the e-SPM with it, thereby morphing the potentially bullish e-SPM set-up to the downside into a top formation of its own.
Harry Boxer, On Charts to Watch for Tuesday (TheTechTrader.com)
The following are our Charts of the Day for Tuesday:
AA, BIOF, CORT, ENOC, GPRE, HPJ, INVN, IQNT, KERX, PESI, PLUG, PVA, RTRX, SNMX, VIMC, VNET, VTNR, WATT.
Sinisa Persich, On Free Stock Pick for Tuesday (TraderHR.com)
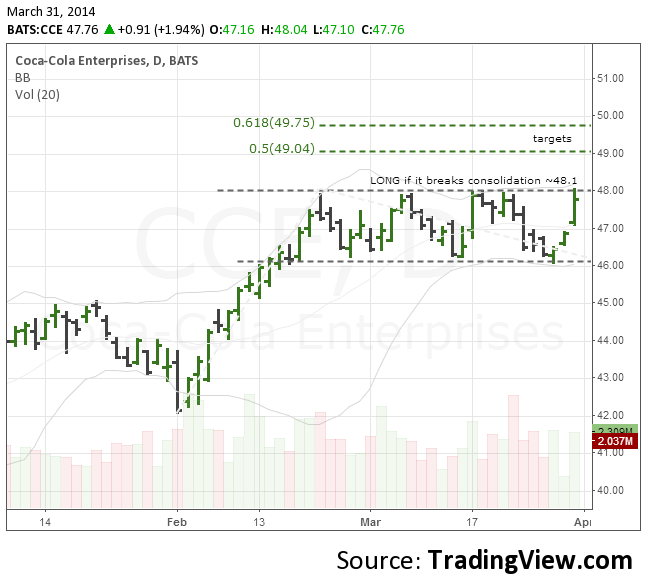
We're watching Coca-Cola Enterprises Inc. (CCE) for a possible breakout from its current rectangle, consolidation pattern, with 48.10 the breakout point and 49.04 and 49.75 the targets.
This Web site is published by AdviceTrade, Inc. AdviceTrade is a publisher and not registered as a securities broker-dealer or investment advisor either with the U.S. Securities and Exchange Commission or with any state securities authority. The information on this site has been obtained from sources considered reliable but we neither guarantee nor represent the completeness or accuracy of the information. In addition, this information and the opinions expressed are subject to change without notice. Neither AdviceTrade nor its principals own shares of, or have received compensation by, any company covered or any fund that appears on this site. The information on this site should not be relied upon for purposes of transacting securities or other investments, nor should it be construed as an offer or solicitation of an offer to sell or buy any security. AdviceTrade does not assess, verify or guarantee the suitability or profitability of any particular investment. You bear responsibility for your own investment research and decisions and should seek the advice of a qualified securities professional before making any investment.
Recommended Content
Editors’ Picks
EUR/USD clings to daily gains above 1.0650

EUR/USD gained traction and turned positive on the day above 1.0650. The improvement seen in risk mood following the earlier flight to safety weighs on the US Dollar ahead of the weekend and helps the pair push higher.
GBP/USD recovers toward 1.2450 after UK Retail Sales data

GBP/USD reversed its direction and advanced to the 1.2450 area after touching a fresh multi-month low below 1.2400 in the Asian session. The positive shift seen in risk mood on easing fears over a deepening Iran-Israel conflict supports the pair.
Gold holds steady at around $2,380 following earlier spike

Gold stabilized near $2,380 after spiking above $2,400 with the immediate reaction to reports of Israel striking Iran. Meanwhile, the pullback seen in the US Treasury bond yields helps XAU/USD hold its ground.
Bitcoin Weekly Forecast: BTC post-halving rally could be partially priced in Premium

Bitcoin price shows no signs of directional bias while it holds above $60,000. The fourth BTC halving is partially priced in, according to Deutsche Bank’s research.
Week ahead – US GDP and BoJ decision on top of next week’s agenda

US GDP, core PCE and PMIs the next tests for the Dollar. Investors await BoJ for guidance about next rate hike. EU and UK PMIs, as well as Australian CPIs also on tap.


