Jack Steiman, On Bear Market for Froth Stocks Only (SwingTradeOnline.com)
The bears once again seized on froth on Monday, but failed to seize on the entire market. The Nasdaq was down 80-plus points intraday, but managed to recover some of those losses. The action on the Dow and S&P 500 was quite benign for now.
There are two markets under way here. There's all that isn't froth, and those stocks are holding up quite well, while froth gets hit day after day without mercy. There are some oversold bounces along the way, but the froth stocks are taking a real beating.
Most of them are in bear territory as defined by the market, which is a 20% move down off the highs. Some as much as 40%. It has been a very bad time for those chasing a dream, while those who are more patient are hopeful for what's to come once this correction ends. The key is whether the whole market will fall as one sooner than later. It would be healthier if it did, but that's still very unclear. The indexes keep playing with all types of moving averages. They go below and then back above, and then close at the close of trading.
No real breaks either way. Breaches, sure, but no real convincing with force break downs. It's confusing why the whole market doesn't dive down. But you never argue with what's taking place. You go with it, and for now there is some unwinding going on within those daily charts and that's a good thing for the bigger picture. Maybe once those froth stocks are done correcting the rest of the market will join in on the fun.
I keep searching throughout all the oscillators, and then some, to discover if I can predict when and if things will get really nasty. There really isn't much in that direction. If you study the daily Nasdaq chart, the MACD is not too far from the zero line now. When you get to that level from way above you often stop selling there. It doesn't have to, and can keep selling for sure, but we haven't lost too much at all with that unwinding back to 0.
Again, it's only been the froth stocks. The weekly charts say much more selling should take place, but the weekly charts are not the in-the-moment charts, and thus timing them is nearly impossible. We try to use the daily charts for that discovery. It's interesting that the Nasdaq, with its deeper unwinding, is actually starting to look a little better than the S&P 500 or Dow because those two sectors having sold enough, and thus their MACD's don't look as good.
So the market continues to meander. Flat for the year for the most part when you average things out. The market environment remains difficult at best. It'll be interesting to see if the S&P 500 and Dow play a bit of catch up, but the market remains the same, meaning avoid froth and keep things light overall.
Avi Gilburt, On Will We See Further Downside Follow-Through? (ElliottWaveTrader.net)
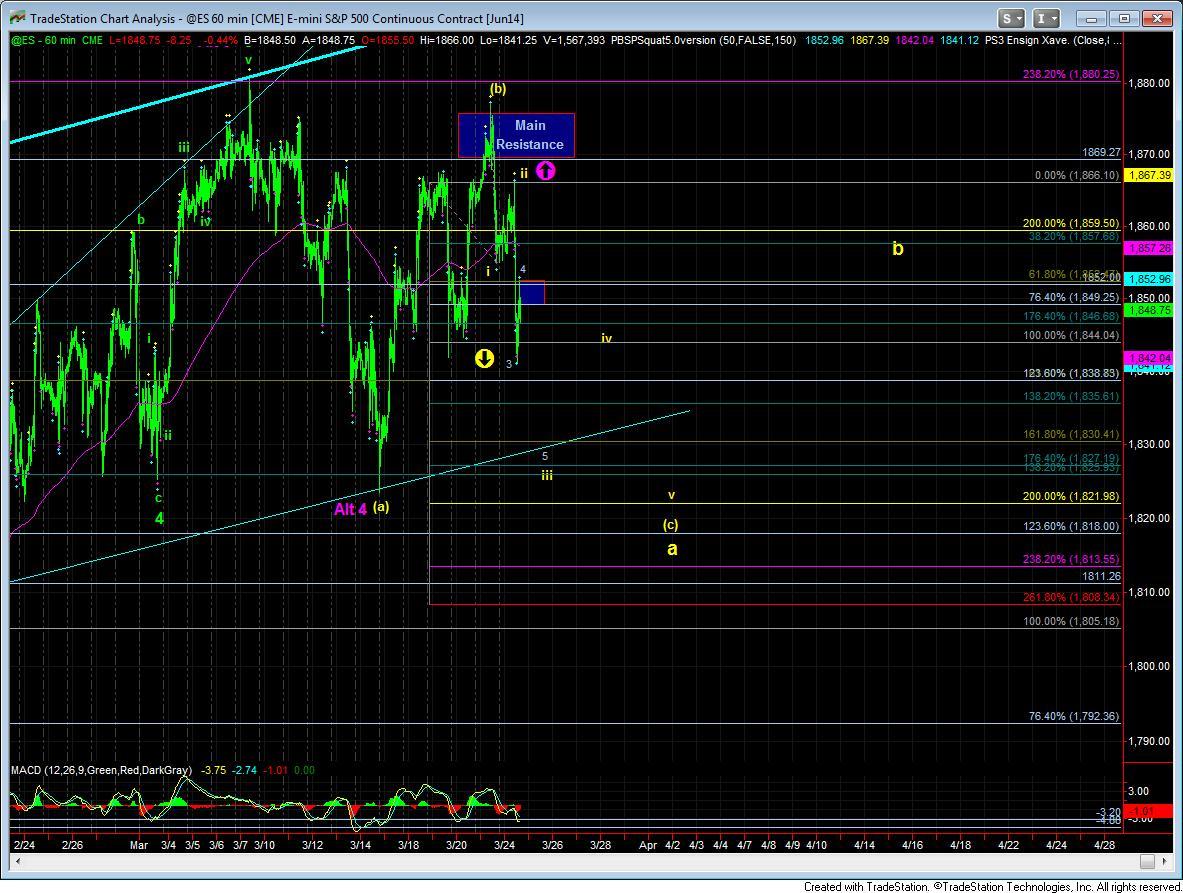
The market went a long way on Monday in validating the yellow count to the downside. It bottomed within the region it needed to bottom for a wave 3 of wave iii, and then rallied a bit higher than I would ideally want to see. Normally, on such a drop approaching the 1.236 extension, it usually holds below the .764 extension, but today we came right back to the .618 extension. Clearly, this does get me concerned about further downside follow through into tomorrow.
Our main resistance right now is the .618 extension down, in the 1853ES region. A strong move through that would tell me that the impulsive count taking us to the low 1800's will likely invalidate. But, if we can maintain below that level, our next targets below are the 1.382 extension at 1835ES, and, ideally, the 1.618 extension at 1831ES.
However, as I said before, a strong move through the 1853ES region would be our initial signal that the market wants to attack the prior highs and potentially take us to a new high this week, towards the 1900 region. So, again, the 1853ES region is an important pivot.
Harry Boxer, On Charts to Watch for Tuesday (TheTechTrader.com)
There's a lot of deterioration across the board, leading us to believe that if we don't stop the bleeding right here we could get a substantial sell-off, which is long overdue. There are still some stocks that look great, but we are going to go over some shorts here.
Amazon.com Inc. (AMZN) had developed a big uptrend, broke down, formed a 3-wave corrective rising wedge, and then rolled over the last four days. Monday's rollover actually crossed over and moved right underneath support. If it moves down much further, it may take a slap at 338 quickly, at which point the market might be oversold enough to get a nice bounce. The problem is, if it continues lower it could get down into the 315-20 area pretty quick.
First Cash Financial Services Inc. (FCFS) had been in a very big upmove for the last several months. It rolled over and collapsed down, and formed a large flag or a rising wedge on lousy technicals and low volume. Leg one is down, leg two is up, so expect leg three to be pretty ugly. At best, it will be in the 48-7 area. It may be a lot worse if it follows the channel down. We'll just have to wait and see what is going to happen next.
Chart Industries Inc. (GTLS), which we put out as a short on Monday, had a big drop down, followed by a wedge, which resulted in another drop. Then it formed a bear flag, had a little bounce back to resistance, and then in the last four or five sessions it's been moving down. The technicals look bad, and it looks like it starting to fall apart. The first target would have to be around the 72-74 zone, and if it continues to move down, it could get ugly in the low to mid 60's.
Hanger, Inc. (HGR) has an ugly top pattern. It formed a rising wedge after the top breakdown, and then broke out of the wedge to the downside for three more days now. It may test the line at 30, which is the next target.
Other on Harry's Charts of the Day are T2106, S&P 500, Celgene Corporation (CELG), Home Inns & Hotels Management Inc. (HMIN), Icahn Enterprises (IEP), International Game Technology (IGT), MarkWest Energy Partners (MWE), Nationstar Mortgage Holdings Inc. (NSM), Regional Management Corp (RM), TAL International Group, Inc. (TAL), and West Pharmaceutical Services (WST).
Mike Paulenoff, On Watching the SPX's 20 DMA (MPTrader.com)
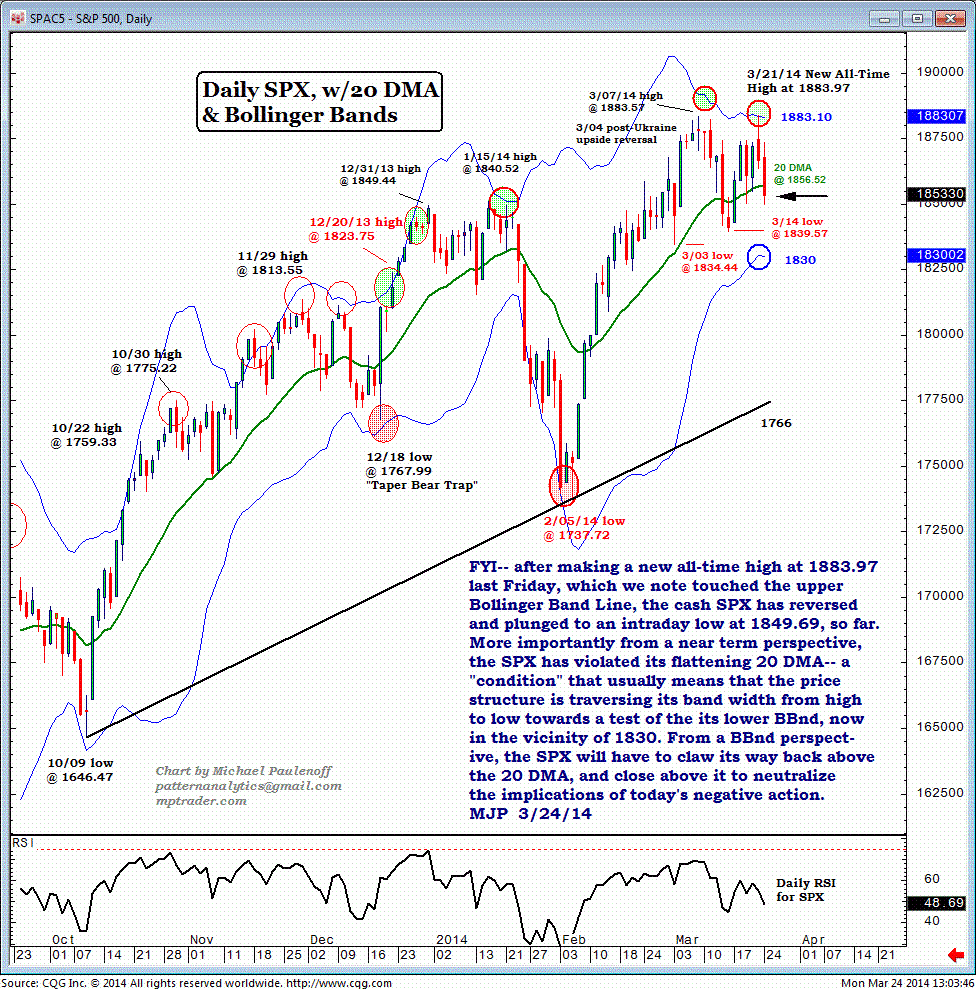
After a making a new all-time high at 1883.97 last Friday, which we note touched the upper Bollinger Band line, the cash SPX reversed and plunged below 1850 intraday on Monday.
More importantly, from a near-term perspective, the SPX has violated its flattening 20 DMA -- a "condition" that usually means that the price structure is traversing its band width from high to low towards a test of its lower BBnd, now in the vicinity of 1830.
From a BBnd perspective, the SPX will have to claw its way back above the 20 DMA, and close above it to neutralize the implications of Monday's negative action.
Sinisa Persich, On 4 Breakout Charts to Watch (TraderHR.com)
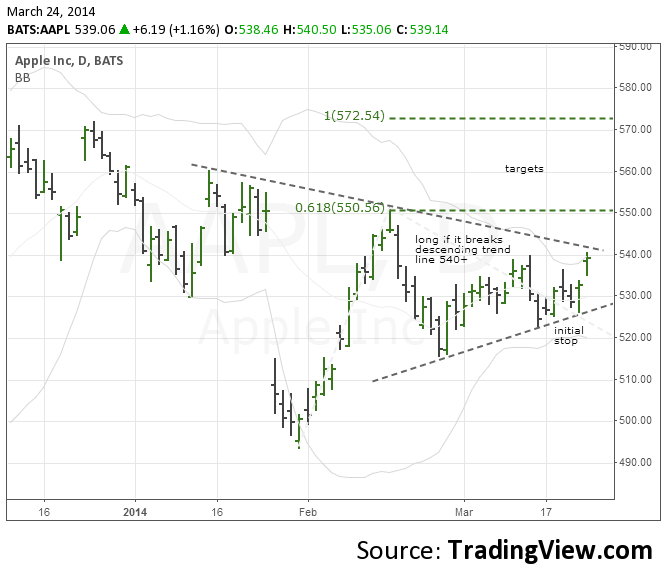
Apple (AAPL) is in a bullish symmetrical triangle. We want to be long the stock if it breaks the descending trend line above 540.
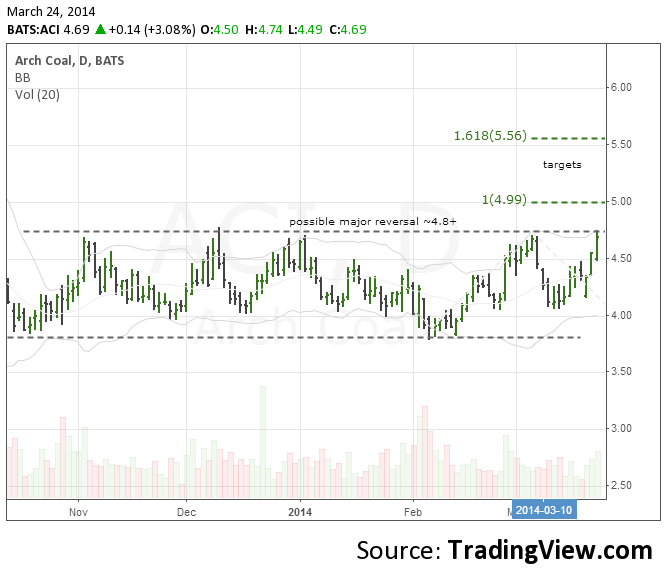
Arch Coal Inc. (ACI) is in a sideways rectangle pattern, basing after a major down-move from its early 2011 high. We're watching 4.80 as the breakout level that would signal a possible major trend reversal.
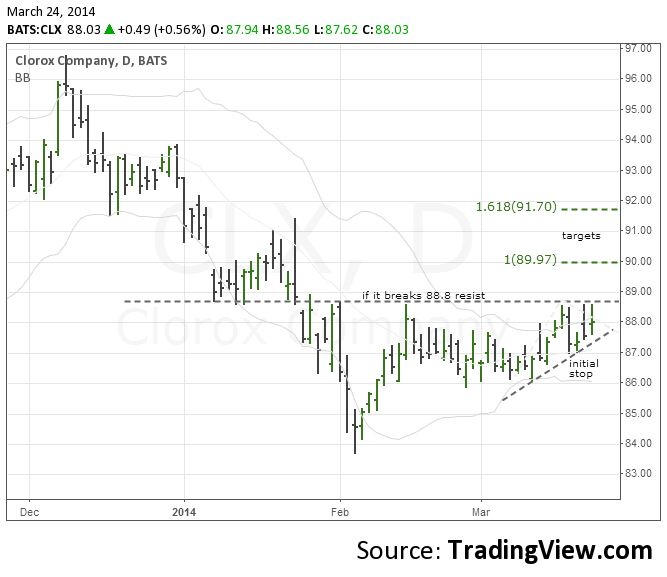
Clorox (CLX) is in a bullish wedge pattern, and a break above resistance at 88 could mean a move to 90 and then 91.70.
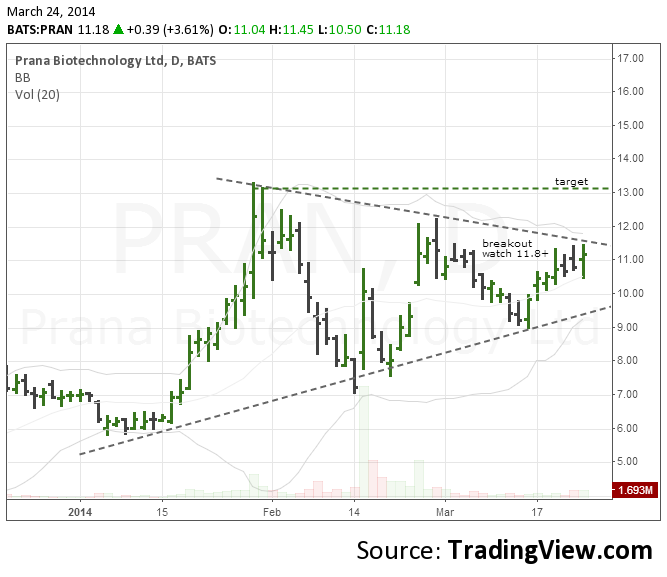
Prana Biotechnology (PRAN) is also in a symmetrical triangle, with 11.80 the breakout level to watch for a possible move above 13.
Recommended Content
Editors’ Picks
EUR/USD clings to daily gains above 1.0650

EUR/USD gained traction and turned positive on the day above 1.0650. The improvement seen in risk mood following the earlier flight to safety weighs on the US Dollar ahead of the weekend and helps the pair push higher.
GBP/USD recovers toward 1.2450 after UK Retail Sales data

GBP/USD reversed its direction and advanced to the 1.2450 area after touching a fresh multi-month low below 1.2400 in the Asian session. The positive shift seen in risk mood on easing fears over a deepening Iran-Israel conflict supports the pair.
Gold holds steady at around $2,380 following earlier spike

Gold stabilized near $2,380 after spiking above $2,400 with the immediate reaction to reports of Israel striking Iran. Meanwhile, the pullback seen in the US Treasury bond yields helps XAU/USD hold its ground.
Bitcoin Weekly Forecast: BTC post-halving rally could be partially priced in Premium

Bitcoin price shows no signs of directional bias while it holds above $60,000. The fourth BTC halving is partially priced in, according to Deutsche Bank’s research.
Week ahead – US GDP and BoJ decision on top of next week’s agenda

US GDP, core PCE and PMIs the next tests for the Dollar. Investors await BoJ for guidance about next rate hike. EU and UK PMIs, as well as Australian CPIs also on tap.
