Jack Steiman, On Forced Bull Still With Us (SwingTradeOnline.com)
The market started up by a hair this morning, only to see the futures fall apart just after the open. A real swoon lower took the S&P 500 down over 10 points quite rapidly. It looked bad as the 20-day exponential moving average was getting taken out with relative ease.
However, shortly thereafter, the 60-minute index charts got oversold with readings of 30 RSI, or lower, and back up we went. The indexes closed mixed with the Nasdaq down a hair, while the Dow and S&P 500 were up a hair. The bears let it get away from them as the rally allowed the indexes to all finish back above their 20-day exponential moving averages.
The S&P 500 losing the 20's would be huge for the bears, but once again a tail, and tails mean it won't be easy for those bears. Nothing will be easy for either side, but at least the bulls can feel better about rallying back above the lost 20's from earlier in the day. A nothing day when all was said and done.
So when is bad news good news? Once again, the rally seemed to coincide with bad news from the economic world. Housing permits dived lower. The stocks in that area were very hard hit to the down side.
That said, bad economic news equates to good news for rates staying on the very low side. The Fed's Yellen is not anxious to raise rates as long as the housing market and the economy overall are struggling. The forced bull is with us and not showing too much in terms of going away.
The GDP reports are poor. Housing is poor overall, with small pockets of good news, but again, overall, not very good. The Fed is going to need to see consistent good news from the housing market before she's overly anxious to start her rate raising cycle. Trying to understand when she'll raise is silly. She'll do it aggressively when the economy can stand tall without her help with low rates. Still bad overall economic news leading the lower rate cycle.
Bottom line, it's all about losing the 20- and then the 50-day exponential moving averages on all the major index daily charts. Until that moment occurs, meaning losing the 20's, you shouldn't even think about shorting for the most part if at all. Do what feels right to you, of course. And once we lose the 20's, things don't truly turn bearish until we lose the 50's.
On the S&P 500 the 20's are at 1972, while the 50's are at 1949. We have to lose 1949 with force and volume to get legitimately bearish. On the Nasdaq the 20's and 50's are at 4422 and 4353, respectively.
When 4353 is in the rear view mirror the bears can celebrate. Losing it on big volume would be more confirming. You can play long, but safest is playing lower-beta, lower-froth stocks. You know the drill. Froth is the big headache that can take this market down without provocation.
Avi Gilburt, On Downside Set-Up in Place (ElliottWaveTrader.net)
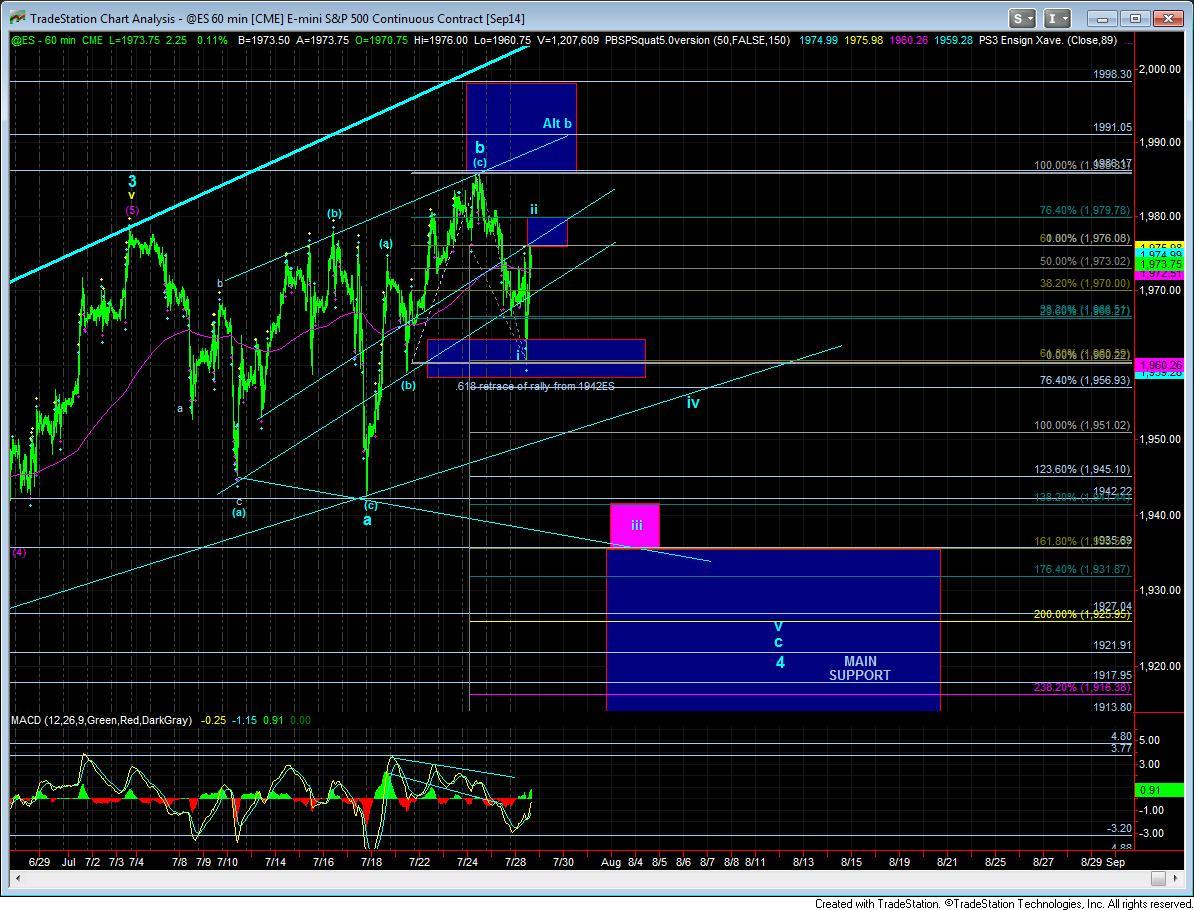
We have seen this play out many times before. We have a 1-2 set up to the downside, only to see the ES somehow invalidate that set up. And, today, we have that set up in place yet again. One of these days, the market is going to give us a 20+ point gap down and it will surprise market participants. Will tomorrow be that day?
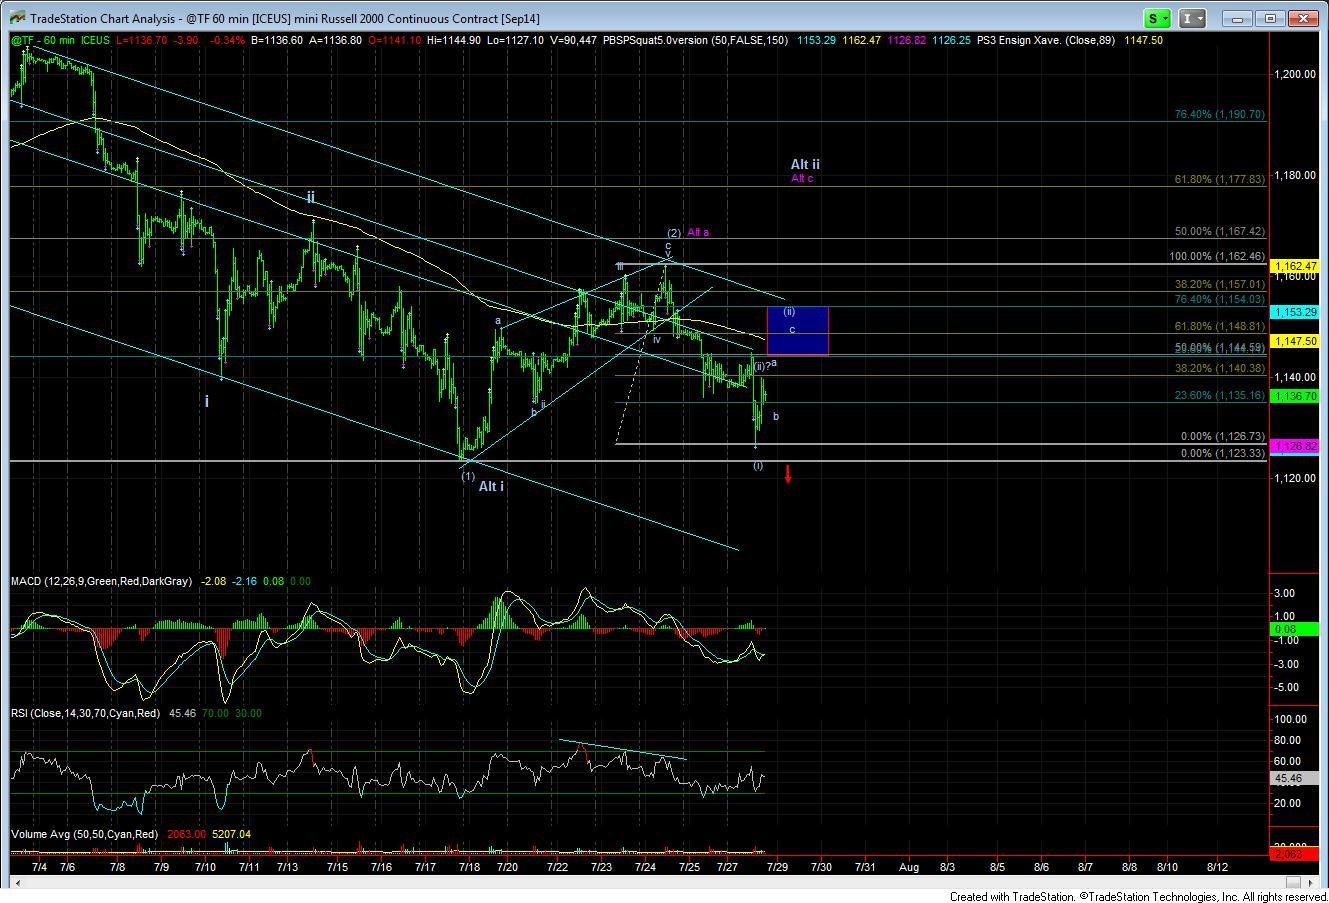
I simply am unable to provide that answer with any form of certainty. What I can say is that we have what looks best as 5 waves off the high, and only 3 waves back up. The only question I have in my mind right now is if this retrace takes longer, since the TF retraced only .382 of its prior decline, which is very shallow indeed.
So, for now, based upon the TF, it is still possible that this retrace takes us into tomorrow, which means that the ES could push higher and test the prior highs before turning down. And, as noted this past weekend, we need to break the support region just below where we hit this morning to confirm we are on our way to the 1930ES region at a minimum.
But, if we see a strong break down below 112 in the IWM, all upside bets are off in my humble opinion. Any break down below 112 that hits at least 111 should not see the IWM back over the 112 region if the downside pressure is going to continue as I expect it would with that break down.
So, let's see if we get follow through on this set up tomorrow.
Mike Paulenoff, On Implications of Weakened Germany ETF (MPTrader.com)
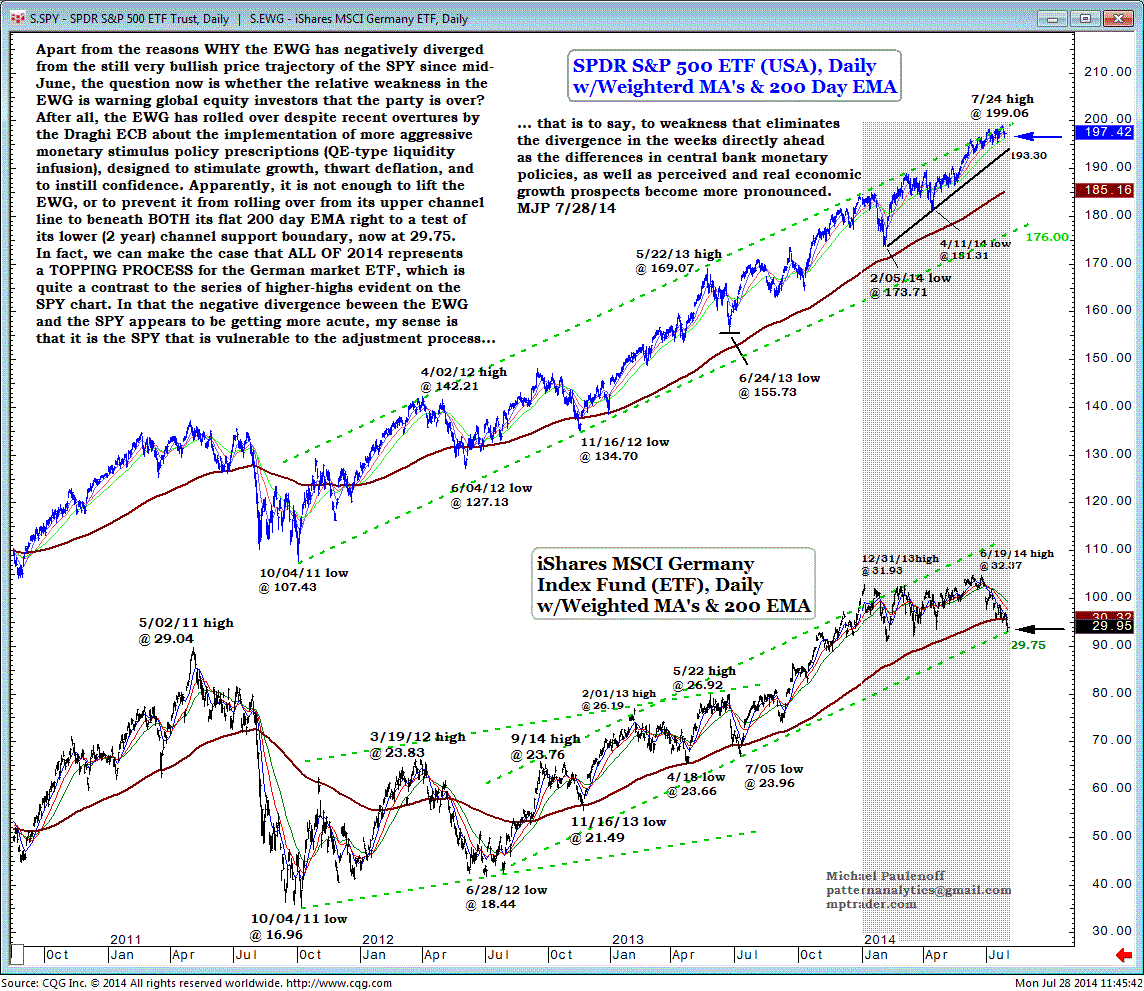
Apart from the reasons why the iShares MSCI Germany (EWG) has negatively diverged from the still very bullish price trajectory of the SPY since mid-June, the question now is whether the relative weakness in the EWG is warning global equity investors that the party is over?
After all, the EWG has rolled over despite recent overtures by the Draghi ECB about the implementation of more aggressive monetary stimulus-policy prescriptions (QE-type liquidity infusion), designed to stimulate growth, thwart deflation, and to instill confidence.
Apparently, it is not enough to lift the EWG, or to prevent it from rolling over from its upper-channel line to beneath both its flat 200-day EMA right to a test of its lower, 2-year channel-support boundary, now at 29.75.
In fact, we can make the case that all of 2014 represents a topping process for the German market ETF, which is quite a contrast to the series of higher-highs evident on the SPY chart.
In that the negative divergence between the EWG and the SPY appears to be getting more acute, my sense is that it is the SPY that is vulnerable to the adjustment process -- that is to say, to weakness that eliminates the divergence in the weeks directly ahead as the differences in central-bank monetary policies as well as perceived and real economic growth prospects become more pronounced.
Sinisa Persich, On Free Stock Pick: TOUR (TraderHR.com)
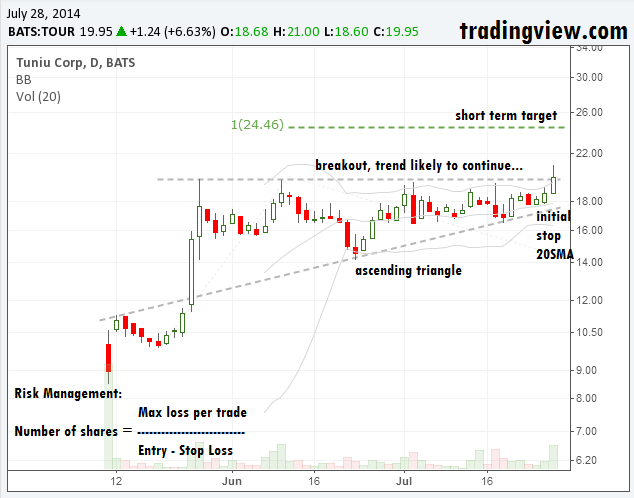
Tuniu Corporation (TOUR), a Chinese online leisure travel company, has formed an ascending triangle pattern that is narrowing toward a key breakout point in the $20.50 area. The stock has been making higher lows since its IPO in May, and is approaching horizontal resistance for the fifth time.
If resistance is broken, this could advance stock nicely toward 24-25 range. The 20 SMA should be used as initial stop loss.
Harry Boxer, On 2 Longs & 2 Shorts to Watch (TheTechTrader.com)
The stock market started Monday off with a little pop, before it took a very deep plunge. The technicals were very poor, and even though they did rally at one point, there could still be some more downside. So we're going to cover both longs and shorts here.
GoPro, Inc. (GPRO), a new issue, popped in 5 waves on Monday, came down, based out, and popped again. It formed a wedge, which could set up a bullish move, and explode to test the all-time high recently reached at 44.83. Beyond that, we could see this stock run into the high 40's.
El Pollo Loco Holdings, Inc. (LOCO) has been spectacular since its IPO on Friday. It opened at 18.48 on Friday, closing up 9.03, or 60%, and on Monday, it was up 10.45, or 43.5%, on 26 million shares, and reached as high as 34.73. If it continues to go higher, look for it to head up towards the high 30's.
Stocks on the Short Side.....
Medidata Solutions, Inc. (MDSO) looks like it's about to crack. It formed a bear flag, then a bear wedge, and if it takes out the line of resistance, it could quickly come down to 32, and then maybe the high 20's.
Waddell & Reed Financial, Inc. (WDR) had a major uptrend going all the way back to 2012, then a massive top formation in March-April, it rolled over, formed a rising wedge that was broken, and now a bear wedge. This one looks lower, too. Look for 52 1/2 for the next move.
Other stocks on Harry's Charts of the Day are Arris Enterprises, Inc. (ARRS), Natus Medical Inc. (BABY), BioFuel Energy Corp. (BIOF), JD.com, Inc. (JD), Move, Inc. (MOVE), Qihoo 360 Technology Co. Ltd. (QIHU), Silicon Motion Technology Corp. (SIMO), Summer Infant, Inc. (SUMR), and VASCO Data Security International (VDSI).
Stocks on the short side include Acxiom Corporation (ACXM), CalAmp Corp. (CAMP), Core Laboratories NV (CLB), Engility Holdings, Inc. (EGL), eHealth, Inc. (EHTH), ITT Educational Services Inc. (ESI), Inter Parfums Inc. (IPAR), MasTec, Inc. (MTZ), Nu Skin Enterprises Inc. (NUS), and Silicom Ltd. (SILC).
This Web site is published by AdviceTrade, Inc. AdviceTrade is a publisher and not registered as a securities broker-dealer or investment advisor either with the U.S. Securities and Exchange Commission or with any state securities authority. The information on this site has been obtained from sources considered reliable but we neither guarantee nor represent the completeness or accuracy of the information. In addition, this information and the opinions expressed are subject to change without notice. Neither AdviceTrade nor its principals own shares of, or have received compensation by, any company covered or any fund that appears on this site. The information on this site should not be relied upon for purposes of transacting securities or other investments, nor should it be construed as an offer or solicitation of an offer to sell or buy any security. AdviceTrade does not assess, verify or guarantee the suitability or profitability of any particular investment. You bear responsibility for your own investment research and decisions and should seek the advice of a qualified securities professional before making any investment.
Recommended Content
Editors’ Picks
EUR/USD clings to daily gains above 1.0650

EUR/USD gained traction and turned positive on the day above 1.0650. The improvement seen in risk mood following the earlier flight to safety weighs on the US Dollar ahead of the weekend and helps the pair push higher.
GBP/USD recovers toward 1.2450 after UK Retail Sales data

GBP/USD reversed its direction and advanced to the 1.2450 area after touching a fresh multi-month low below 1.2400 in the Asian session. The positive shift seen in risk mood on easing fears over a deepening Iran-Israel conflict supports the pair.
Gold holds steady at around $2,380 following earlier spike

Gold stabilized near $2,380 after spiking above $2,400 with the immediate reaction to reports of Israel striking Iran. Meanwhile, the pullback seen in the US Treasury bond yields helps XAU/USD hold its ground.
Bitcoin Weekly Forecast: BTC post-halving rally could be partially priced in Premium

Bitcoin price shows no signs of directional bias while it holds above $60,000. The fourth BTC halving is partially priced in, according to Deutsche Bank’s research.
Week ahead – US GDP and BoJ decision on top of next week’s agenda

US GDP, core PCE and PMIs the next tests for the Dollar. Investors await BoJ for guidance about next rate hike. EU and UK PMIs, as well as Australian CPIs also on tap.


