Jack Steiman, On Market Flashing a "Be Careful" Signal (SwingTradeOnline.com)
We saw a bit of selling off the top on Monday. The key was the reversal off the large, early-morning futures, which were up quite a bit thanks to the latest bailout of a country that did things poorly. The Dow futures were up nearly 100 points when figuring in fair value this morning on the news. The fact that we closed over 100 points below those futures is telling about what the market is up against these days. Nothing is easy when you have bears at under 20% from two consecutive weeks along with more and more stocks breaking down below their 50-day exponential moving averages.
Too many stocks are not performing now, especially in tech land and the commodity world. Since the Oracle Corporation (ORCL) big warning last week, we're seeing stock after stock in the software sector struggling big time. A lot of highly weighted stocks in the world of software are taking a toll on the market. Now it is also true that a lot of heavily weighted stocks are hanging in there as well from different sectors of the market. The push pull is why the market is not breaking down hard but also why it's struggling more up here. A bigger burden is being placed on fewer and fewer stocks, so we shall see if the market can rock higher from here. It won't be easy. The bull market is very powerful thanks to Ben, but you wonder when this could snap for a while. Of course, it would be healthy if it did, but the bears have been unable to do anything on that front for quite some time, so the burden of proof remains squarely on their frail shoulders to get it done.
When the market is rocking upward, you see the heavy majority of stocks easily above their 50-day exponential moving average and when they make a rare test down they explode off of it. Rocket rides to the upside when tested. When we see so many stocks breaking down below those 50's you wait to see what they'll do when they back test those lost 50's from underneath. Just take a look at eBay Inc. (EBAY) Monday to see what many are doing. A real crater back down off the back test. Really nasty and a change of trend. So the red flag is up and flashing a "be careful" signal about this market. Sure, nothing terrible at all, but there are changes of trends taking place and they need to be respected for their possible messages.
Sentiment crept into the market Monday morning. Folks were falling all over themselves once the news came out that Cyprus was saved as is the norm these days. Call buying was rampant. The first two put-call readings were a very complacent 0.52 and 0.58. We haven't seen back to back readings below 0.6 for an extremely long time. The complacency is creeping in a bit deeper now as things refuse to fall no matter what the news may be. There is a feeling amongst traders that they are fully protected against anything negative. Why worry approach. Not great.
This goes along well with the 18% bears we're seeing these days. Two weeks running now. I hope this Wednesday doesn't bring in week number three in a row. We shall see, but you get the sense that people just don't think the market can fall and that all is well no matter what the news. That has to raise yet another red flag to the short-term. Doesn't mean we sell right away but again, the risk is now somewhat higher than it's been so you should respond with your trading accordingly. Just know that beta plays --those high moving, volatile stocks -- can really make your life miserable if you fool with them too much. There is more and more complacency, so please just be aware of that when trading.
The bull market is alive and well bigger picture, but the short-term is unclear. Weekly and monthly index charts are mostly at overbought (70 RSI's) and that shouldn't be ignored when you think about all that I've talked about above. Nothing is affecting this market adversely here, but risk is higher than it has been for quite some time. That doesn't mean we don't go higher, even much higher, first but things are complicated and risky, so adjust is all.
Mike Paulenoff, On Support Levels to Watch in "Scary-but-Minor" Correction (MPTrader.com)
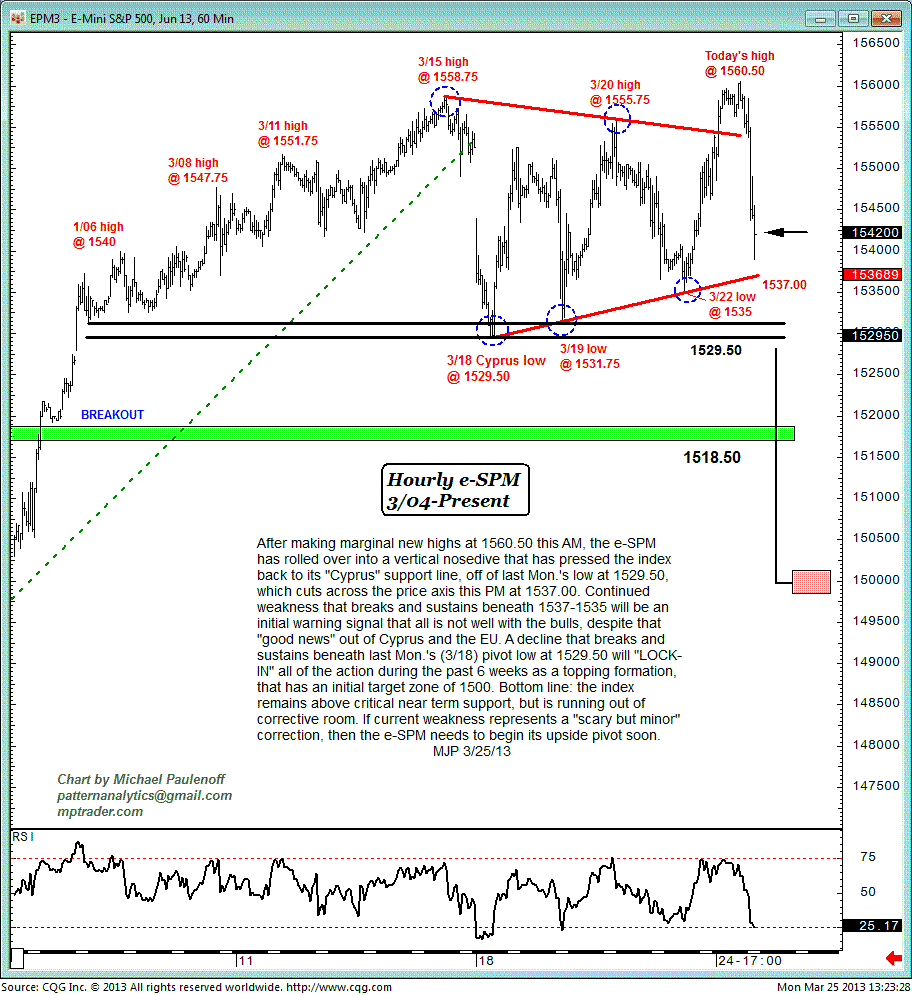
After making marginal new highs at 1560.50 Monday morning, the E-mini S&P 500 rolled over into a vertical nosedive that pressed the index back to its "Cyprus" support line, off of last Monday's low at 1529.50, which cuts across the price axis this afternoon at 1537.00.
Continued weakness that breaks and sustains beneath 1537-1535 will be an initial warning signal that all is not well with the bulls, despite that "good news" out of Cyprus and the EU.
A decline that breaks and sustains beneath last Monday's (3/18) pivot low at 1529.50 will "lock-in" all of the action during the past 6 weeks as a topping formation, that has an initial target zone of 1500.
Bottom line: The index remains above critical near-term support, but is running out of corrective room.
If current weakness represents a "scary but minor" correction, then the e-SPM needs to begin its upside pivot soon.
Harry Boxer, On 5 Stocks to Watch for Tuesday (TheTechTrader.com)
Wall Street didn't have a very good day on Monday. It started out looking good with a gap up, but then it reversed and stayed down pretty much the rest of the day. It's looking like it may be down all week, and if that's the case, we'll be covering more shorts throughout the week. For now, we have both longs and shorts to go over here.
ACADIA Pharmaceuticals Inc. (ACAD), which exploded two days ago, backed off yesterday, and then came on again on Monday. It started the day with a pop and a pullback, a nice, early run, it rolled over and came down, rolled over again and did about a 50% retrace, snapped back, but couldn't get through. The declining topsline and the raising-bottom line are narrowing to the apex of a large coiling pattern. It needs to be watched the next couple days. If it gets up through resistance at 8.55-.70, this stock could take off. The daily chart shows that if it can get up through the 8.81 area, this stock could spike up to the 10-11 zone.
Manitex International, Inc. (MNTX) broke out through key resistance on Monday with a nice, little pop, up 68 cents to 12.45, or 5.78%, on 732,300 shares, the best volume in over a year. This stock has a beautiful, long-term rising channel. If it continues to run, it has a target on it at 15 short-term, and beyond that, a target of 19.
Sarepta Therapeutics, Inc. (SRPT) had a good day on Monday, up 1.89 to 34.66, or 5.77%, on 2 million shares. That's the best close all year. If it will extend beyond resistance, we might see something up around Monday's high at 35 short-term, and then 37 intermediate-term.
On the Short Side......
Rentech Nitrogen Partners, L.P. (RNF), a Boxer Short, is working up very well to give a short of 41. It got all the way down to 32.47 before bouncing. It's certainly a negative-looking pattern. It broke through support and there may be further downside for this stock before it bounces.
Stratasys Inc. (SSYS) gave a little head-fake break up on Friday, and went right to and then closed just below the 50, and then it dropped back from 76.47 to 71.82. It did bounce to 73.12. Still, it was down 1.68, on nearly a half million shares traded. If it breaks this pattern, it could roll over hard into the mid to high 50's, but for starters, look for something near 66.
Other stocks on Harry's Charts of the Day are Ambarella, Inc. (AMBA), Goldfield Corp. (GV), Himax Technologies, Inc. (HIMX), Horizon Pharma, Inc. (HZNP), Immersion Corporation (IMMR), Landec Corp. (LNDC), Revolution Lighting Technologies, Inc. (RVLT), Sinclair Broadcast Group Inc. (SBGI), and Theravance Inc. (THRX).
Stocks on the short side include Atlas Air Worldwide Holdings Inc. (AAWW), Altisource Portfolio Solutions S.A. (ASPS), EZchip Semiconductor Ltd. (EZCH), Liquidity Services, Inc. (LQDT), Medifast Inc. (MED), The Valspar Corporation (VAL), Vitamin Shoppe, Inc. (VSI).
Avi Gilburt, On Precious Metals Looking Lower (ElliottWaveTrader.net)
Over the last week, we really saw much action with nothing accomplished!! Well, other than the metals are telling us that they are still in corrective mode, and will likely see one further decline.
The question simply remains "how low?"
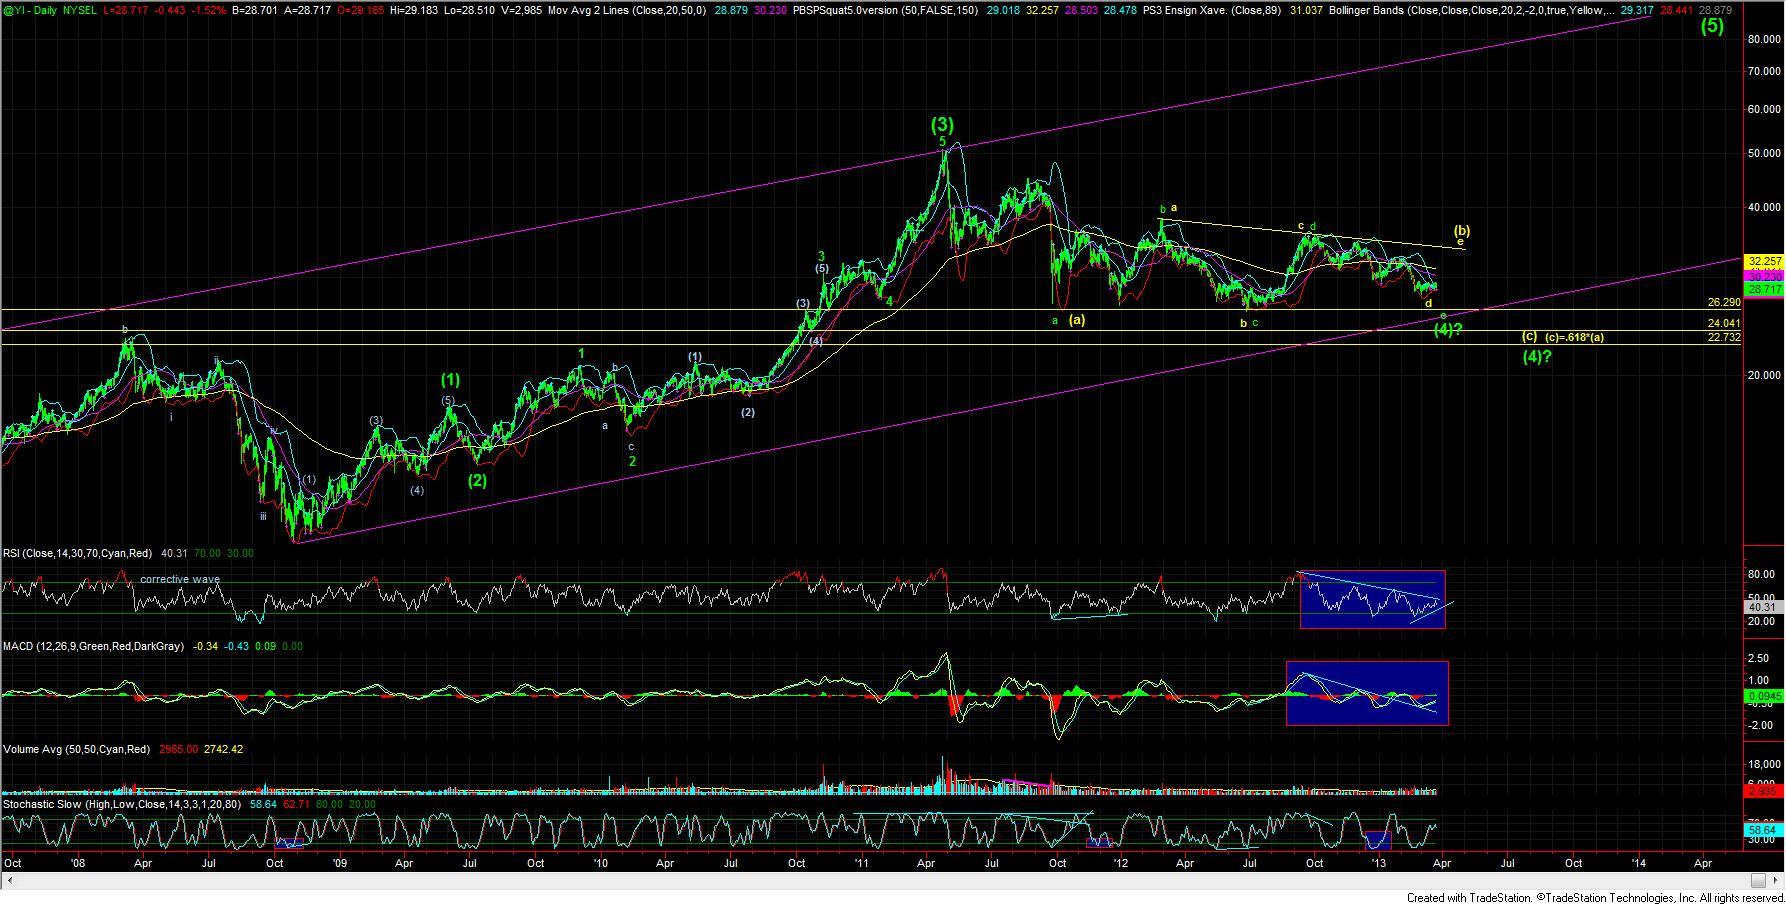
I am now going back to a game plan I have had since the metals have topped, and because GLD is in such a perfect trend channel potentially pointing to the fulfillment of that long-time game plan, I may shock you in saying that the metals can still go quite lower. In fact, my old target regions for GLD are the 142/144 region and for silver it is the 22/24 region.
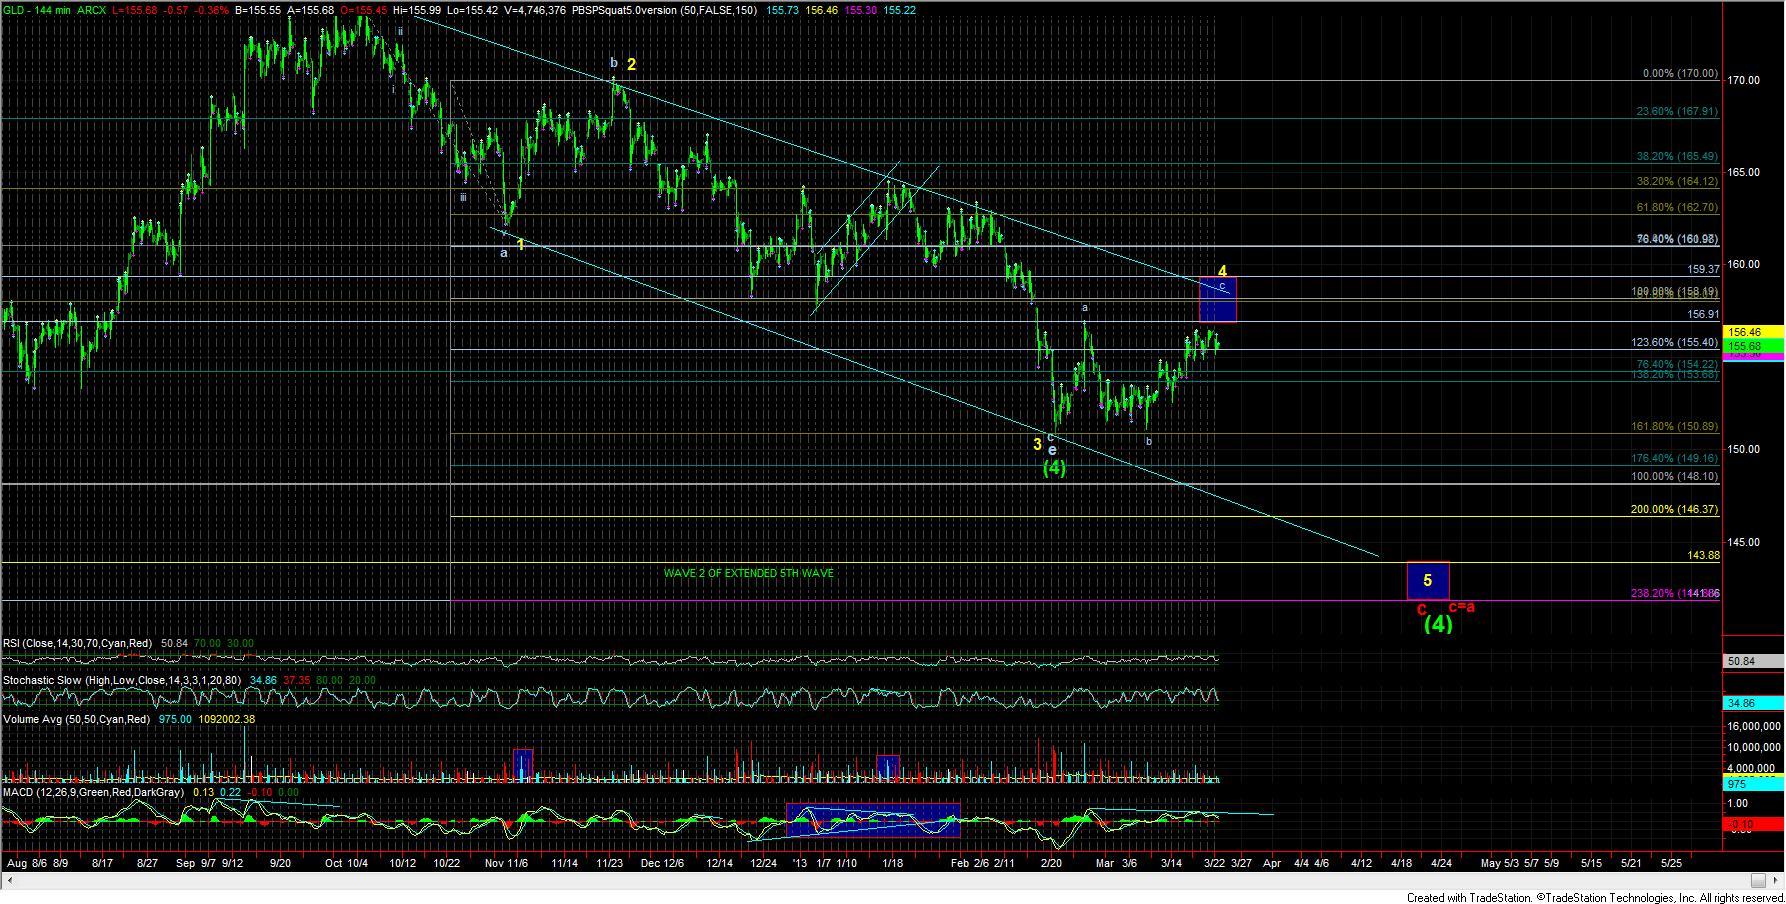
If you look at my 144 minute chart on the GLD, you have the makings of a beautiful 4th wave, which seems to be topping right at the top of the downtrend channel.
Additionally, we have approached the a=c point within this 4th wave, and the 1.00 extension down from the October 2012 high looms just overhead as strong resistance in the 158 region. The rally in this c-wave exhibited beautiful negative divergences that one would see in a c-wave relative to a stronger a-wave, and the volume was simply pathetic. Even though I have warned many, many times about a potential parabolic rally about to begin in the metals, this seems like a textbook short set up for a 5th wave decline. And, as I said before, the bottom of that mature trend channel points to my long time target being hit at the end of April. As an aside, this can also coincide with a bottom in a larger degree wave 4 in the overall markets.
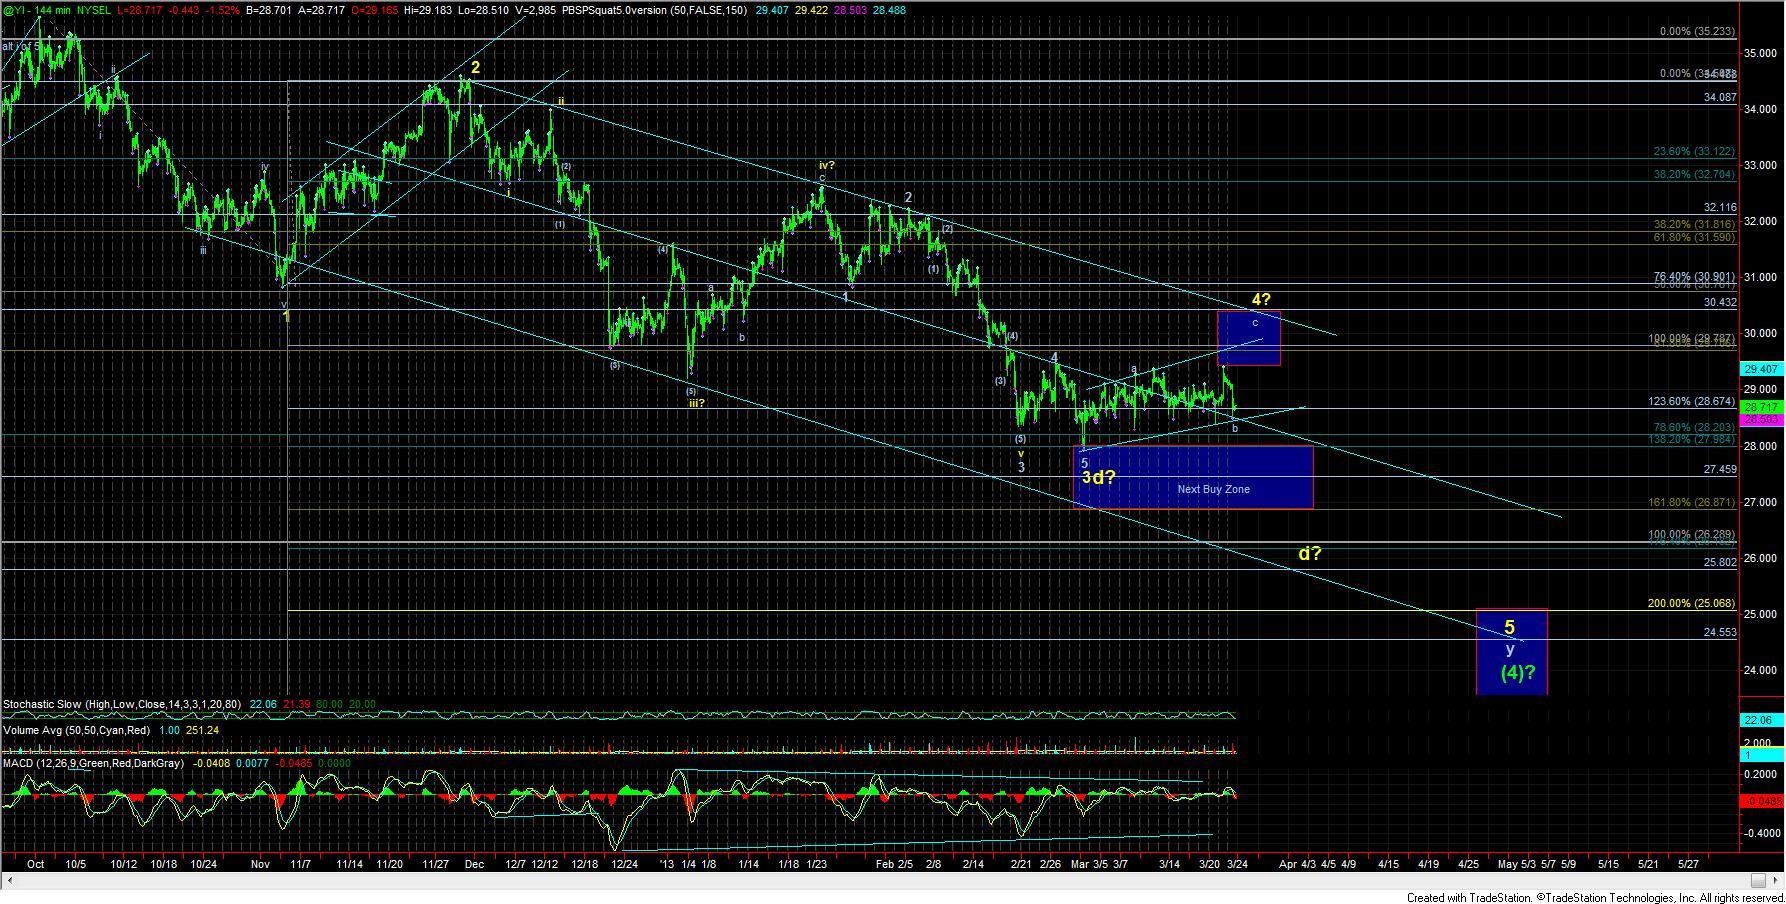
So, unless we can see a technically powerful move through the 158/159 region in GLD and a powerful move through the 30.90 region in silver, I will be looking down rather than up at this time. And, as you can see the support levels on the chart, we will be watching each of those levels below for a potential bottom, in the event we do not attain my much lower ideal targets.
As for silver, we have the 29.97 region top target, but one more potential topping target below the 30.90 region has come to light, which is the 30.40 region, which is where a=c, and where the larger downtrend channel resides for the larger yellow wave 4. So, until we can move through that region, I am expecting one more decline to be seen.


This Web site is published by AdviceTrade, Inc. AdviceTrade is a publisher and not registered as a securities broker-dealer or investment advisor either with the U.S. Securities and Exchange Commission or with any state securities authority. The information on this site has been obtained from sources considered reliable but we neither guarantee nor represent the completeness or accuracy of the information. In addition, this information and the opinions expressed are subject to change without notice. Neither AdviceTrade nor its principals own shares of, or have received compensation by, any company covered or any fund that appears on this site. The information on this site should not be relied upon for purposes of transacting securities or other investments, nor should it be construed as an offer or solicitation of an offer to sell or buy any security. AdviceTrade does not assess, verify or guarantee the suitability or profitability of any particular investment. You bear responsibility for your own investment research and decisions and should seek the advice of a qualified securities professional before making any investment.
Recommended Content
Editors’ Picks
AUD/USD remained bid above 0.6500

AUD/USD extended further its bullish performance, advancing for the fourth session in a row on Thursday, although a sustainable breakout of the key 200-day SMA at 0.6526 still remain elusive.
EUR/USD faces a minor resistance near at 1.0750

EUR/USD quickly left behind Wednesday’s small downtick and resumed its uptrend north of 1.0700 the figure, always on the back of the persistent sell-off in the US Dollar ahead of key PCE data on Friday.
Gold holds around $2,330 after dismal US data

Gold fell below $2,320 in the early American session as US yields shot higher after the data showed a significant increase in the US GDP price deflator in Q1. With safe-haven flows dominating the markets, however, XAU/USD reversed its direction and rose above $2,340.
Bitcoin price continues to get rejected from $65K resistance as SEC delays decision on spot BTC ETF options

Bitcoin (BTC) price has markets in disarray, provoking a broader market crash as it slumped to the $62,000 range on Thursday. Meanwhile, reverberations from spot BTC exchange-traded funds (ETFs) continue to influence the market.
US economy: slower growth with stronger inflation

The dollar strengthened, and stocks fell after statistical data from the US. The focus was on the preliminary estimate of GDP for the first quarter. Annualised quarterly growth came in at just 1.6%, down from the 2.5% and 3.4% previously forecast.
