Jack Steiman, On Simply Unwinding Overbought (SwingTradeOnline.com)
The market was begging for it. It had stayed overbought longer than most would have thought possible, with RSIs well above 70. Those who shorted at the first signs of overbought paid a big price as the market kept climbing higher. You had to stay with the trend while waiting for the morning you wake up with the futures down hard. When these snap downs occur, it usually is with a strong gap lower that holds and trends lower throughout the day. Not necessarily always having to close on the lows, but clearly closing below the gap down readings. The bulls on Monday were finally unable to make up the losses that took place early on.
That is a good thing for the bulls and this market. You get to the point where you're almost begging for the market to sell and stay down so as to be able to buy back stocks at a cheaper level with the oscillators finally unwound. Buying when those oscillators are high all the time makes it difficult to get overly involved. The selling here should provide entries at far better and safer levels soon enough. For now we watch and wait for some type of bottoming sticks along with enough unwinding of those oscillators. You can then add to your long side positions with far greater safety and confidence.
Selling was pretty much across the board, but two things were clear on Monday. The higher beta and more frothy stocks took it on the chin pretty hard, while the recent best stock earners held up the best. This is key for traders to understand. The market will naturally gravitate to the stocks that have the least risk based upon what they reported just a week or so ago. They know these stocks are safest for a multitude of reasons. For one, big money supported the moves up off those reports and will therefore be around to defend them when they get to support. In addition, there's real safety in knowing these companies just reported and will, therefore, not have to report some unexpected bad news that can really hurt the price action.
Always keep in mind what got the market to this point when trying to understand what's going on with price and whether it's real selling or selling simply to unwind overbought oscillators. If the market wanted to sell due to bad news, it would have had a tough time as there has been mostly good news lately. Start with Mr. Bernanke, who once again last week promised to do what's necessary to keep the economy humming along. He will additionally keep interest rates near zero for the foreseeable future virtually guaranteeing the market will hang in there as there's nowhere else to put your dollars if you want growth.
We also just had an unexpected and a very happy surprise when the ISM Manufacturing number was reported, a nice move away from 50.0, which is the dividing line between growth and an economy in recession. Add in good earnings reports, overall, and this market should be doing nothing more than unwinding oscillators for now.
The point here is that if we sell even further and harder in the days ahead, don't get too bearish too quickly. It probably won't serve you very well. With S&P 500 1480/1480 great support, I would not expect the market to lose 1470 any time soon. But we are always on watch. For now, the market is simply unwinding overbought.
Harry Boxer, On 2 Longs & 2 Shorts to Watch (TheTechTrader.com)
The stock market had a bad day on Monday. Trend line and support lines have been broken, and it could be heading lower. We're going to go over both longs and shorts here. There were some interesting trades on the long side for our group on Monday.
Infinity Pharmaceuticals, Inc. (INFI) was up 1.33 to 33.65, or only 4%, on Monday. It formed a kind of wedge or coiling pattern during the last 4-5 weeks. If it does break out of there, and maintains the angle of ascent, the swing trade target is set for 43 and the intermediate target is up around 50. So keep an eye on this stock.
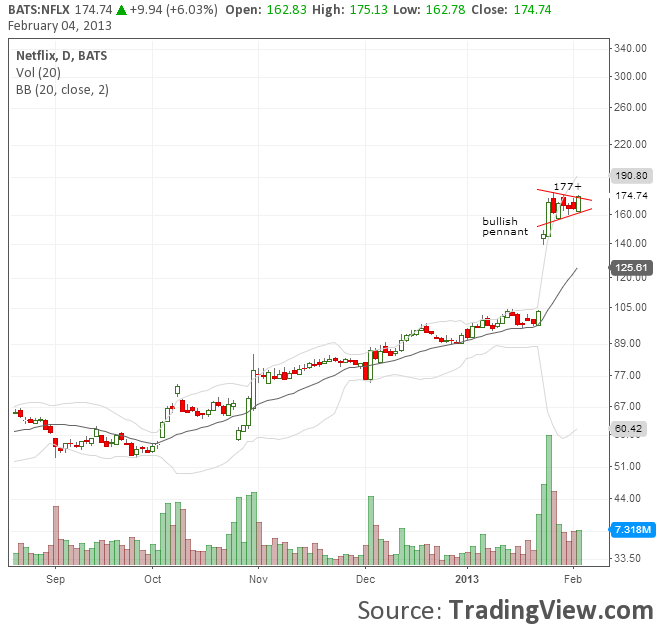
Netflix Inc. (NFLX) has a very, very interesting chart. It moved in a stair-step fashion from around the Sept-Oct lows under 55, worked its way up, accelerating on earning, exploded, consolidated for a week, and on Monday, it popped 9.94 to 174.74, or 6%, on 7.2 million shares, and reached as high as 175.13. That's the highest close since 2011.
Although there is resistance at that level, and if it does break through, we could see this stock up around 220-225.
Stocks on the Short Side...
Coach, Inc. (COH) is a short right now because of the massive top it formed in the last couple years. On Monday, it was down 1.20 to 48.67, or 2.4%, on 7.6%. It slightly broke through key support, and was unable to get back to resistance, and now it's falling apart.
It could accelerate to the downside quickly, even to the bottom of the channel down around 41. Below that, look for something around the 35-37 zone.
Blue Nile Inc. (NILE) had a short put on it on Monday because the top broke. A rising bear wedge formed and it began to roll over. It was down 2.14 to 31.80, or 6.3%, on 370,200 shares. The gap at the 30 support line may be tested. If 30 breaks, we could see this stock drop to around 25-26.
Other stocks on Harry's Charts of the Day are BlackBerry (BBRY), BroadSoft, Inc. (BSFT), Consumer Portfolio Services, Inc. (CPSS), Caesars Entertainment Corporation (CZR), EDAP TMS SA (EDAP), Hyperion Therapeutics, Inc. (HPTX), Opko Health, Inc. (OPK), and Sonus Networks, Inc. (SONS).
Stocks on the short side include Apple Inc. (AAPL), Atlas Air Worldwide Holdings Inc. (AAWW), Diebold, Incorporated (DBD), Mellanox Technologies, Ltd. (MLNX), The Fresh Market (TFM), Yum! Brands, Inc. (YUM), and Zumiez, Inc. (ZUMZ).
Mike Paulenoff, On Short-Term Reaction Within Prevailing Trend (MPTrader.com)
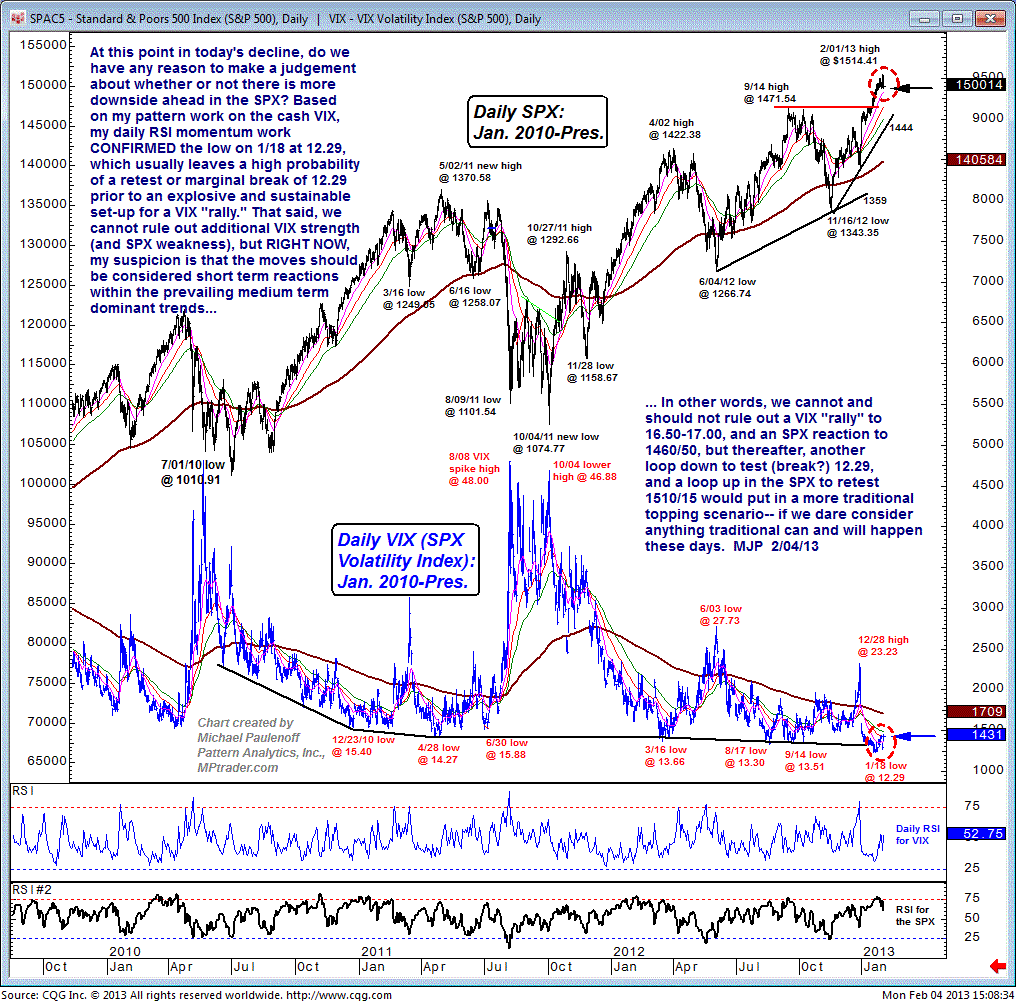
Is there more downside ahead in the S&P 500 Index (SPX)?
Based on my pattern work on the VIX (the SPX Volatility Index), my daily RSI momentum work confirmed the low on Jan 18 at 12.29. This usually leaves a high probability of a retest or marginal break of 12.29 prior to an explosive and sustainable set-up for the VIX "rally."
That said, we cannot rule out additional VIX strength, and SPX weakness, but right now, my suspicion is that the moves should be considered short-term reactions within the prevailing medium-term dominant trends.
In other words, we cannot, and should not, rule out a VIX "rally" to 16.50-17.00, and an SPX reaction to 1460/50. But, thereafter, another loop down to test (break?) 12.29, and a loop up in the SPX to retest 1510/15 would put in a more traditional topping scenario, if we dare consider that anything traditional can and will happen these days.
Avi Gilburt, On Eyeing 1490 ES (ElliottWaveTrader.net)
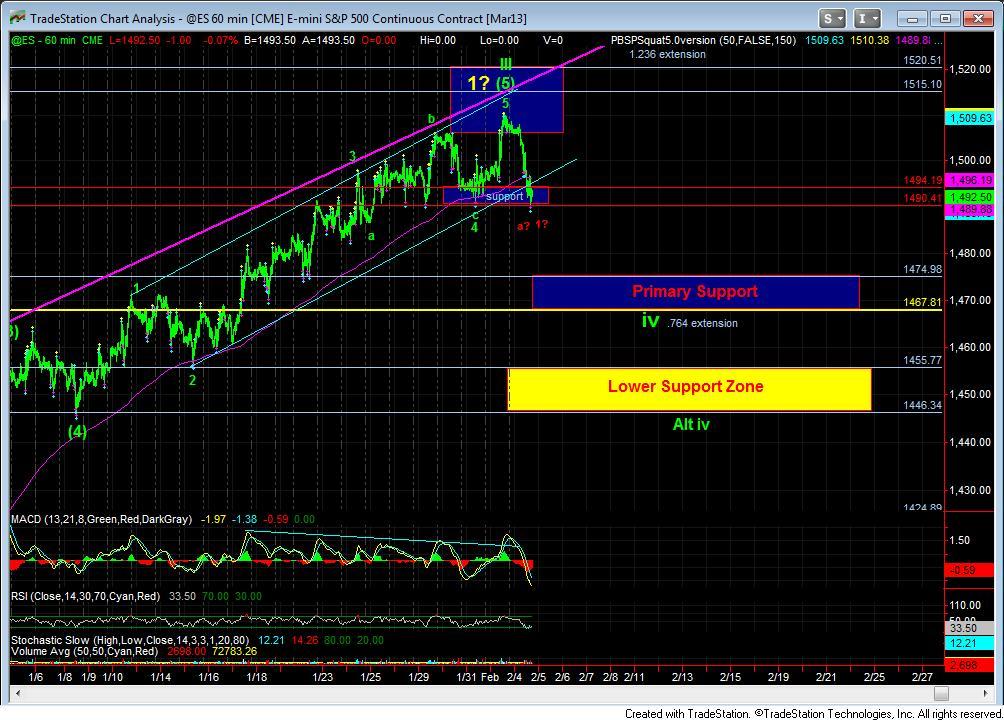
Although the market has not yet taken out 1490ES just yet, this seems to be the most reasonable count at this time. This count has the 5th wave equal to .764 times the size of wave 1 of wave (5) of iii. At this time, it still may need an extension down to complete a full 5 waves down ... so Tuesday can hopefully shed a little more light.
Remember, in the most bullish count, this is a wave iv within a larger wave 3. That should not take only a few days to complete. So, let's be a bit patient here.
Sinisa Persich, On Eye on CCJ, SIX, NFLX, DK (TraderHr.com)
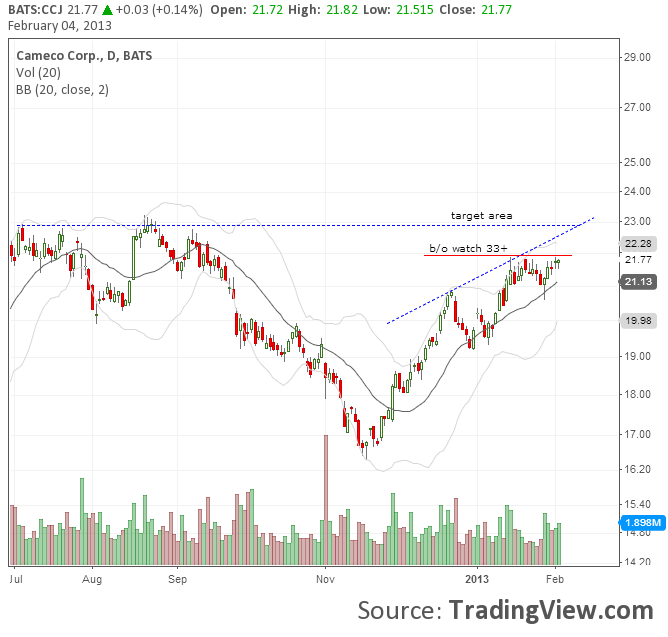
We're keeping an eye on Cameco Corp (CCJ) for a breakout above its current 21 1/2-3/4 level, in which it's consolidated in the last 3 weeks after a run-up from 19 1/4 on December 28. The stock was as low as 16 3/4 in November and has reversed, with the next target at 23.
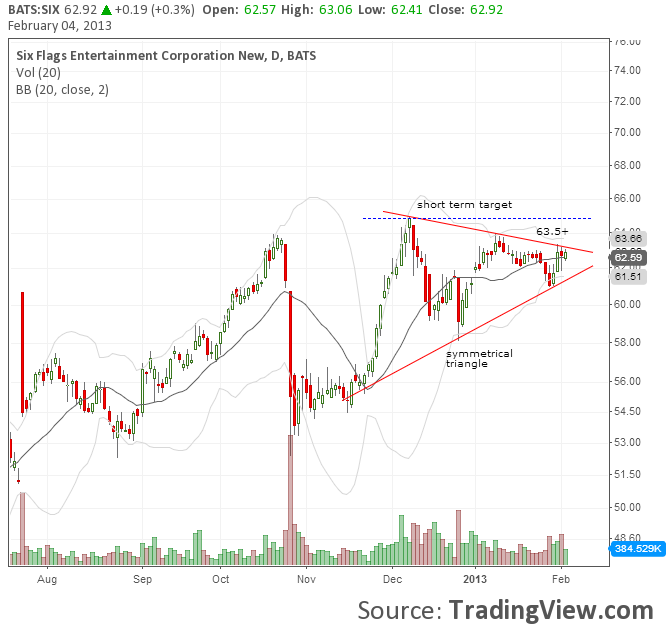
Six Flags Entertainment (SIX) is in a symmetrical triangle pattern that is converging to a point a current levels in the 62 1/2 area. A breakout above 63 1/2 could continue the run-up from 44 in June to double-tops in the 64 3/4 area in October and December.
Netflix (NFLX) is in a bullish pennant off its big gap from the 103 to 146 levels on January 24 and continuing to near 170 on January 15. Watch for a breakout above 177, as the stock continues its upside reversal from last September's lows in the 54 area after reaching as high as 295 in July 2011.
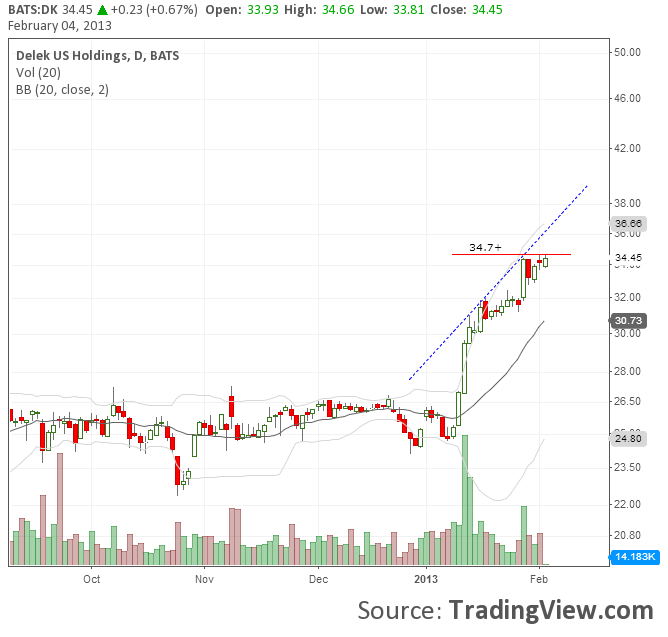
Delek US Holdings (DK) is flagging in the 34 1/2 area after a breakout from the 25 level in the last month. Watch for a break of 34.70 to continue the uptrend.
This Web site is published by AdviceTrade, Inc. AdviceTrade is a publisher and not registered as a securities broker-dealer or investment advisor either with the U.S. Securities and Exchange Commission or with any state securities authority. The information on this site has been obtained from sources considered reliable but we neither guarantee nor represent the completeness or accuracy of the information. In addition, this information and the opinions expressed are subject to change without notice. Neither AdviceTrade nor its principals own shares of, or have received compensation by, any company covered or any fund that appears on this site. The information on this site should not be relied upon for purposes of transacting securities or other investments, nor should it be construed as an offer or solicitation of an offer to sell or buy any security. AdviceTrade does not assess, verify or guarantee the suitability or profitability of any particular investment. You bear responsibility for your own investment research and decisions and should seek the advice of a qualified securities professional before making any investment.
Recommended Content
Editors’ Picks
EUR/USD consolidates recovery below 1.0700 amid upbeat mood

EUR/USD is consolidating its recovery but remains below 1.0700 in early Europe on Thursday. The US Dollar holds its corrective decline amid a stabilizing market mood, despite looming Middle East geopolitical risks. Speeches from ECB and Fed officials remain on tap.
GBP/USD advances toward 1.2500 on weaker US Dollar

GBP/USD is extending recovery gains toward 1.2500 in the European morning on Thursday. The pair stays supported by a sustained US Dollar weakness alongside the US Treasury bond yields. Risk appetite also underpins the higher-yielding currency pair. ahead of mid-tier US data and Fedspeak.
Gold appears a ‘buy-the-dips’ trade on simmering Israel-Iran tensions

Gold price attempts another run to reclaim $2,400 amid looming geopolitical risks. US Dollar pulls back with Treasury yields despite hawkish Fedspeak, as risk appetite returns. Gold confirmed a symmetrical triangle breakdown on 4H but defends 50-SMA support.
Manta Network price braces for volatility as $44 million worth of MANTA is due to flood markets

Manta Network price was not spared from the broader market crash instigated by a weakness in the Bitcoin market. While analysts call a bottoming out in the BTC price, the Web3 modular ecosystem token could suffer further impact.
Investors hunkering down

Amidst a relentless cautionary deluge of commentary from global financial leaders gathered at the International Monetary Fund and World Bank Spring meetings in Washington, investors appear to be taking a hiatus after witnessing significant market movements in recent weeks.
