EUR/USD Technical analysis Nov 24th - Nov 28th
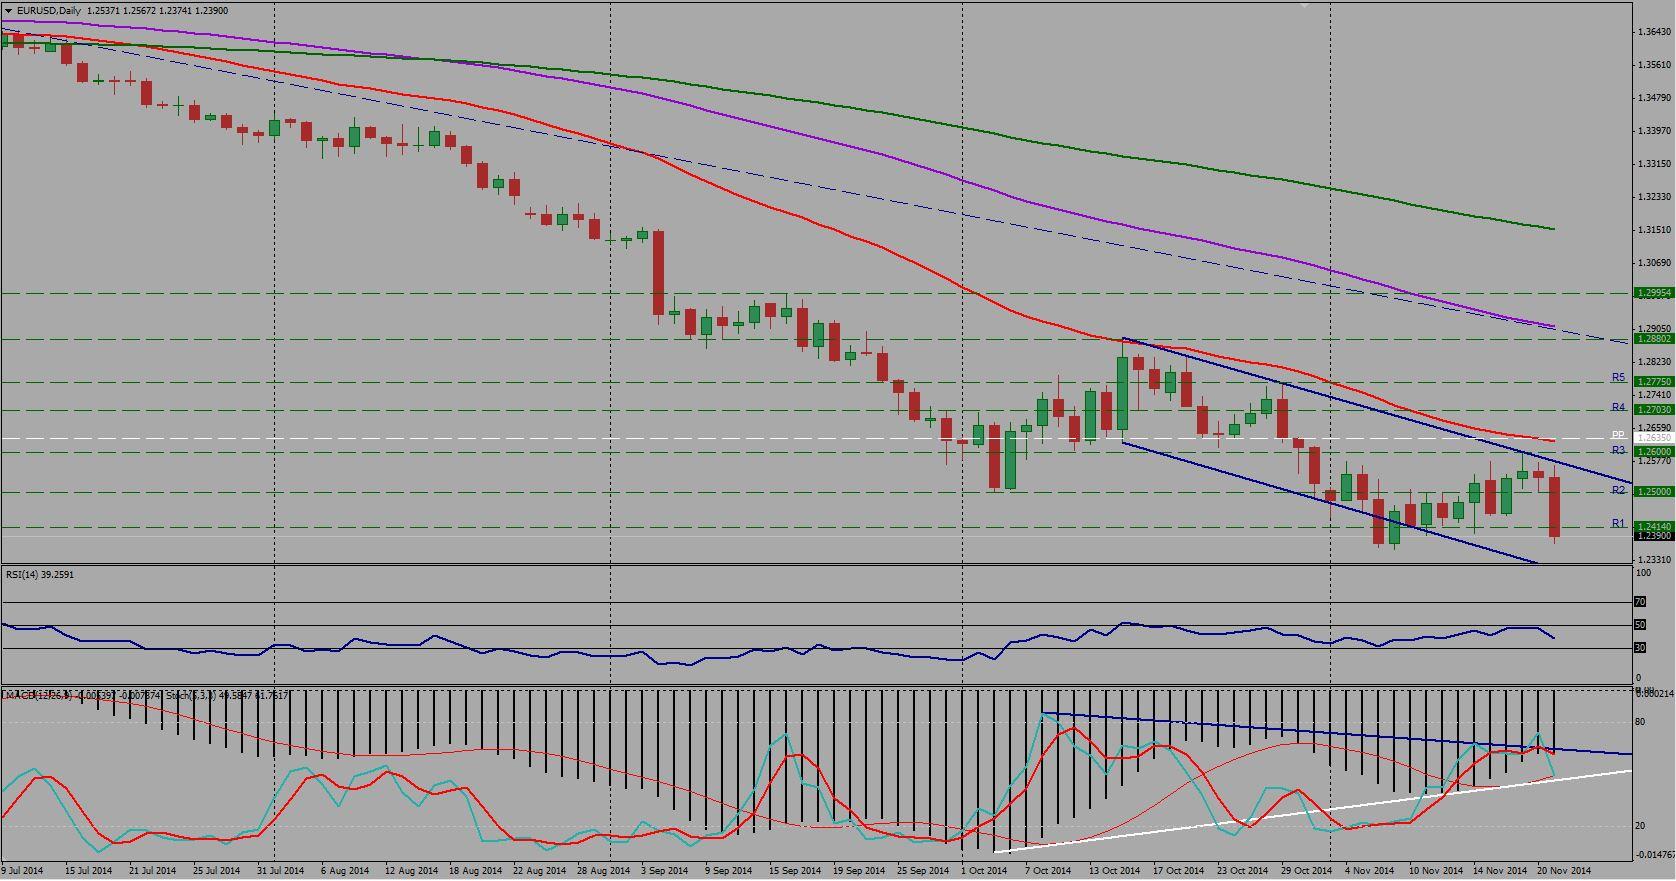
With last week’s fundamental tsunami EUR/USD started the week with neutral bias. For the most part of the week the pair ranged between 1.2500 and 1.2575. On Wednesday the 19th the pair made its weekly high of 1.2598 however quickly fell back to its bearish channel boundaries. All eyes were on EUR for ECB President Mario Draghi’s speech on Friday, where he once again did what he is known for and created “Super” volatility in the market.
Mr. Draghi emphasized once again “Shorter-term inflation expectations ‘Excessively Low’ that ECB will use all means within mandate to return inflation to its target”.
For the week the pair found its resistance at 1.2598, made lower high and broke below 1.2400 support zone making a lower low as well at 1.2374 level towards the end of the trading week. As the pair broke below 1.2400 support zone we have bearish momentum has once again increased over the pair.
On the daily chart, the price structure still remains lower peaks and lower troughs below both the 50- and the 200-day moving averages, and this keeps the overall down path intact with bearish targets on the way towards 1.2300 monthly support zone and the anticipated 1.2000 psychological barrier.
Overall the daily trend can be concluded as strong bearish based on Friday’s market movement and the weekly closing.
Expectations for the upcoming week (Nov 24th - Nov 28th):
From smaller time frame point of view, we can see the pair bouncing off the upper boundary of the bearish channel and getting below all the moving averages on H4 timeframe. Especially given that Mr. Draghi’s speech on Friday is rather negative on Euro-zone economy and the monetary divergence has increased and is expected to grow even larger by 2015, on the long-run we may expect to see EUR/USD moving lower than investors initially speculated.
Resistance levels: 1.2414 (R1), 1.2500 (R2), 1.2600 (R3) and 1.2635 (MPP)
Support levels: 1.2307 (S1), 1.2200 (S2) and 1.2020 (S3)
GBP/USD Technical analysis Nov 24th - Nov 28th
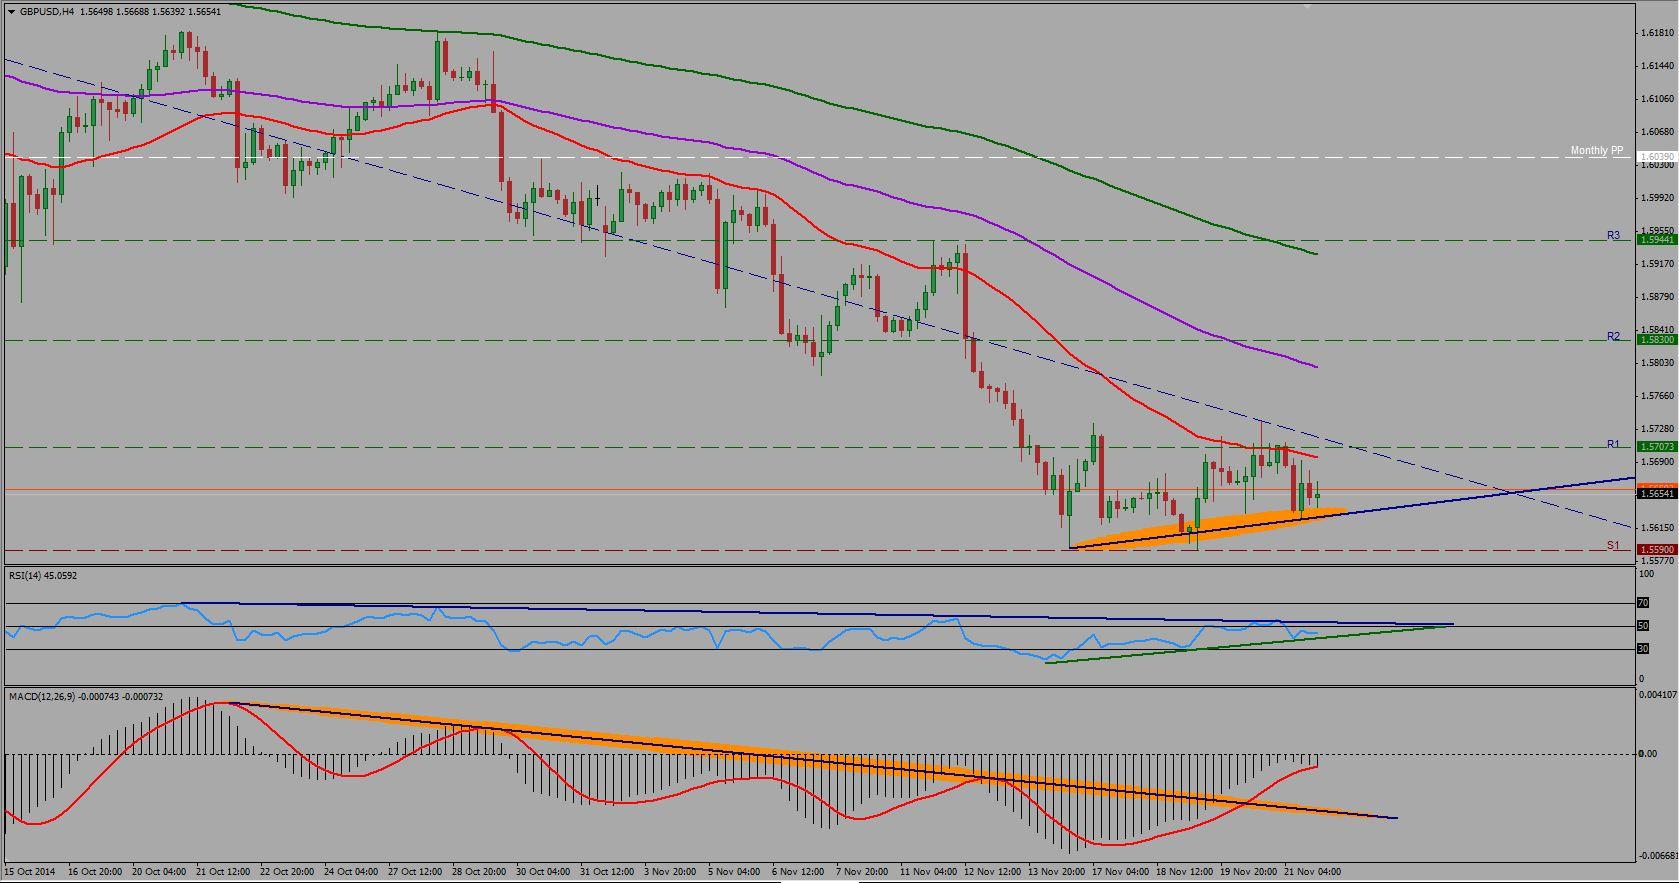
It was a close-range sideway week for the Cable last week. The pair opened the week with a 15 pip Gap at 1.5681 which was quickly closed during the 1st trading hour. As the bears and bulls kept colliding during the week the British pound bounced between 1.5730 and 1.5600 for the most part of the week.
The pound sterling found its weekly resistance at 1.5737 which was also 100 SMA on H1 timeframe as well as the boundary of the long-lasting trend line.
We may expect further bearish power as the pair’s main support is at 1.5590 level. However, the double bottom attempt of the pair at 1.5590 levels could potentially push the pair upwards.
Expectations for the upcoming week (Nov 24th - Nov 28th):
At the time of analysis the pair is trading at 1.5654 close to the short term bullish trend line and all three of our MAs are sloping downwards both on H1, H4, D1 (daily), W1 (weekly) and MN (monthly) timeframes. Meanwhile there is uncertainty in our oscillators. On H4 timeframe RSI indicates short term bullish divergence, however it is still below the 50 line, meanwhile MACD’s trigger line broke above its bearish trend line, indicating potential bullish movements however it is still below its 0 trigger line.
That being said, we have continued bearish bias below 1.5600 psychological and weekly support levels towards long-term support of 1.5300; however may the bearish trend line (blue resistance line) be broken, double bottom pattern hold and fundamental developments support the price-action we may see the pair rising towards 1.58 and 1.59 levels.
Resistance levels: 1.5707(R1), 1.5830(R2), 1.5945 (R3) and 1.6039(MPP)
Support levels: 1.5590 (S1), 1.5430 (S2), 1.5300 (S3)
This market forecast is for general information only. It is not an investment advice or a solution to buy or sell securities.
Authors' opinions do not represent the ones of Orbex and its associates. Terms and Conditions and the Privacy Policy apply.
Trading foreign exchange on margin carries a high level of risk, and may not be suitable for all investors. Before deciding to trade foreign exchange, you should carefully consider your investment objectives, level of experience, and risk appetite. There is a possibility that you may sustain a loss of some or all of your investment and therefore you should not invest money that you cannot afford to lose. You should be aware of all the risks associated with foreign exchange trading, and seek advice from an independent financial advisor if you have any doubts.
Recommended Content
Editors’ Picks
EUR/USD regains traction, recovers above 1.0700

EUR/USD regained its traction and turned positive on the day above 1.0700 in the American session. The US Dollar struggles to preserve its strength after the data from the US showed that the economy grew at a softer pace than expected in Q1.
GBP/USD returns to 1.2500 area in volatile session

GBP/USD reversed its direction and recovered to 1.2500 after falling to the 1.2450 area earlier in the day. Although markets remain risk-averse, the US Dollar struggles to find demand following the disappointing GDP data.
Gold holds around $2,330 after dismal US data

Gold fell below $2,320 in the early American session as US yields shot higher after the data showed a significant increase in the US GDP price deflator in Q1. With safe-haven flows dominating the markets, however, XAU/USD reversed its direction and rose above $2,340.
XRP extends its decline, crypto experts comment on Ripple stablecoin and benefits for XRP Ledger

Ripple extends decline to $0.52 on Thursday, wipes out weekly gains. Crypto expert asks Ripple CTO how the stablecoin will benefit the XRP Ledger and native token XRP.
After the US close, it’s the Tokyo CPI

After the US close, it’s the Tokyo CPI, a reliable indicator of the national number and then the BoJ policy announcement. Tokyo CPI ex food and energy in Japan was a rise to 2.90% in March from 2.50%.

