
Global Macro Analysis is all about the fundamental forces in the economy and understanding what is currently driving prices and how can sentiment be affected moving forward. Every week in our analysis, we highlight the economic macro factors that affect global markets and also potential developments in the sphere of geo-politics, that are difficult to predict and estimate their potential impact, representing our “black swans”.
This week, as almost every Forex trader knows, all attention will be on the US FED and their decision regarding interest rates. After a long period of easing and low yields, it is now expected to have a shift in monetary policy and begin a normalization period of higher yields. But what makes this event unique is the “unprecedented uncertainty” that comes with it and we won’t have answers until Yellen gives her testimony shortly after the decision.
The sentiment is strongly in favor of an interest rate increase but what is going to be the pace after that? How “gradual” is “gradual”? Are we going to have an aggressive hiking cycle or a “dovish hiking” meaning that we are going indeed to have a hike but after that we will have a slow pace increase, probably depending on data and international developments.The difference between these two regimes is huge and it is going to have an important impact in the global financial markets, across all different assets.
Let’s have a look at the sentiment right now.After Friday’s close, you can see that the SKEW index is moving towards the higher levels in its range. According to CBOE, “the CBOE SKEW Index ("SKEW") is an index derived from the price of S&P 500 tail risk. Similar to VIX, the price of S&P 500 tail risk is calculated from the prices of S&P 500 out-of-the-money options. SKEW typically ranges from 100 to 150. A SKEW value of 100 means that the perceived distribution of S&P 500 log-returns is normal, and the probability of outlier returns is therefore negligible. As SKEW rises above 100, the left tail of the S&P 500 distribution acquires more weight, and the probabilities of outlier returns become more significant”.
Images courtesy of www.stockcharts.com
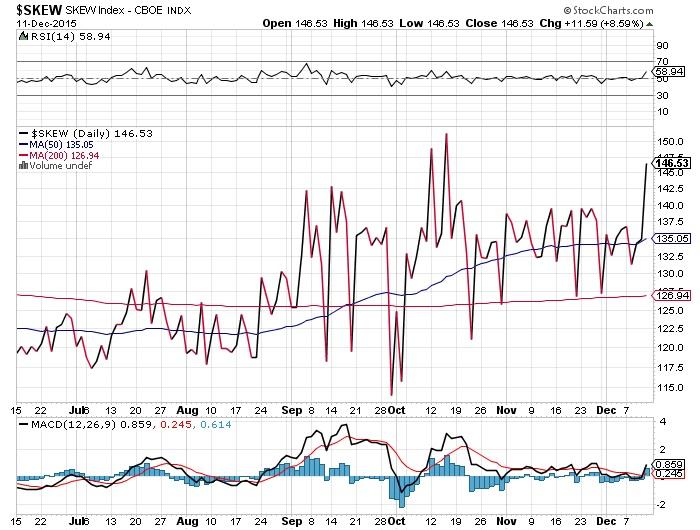
So we can see that SKEW after Friday’s close is at 146.50 very close to the highest level which is 150 which means that the probability of an extreme outlier event is very high.
Please keep in mind that we are talking about probable outcomes and not guaranteed events. So according to SKEW we have the right conditions for an extreme move outside the normal, usual sample, it is very likely to have a multiple sigma event, an outlier. In the financial crisis of the past at 2008-2009, the SKEW index was around these high levels again signaling the probability of an outlier, before the markets collapsed.
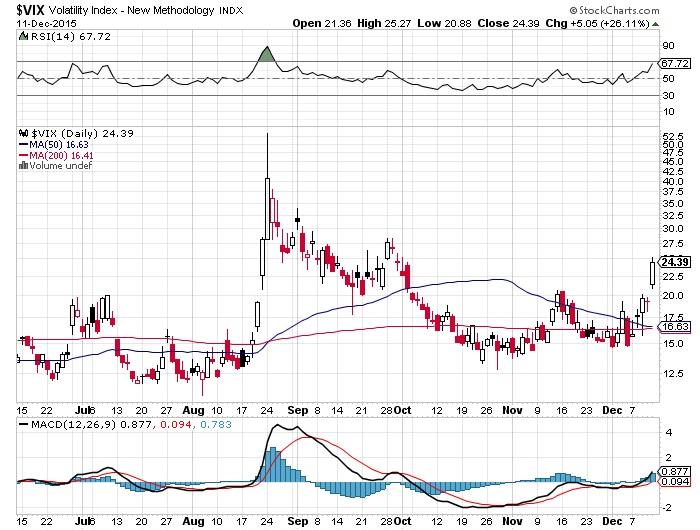
What is also important is that after Friday’s session the VIX, the volatility index, also known as the “fear index” is breaking to the upside, rather strongly, signaling that traders are concerned about FED’s decision and the potential impact in the markets.
Before we move on to the charts, let me show you another event, associated with what is currently going on, that can prove to be an important macro catalyst in the future.
Let me show you the impact of the potential rise in interest rates in the real economy. I was reading a story at Bloomberg that said and I quote: “Third Avenue Management LLC rattled credit markets this week when it said that a lack of liquidity had forced it to halt redemptions in its junk-bond mutual fund. Third Avenue, founded by value investor Martin Whitman, said on Dec. 9 that it was blocking clients in the Focused Credit Fund from pulling out its remaining $788 million in assets to avoid fire sales, so that the fund could beliquidated in an orderly fashion”.
Take a good look, what is happening to credit markets and especially Junk status and High Yield bonds, as yields in the US are expected to rise:
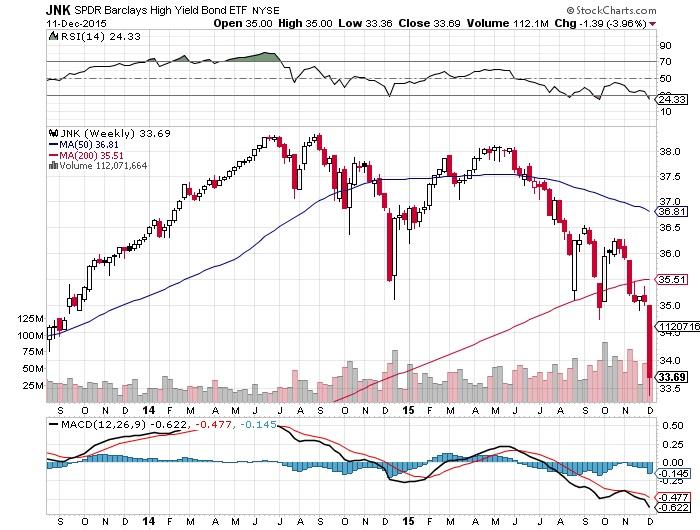
Junk bond prices are moving sharply lower and that already caused one big fund to halt redemptions, as they are concerned about the impact in the credit markets. In simple English imagine a market where there are no buyers but only sellers trying to get out and you get the picture.
That’s why this FED meeting is important, as itcan have a profound effect in the markets, as you can see from the SKEW and VIX indices as well.
Now, let’s take a look at some important charts and opportunities this week.
Equity traders concerned about the FED and also because of worries regarding growth in China are getting out, until things are clearer.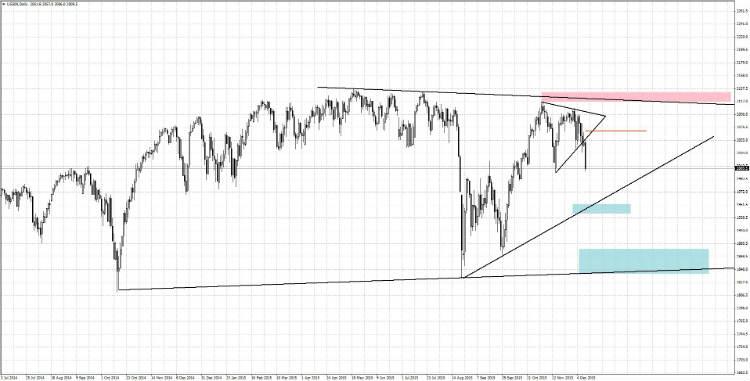
You can clearly see that we have moved outsidethe triangular pattern to the downside and our targets are highlighted by the light blue rectangles. We also mentioned in our previous analysis a couple of weeks ago that below 2070, as indicated by the orange line, we are becoming more aggressive sellers.
As Forex traders, it is important to study equity markets, as this helps us understand better the current regime, whether it is a risk-on or risk-off environment.
Currently, the sentiment is also negative in European equity markets, too.
DAX30 Index
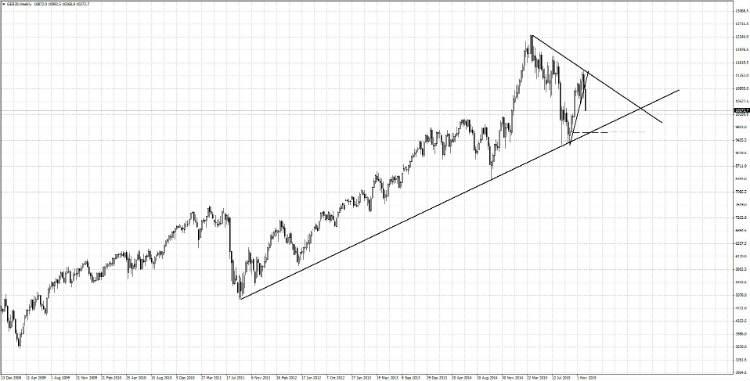
This is the weekly DAX chart. You can clearly see that after a test of previous highs, we have broken to the downside and we will soon test the rising trend-line of the larger trend. A move below 9800 and acceptance of these lower levels, increases the probability of a much stronger move lower.
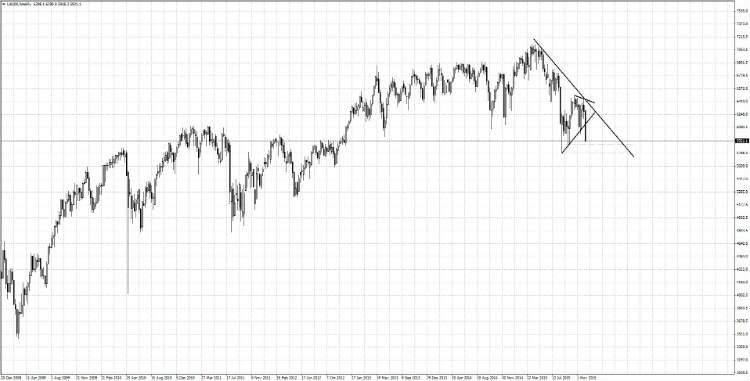
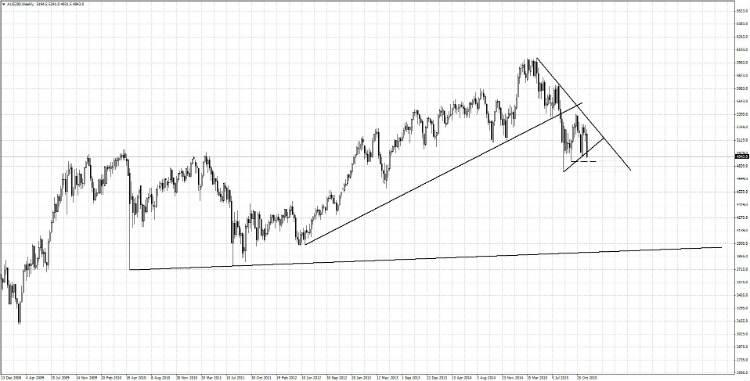
The same situation applies for the FTSE100, as well as the Australian Equity index. In both cases, a move and acceptance lower, with the appropriate fundamental background can lead to a significant down trend.
FTSE100 Index
AUS200 Index
USDCAD
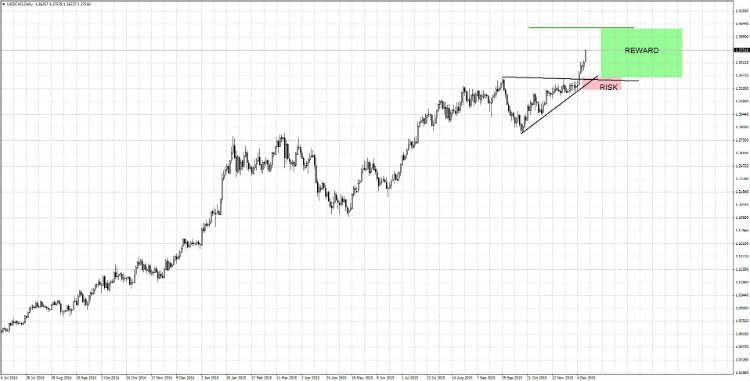
In Forex markets, we had issued a buy alert on the USDCAD a couple of weeks ago, because of the correlation of the CAD with Oil and the big drop in commodities. As you can see on the chart we had clearly defined our risk and our potential reward, around 1.4000. That was a high probability trade.
USDNOK
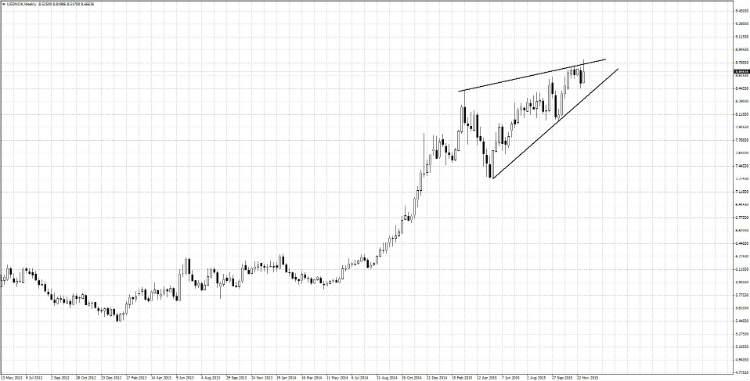
Next we see, USDNOK, as this triangular pattern can offer us another high probability trade depending on the fundamentals. There is not a valid signal yet but everything will depend on the FED’s meeting.
AUDUSD
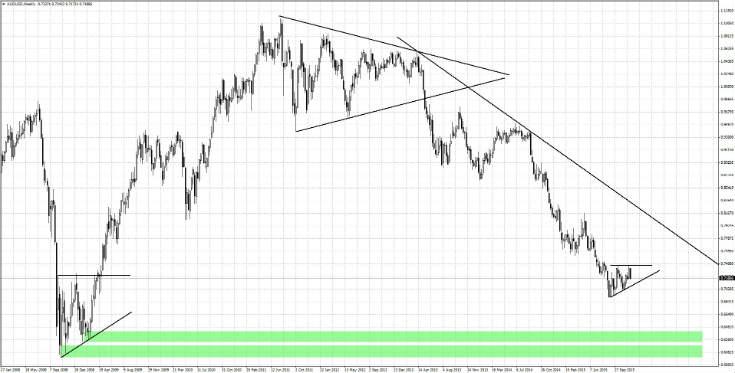
Let’s look at another pair that is also deeply affected by the commodities cycle. Here, you can see the weekly AUDUSD chart.The big drop is commodities, among other reasons, has driven this pair down and price is currently inside a triangular pattern waiting for a catalyst to breakout. This pair will also be very sensitive to the FED’s decision and is in our watchlist.
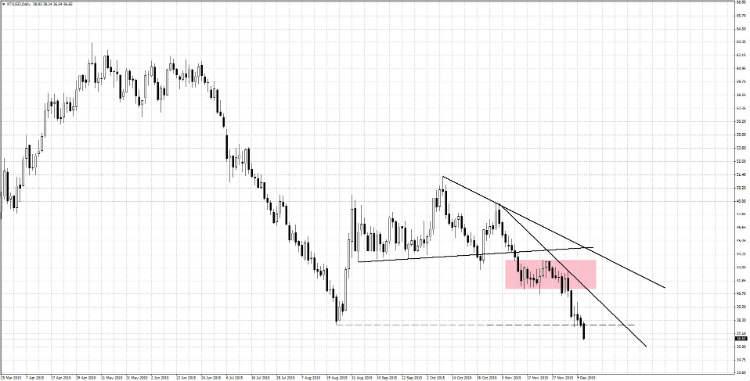
It would be very wise to monitor the impact ofthe FED’s decision on the commodities as well, if you are trying to identify the potential strength or weakness of commodity currencies such as AUD, NZD andCAD. The Oil chart will be very useful that will help us understand the current regime and who is in control.
Oil
Of course, the markets that will be moresensitive to the yields will be emerging markets and we will be paying great attention to emerging market currencies.
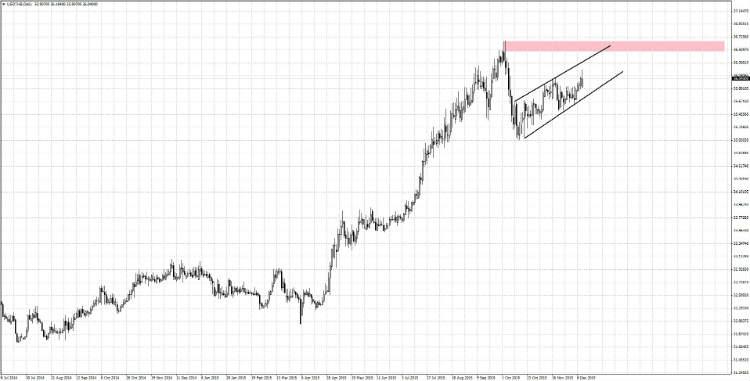
USDSGD
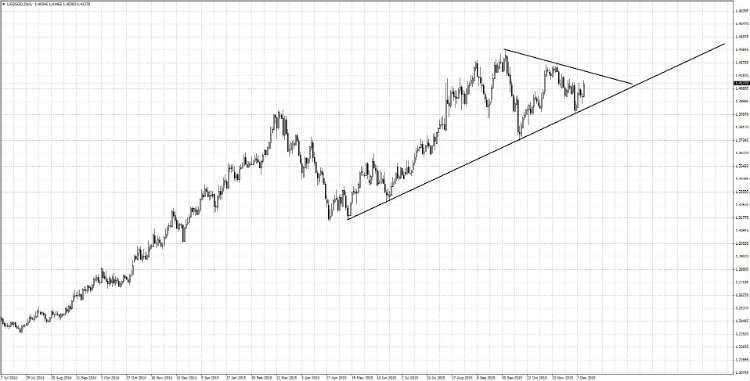
Our first pick is the Singaporean dollar, as the price currently sits inside a triangular pattern, which indicates the balance between buyers and sellers as they are eagerly waiting for the FED meeting. A hawkish tone and aggressive hiking will cause the USD to appreciate strongly, otherwise a “softer” tone, a “dovish” cycle will cause the USD to move lower.
USDTHB
The same situation applies for the Thai Baht.
EURUSD
Now, let’sturn to EURUSD. At the moment price is approximately in the middle of the bigger range and I have no interest to engage in a trade as I have no edge there. I am more interested to trade from the extremes of the balance as indicated by the pattern. This is also very sensitive to the FED’s decision andit can also turn out to be a choppy week for this pair. I would recommend to try to see the bigger picture for this pair and look beyond what happens only this week. Mario Draghi the Head of the ECB said a few days ago at the Economic Club of New York: “I can say therefore with confidence – and without any complacency – that we will secure the return of inflation to 2% without undue delay, because we are currently deploying tools that we believe will achieve this, and because we can, in any case, deploy our tools further if that proves necessary”.
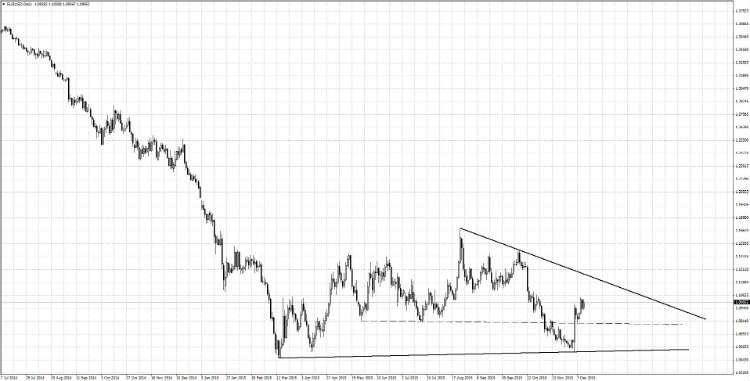
If he proves right I will be looking to buyabove the trend line around 1.1200 for a move towards 1.2000 as many people will be caught off guard. That is my longer term vision and the scenario I am focused.
GBPAUD and GBPNZD
Please also pay attention to the GBP against commodity currencies like the AUD and the NZD. The current price patterns can give us potentially some great trends but, all depends on fundamentals and the monetary policy dictated by the FED.
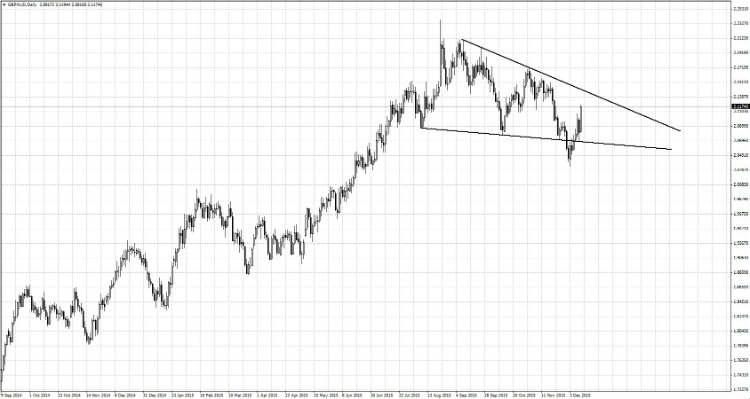
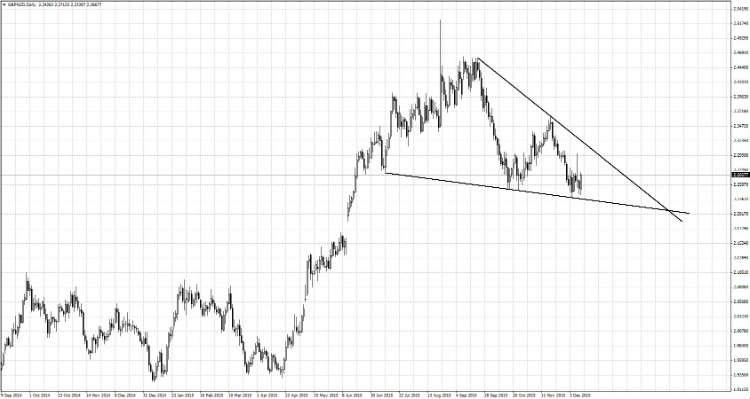
One thing to watch in the UK is the HousingMarket, as the IMF itself is warning about a Housing bubble and lower growth moving forward. They have suggested that the BOE should keep interest rates low because of the current situation and this can of course impact the GBP.
Thank you!
Fotis Papatheofanous,MBA.
None of the fotis trading academy nor its owners (expressly including but not limited to Marc Walton), officers, directors, employees, subsidiaries, affiliates, licensors, service providers, content providers and agents (all collectively hereinafter referred to as the “fotis trading academy ”) are financial advisers and nothing contained herein is intended to be or to be construed as financial advice
Fotis trading academy is not an investment advisory service, is not an investment adviser, and does not provide personalized financial advice or act as a financial advisor.
The fotis trading academy exists for educational purposes only, and the materials and information contained herein are for general informational purposes only. None of the information provided in the website is intended as investment, tax, accounting or legal advice, as an offer or solicitation of an offer to buy or sell, or as an endorsement, recommendation or sponsorship of any company, security, or fund. The information on the website should not be relied upon for purposes of transacting securities or other investments.
You hereby understand and agree that fotis trading academy, does not offer or provide tax, legal or investment advice and that you are responsible for consulting tax, legal, or financial professionals before acting on any information provided herein. “This report is not intended as a promotion of any particular products or investments and neither the fotis trading academy group nor any of its officers, directors, employees or representatives, in any way recommends or endorses any company, product, investment or opportunity which may be discussed herein.
The education and information presented hereinen is intended for a general audience and does not purport to be, nor should it be construed as, specific advice tailored to any individual. You are encouraged to discuss any opportunities with your attorney, accountant, financial professional or other advisor.
Your use of the information contained herein is at your own risk. The content is provided ‘as is’ and without warranties of any kind, either expressed or implied. The fotis trading academy disclaims all warranties, including, but not limited to, any implied warranties of merchantability, fitness for a particular purpose, title, or non-infringement. The fotis trading academy does not promise or guarantee any income or particular result from your use of the information contained herein. The fotistrainingacademy.com assumes no liability or responsibility for errors or omissions in the information contained herein.
Under no circumstances will the fotis trading academy be liable for any loss or damage caused by your reliance on the information contained herein. It is your responsibility to evaluate the accuracy, completeness or usefulness of any information, opinion, advice or other content contained herein. Please seek the advice of professionals, as appropriate, regarding the evaluation of any specific information, opinion, advice or other content.
Marc Walton, a spokesperson of the fotis trading academy, communicates content and editorials on this site. Statements regarding his, or other contributors’ “commitment” to share their personal investing strategies should not be construed or interpreted to require the disclosure of investments and strategies that are personal in nature, part of their estate or tax planning or immaterial to the scope and nature of the fotis trading academy philosophy.
All reasonable care has been taken that information published on the Fotis trading academy website is correct at the time of publishing. However, the Fotis trading academy does not guarantee the accuracy of the information published on its website nor can it be held responsible for any errors or omissions.
Recommended Content
Editors’ Picks
EUR/USD climbs to 10-day highs above 1.0700

EUR/USD gained traction and rose to its highest level in over a week above 1.0700 in the American session on Tuesday. The renewed US Dollar weakness following the disappointing PMI data helps the pair stretch higher.
GBP/USD extends recovery beyond 1.2400 on broad USD weakness

GBP/USD gathered bullish momentum and extended its daily rebound toward 1.2450 in the second half of the day. The US Dollar came under heavy selling pressure after weaker-than-forecast PMI data and fueled the pair's rally.
Gold rebounds to $2,320 as US yields turn south

Gold reversed its direction and rose to the $2,320 area, erasing a large portion of its daily losses in the process. The benchmark 10-year US Treasury bond yield stays in the red below 4.6% following the weak US PMI data and supports XAU/USD.
Here’s why Ondo price hit new ATH amid bearish market outlook Premium

Ondo price shows no signs of slowing down after setting up an all-time high (ATH) at $1.05 on March 31. This development is likely to be followed by a correction and ATH but not necessarily in that order.
Germany’s economic come back

Germany is the sick man of Europe no more. Thanks to its service sector, it now appears that it will exit recession, and the economic future could be bright. The PMI data for April surprised on the upside for Germany, led by the service sector.