Keeping score is sometimes a difficult thing. Millions of Americans cheered when bowling alleys mercifully automated the accounting for strikes, spares and splits. Tennis confuses some people: why are the first and second points in a game worth 15 and the third worth 10? With tallies above the line and below the line, bridge makes it hard to get to the bottom line.
But all these pale in comparison to the challenge of projecting the bottom line in a public budget. Economic trends and economic policies, which are difficult to evaluate, drive revenues and expenses. Past patterns may not be a good guide to future performance, and there are countless interdependencies among variables. In a sense, fiscal projections are a nexus for all the horrors forecasters face.
Nonetheless, the outcomes of these exercises are critically important. Will health care bankrupt the American economy? Should Greece pursue growth or austerity? How big is the deficit in a public pension system? The answers to all these weighty questions rest on some very fuzzy math.
There are two stages to fiscal forecasting. The first requires establishing a baseline, which depicts the most likely path of inflows and outflows using the laws and policies currently in effect. The process requires assumptions about economic and market progress during the study period.
Unfortunately, many of the most-pressing issues in public finance play out over a decade or longer because of the government’s provision of retirement benefits and health care. Potential forecast inaccuracies are compounded as each year passes.
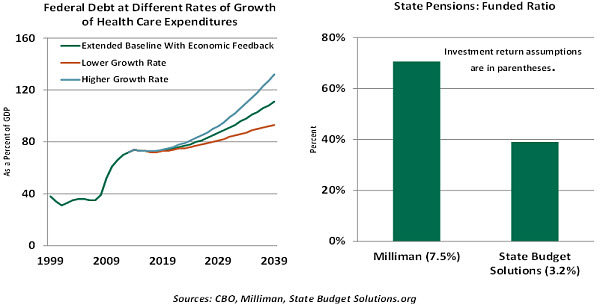
Two interesting illustrations are shown above. The retirement of the post-war generation will prompt a shift from private to public medical coverage for many Americans. Demographics, combined with inflation in the cost of care, threaten to produce significant increases in the U.S. federal deficit. But health care inflation has been moderating of late; each 0.75% drop in annual escalation reduces the projected government debt by more than $500 billion over the next decade.
The second centers around rate-of-return assumptions for public pension systems. Many states, counties and cities face shortfalls between expected returns and expected benefit payments in their plans, with little time to close the gaps before the baby boom retirement boom begins in earnest. The size of these deficiencies is dependent on the expected return on assets in the plan. Without getting into the thorny question of what is reasonable in this arena, the funded ratio of a defined benefit plan is incredibly sensitive to this particular parameter.
 The challenges for forecasters only increase as we move to the second element of the exercise –evaluating how policy changes might affect the outcome. Calculating the impact of proposed measures on public budgets is referred to as “scoring.” Oftentimes, measures are scored exclusively on the direct impact that they might have on revenue or spending; under this simple rubric, a tax cut would be viewed as increasing the deficit.
But the hope of those who support lower taxes is that it would generate increased levels of economic growth, broadening the tax base and producing additional revenue. To capture this, some are advocating “dynamic” scoring to evaluate economic policies. The dynamic part refers to indirect after-effects that might be captured to make the analysis more comprehensive.
The case for a more-dynamic approach might be found in the plight of Greece, which recently elected a new prime minister who aims to turn away from austerity. The projections done by Greece’s creditors seemed to underestimate the deleterious effect that budget cuts would have on growth, leading to a painful contraction that contributed to the recent political turnaround.
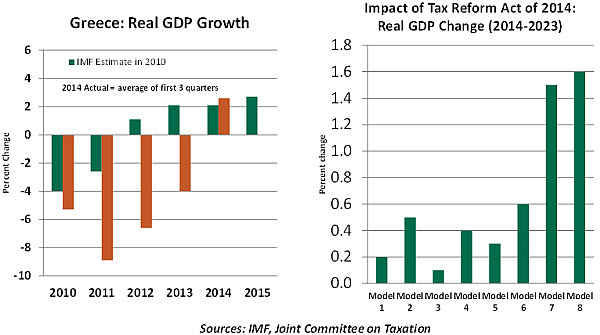
Dynamic scoring might have revealed that austerity that is too extreme damages the tax base to a point that hinders the quest for budget balance.
 While theoretically meritorious, performing this expanded accounting is extraordinarily difficult. For example, if taxes are cut, the heightened level of activity could threaten to become inflationary. In that event, the central bank might tighten monetary policy to cool things down, which would restrain the tax base.
This may seem hard to follow, but this is a simple depiction of a much more intricate string of causes and effects that can take many years to evolve. Even if the direction of these influences is known, their magnitudes are very difficult to estimate with precision. Different models may come up with vastly different conclusions, as shown in the chart above examining the tax reform proposal that Congress considered last year.
Opponents of dynamic scoring cite this uncertainty as a reason to continue with the simpler approach. There is also valid concern that the analyst’s political leanings may steer the assumptions used to evaluate policies dynamically.
Many governmental entities around the world are being challenged to establish their long-term solvency. Getting the scoring right will be essential to the integrity of these efforts. This is no game; world markets have a lot riding on the outcome.
A Round of Cuts
The announcements out of the Swiss National Bank (SNB) and European Central Bank (ECB) in the last couple of weeks initiated a chain of similar moves from other central banks. Some observers worry that the easing cycle might spin out of control. Yet, thus far, the initial round of reactions has been measured.
Part of the calm is most likely due to the fact that while larger than expected, the ECB’s quantitative easing (QE) program was long-awaited, and the announcement was carefully staged with several leaks in the days prior. This foreshadowing was a welcome change from the abrupt move seen in Switzerland a week earlier.
Central bank actions in the aftermath of the SNB and ECB announcements can be divided into two camps: those that must react to the ECB movements and those that are acting mainly as a result of domestic factors.
In the first camp are countries that try to sustain a peg to other currencies. Denmark has maintained a peg since 1982, and so Denmark’s Nationalbank has responded to Danish krone appreciation by cutting its deposit rate 45 basis points over the course of three rate decisions in the last two weeks. The Danish have the tools and balance sheet space to maintain the peg.
Several other areas, including Saudi Arabia and Hong Kong, have currency pegs. Both are pegged to the U.S. dollar and have shown few signs of stress. In the Saudi case, the riyal is hard pegged at 3.75/USD. The HK$ is currently pegged at $7.80 to the US$1. The arrangement requires the Hong Kong dollar monetary base to be 100% backed – and changes in it to be 100% matched – by corresponding changes in U.S. dollar reserves held in the Exchange Fund.
Recommended Content
Editors’ Picks
AUD/USD hovers around 0.6500 amid light trading, ahead of US GDP

AUD/USD is trading close to 0.6500 in Asian trading on Thursday, lacking a clear directional impetus amid an Anzac Day holiday in Australia. Meanwhile, traders stay cautious due ti risk-aversion and ahead of the key US Q1 GDP release.
USD/JPY finds its highest bids since 1990, near 155.50

USD/JPY keeps breaking into its highest chart territory since June of 1990 early Thursday, testing 155.50 for the first time in 34 years as the Japanese Yen remains vulnerable, despite looming Japanese intervention risks. Focus shifts to Thursday's US GDP report and the BoJ decision on Friday.
Gold price treads water near $2,320, awaits US GDP data

Gold price recovers losses but keeps its range near $2,320 early Thursday. Renewed weakness in the US Dollar and the US Treasury yields allow Gold buyers to breathe a sigh of relief. Gold price stays vulnerable amid Middle East de-escalation, awaiting US Q1 GDP data.
Injective price weakness persists despite over 5.9 million INJ tokens burned
Injective price is trading with a bearish bias, stuck in the lower section of the market range. The bearish outlook abounds despite the network's deflationary efforts to pump the price. Coupled with broader market gloom, INJ token’s doomed days may not be over yet.
Meta Platforms Earnings: META sinks 10% on lower Q2 revenue guidance Premium

This must be "opposites" week. While Doppelganger Tesla rode horrible misses on Tuesday to a double-digit rally, Meta Platforms produced impressive beats above Wall Street consensus after the close on Wednesday, only to watch the share price collapse by nearly 10%.