Weekly Chart Analysis – 4th April 2016
Weekly chart analysis covers EURUSD, GBPUSD, AUDUSD.
The report looks at the daily and intraday charts to gauge the price action behaviour.
Weekly Market Risk Events:
Monday, April 4th @ 2:30 am: - AUD - Retail Sales m/m
Monday, April 4th @ 9:30 am: - GBP - Construction PMI
Tuesday, April 5th @ 2:30 am: - AUD - Trade Balance
Tuesday, April 5th @ 5:30 am: - AUD - RBA Rate Statement
Tuesday, April 5th @ 9:30 am: - GBP - Services PMI
Tuesday, April 5th @ 1:30 pm: - CAD - Trade Balance
Tuesday, April 5th @ 1:30 pm: - USD - Trade Balance
Tuesday, April 5th @ 3:0 pm: - USD - ISM Non-Manufacturing PMI
Tuesday, April 5th @ Tentative: - NZD - GDT Price Index
Wednesday, April 6th @ 7:0 pm: - USD - FOMC Meeting Minutes
Thursday, April 7th @ Tentative: - EUR - ECB President Draghi Speaks
Thursday, April 7th @ 10:30 pm: - USD - Fed Chair Yellen Speaks
Friday, April 8th @ 1:15 pm: - USD - FOMC Member George Speaks
Friday, April 8th @ 9:30 am: - GBP - Manufacturing Production m/m
Friday, April 8th @ 1:30 pm: - CAD - Employment Change
Price charts and Daily setupsEURUSD
EURUSD: 30min - 4h - Daily view
It was a good week for EURUSD and US Dollar’s bears. The week started with almighty Janet Yellen delivering very dovish statement on Tuesday night. It’s fair to say that she set the top for the Dollar. Markets reacted swiftly and US Dollar sold off against major currencies. Looking at FED WATCH, we notice traders downgraded probabilities of raising interest rates in year across the board. Having said that, this might yet to change. Friday’s NFP and Earnings printed above expectations. This could spark some hawkishness at the next FOMC. At the same time, Dollar failed to rally after excellent news.
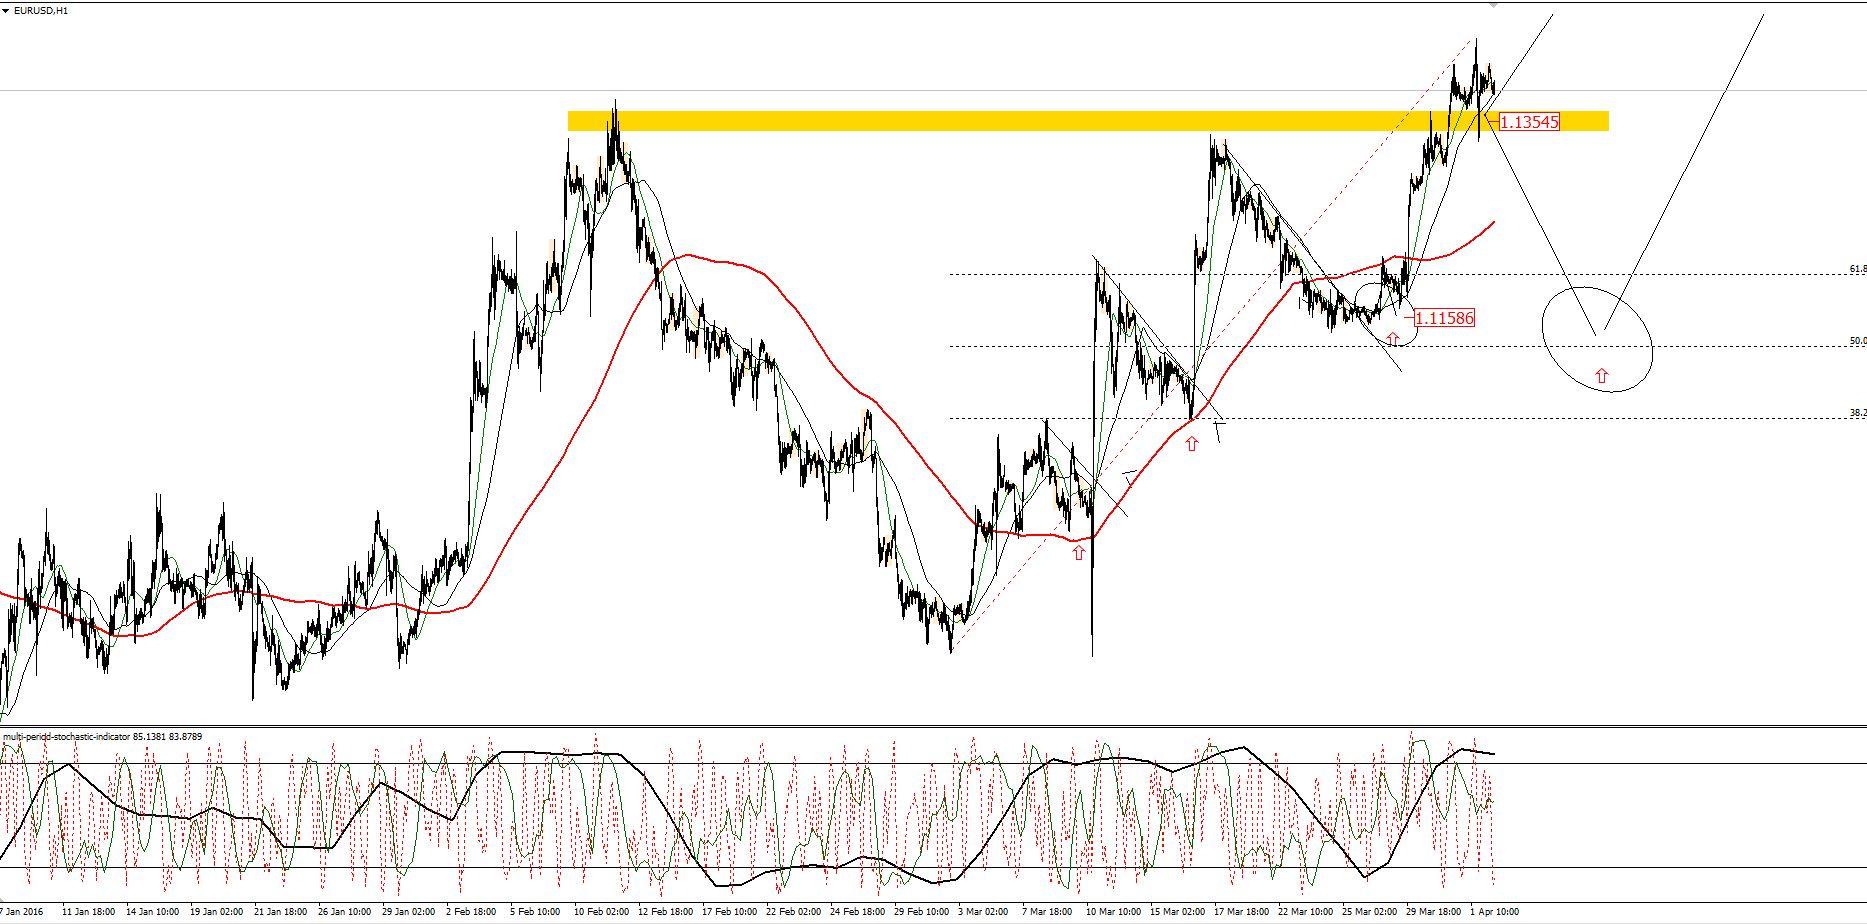
Looking at the technical picture. EURUSD, as expected moved firmly higher. The pair started the week just above 1.11 to finish it at 1.1390 (after making highs of 1.1430).
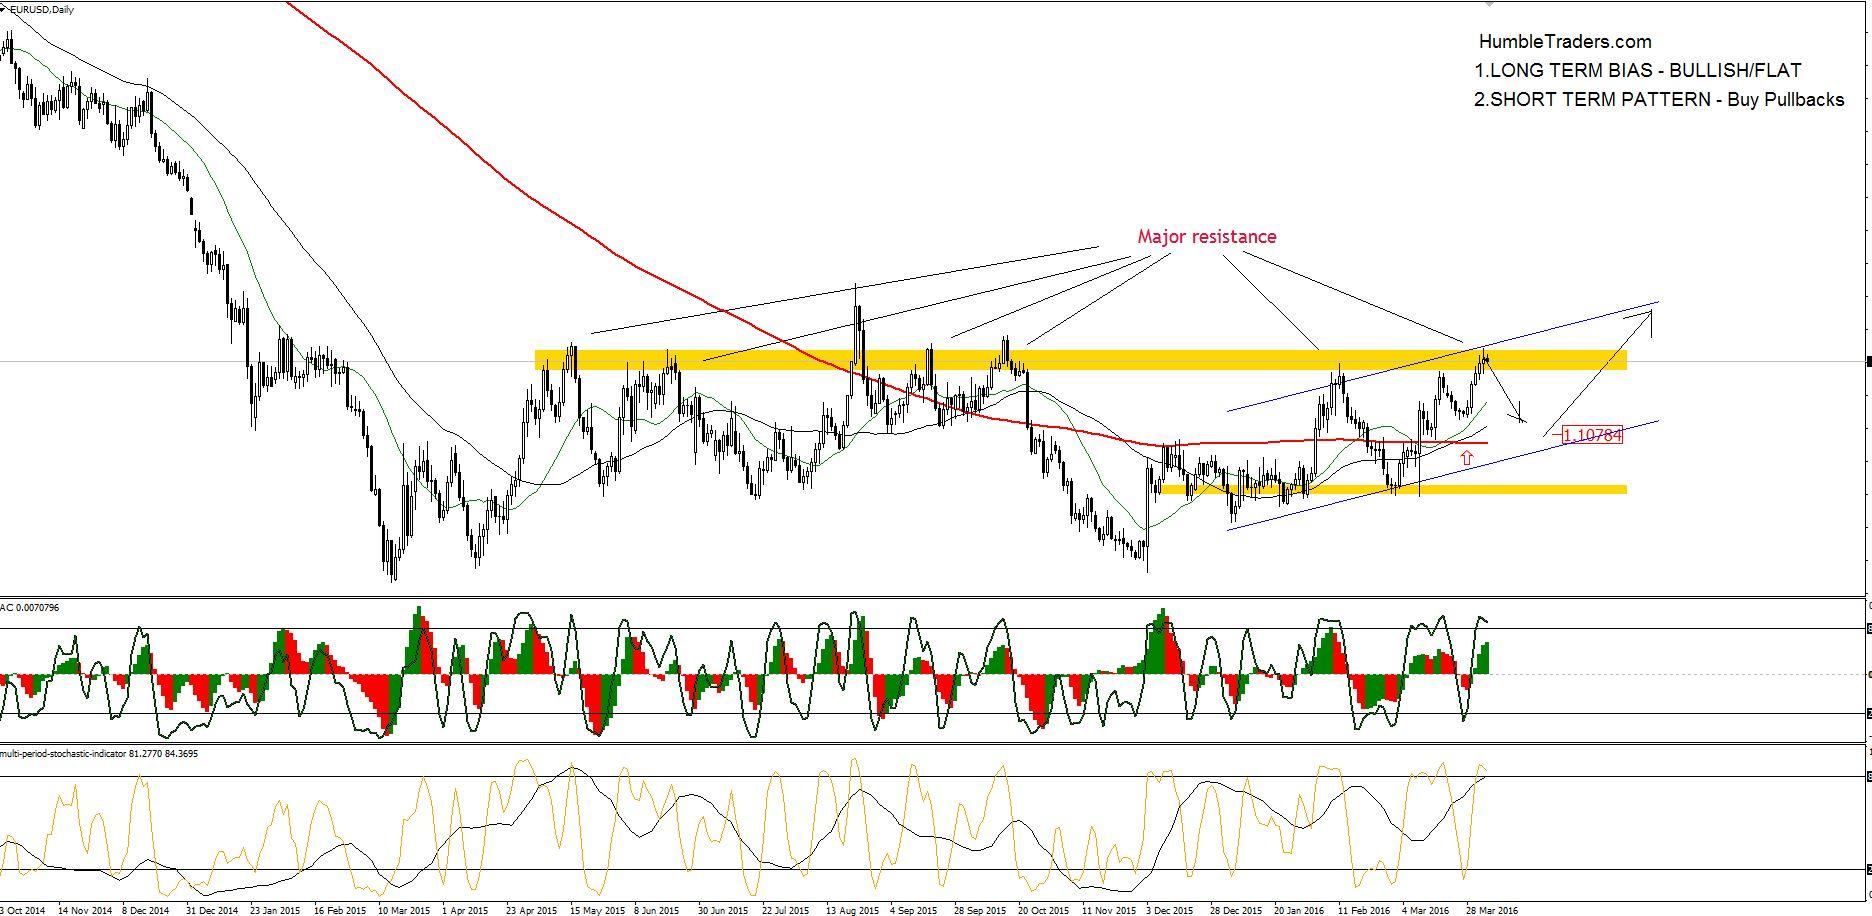
The pair is now at the major resistance zone and the psychological level of 1.14. The resistance has proven to be very responsive in the past. There is a chance that traders will seek this level to bulk in orders and EURUSD will refuse it once again.
This could play out once again.
I am bullish to flat in this market. Commitments of traders don’t show bullishness yet but Yellen’s statement and lack of rally after good Earnings, could spark another flood of Dollar shorts.
The most likely scenario would to buy EURUSD on pullbacks.
BEARS
The pair has developed the pattern of coming off the high at the beginning of the week and making new highs towards the end of the week.
As the pair is within the major resistance zone, bears could look for the short reversal setup from the current levels.
My preference would be to look at the stochastic oscillator on daily charts and seek a daily engulfing candle. Please read Stochastic Oscillator guide to maximise usage of this indicator
Daily stochastics show overbought levels and the last daily candle looks like a good beginning of the reversal pattern.
The correction could be as deep as 1.11 before another leg up would resume.
BULLS
There is no clear pattern for bulls. Those who entered longs earlier in the week should move stops up and hold onto all long positions.
I would expect EURUSD to come off the highs and form some sorts of reversal pattern first.
Fib retracements level suggest (again) 1.1150 as a good long entry.
From the other hand, the price could move aggressively higher after making only small correction. Let’s see how it prints today
EURUSD Daily View

EURUSD
30 min -1h view
GBPUSD
GBPUSD: 30min - 4h - Daily view
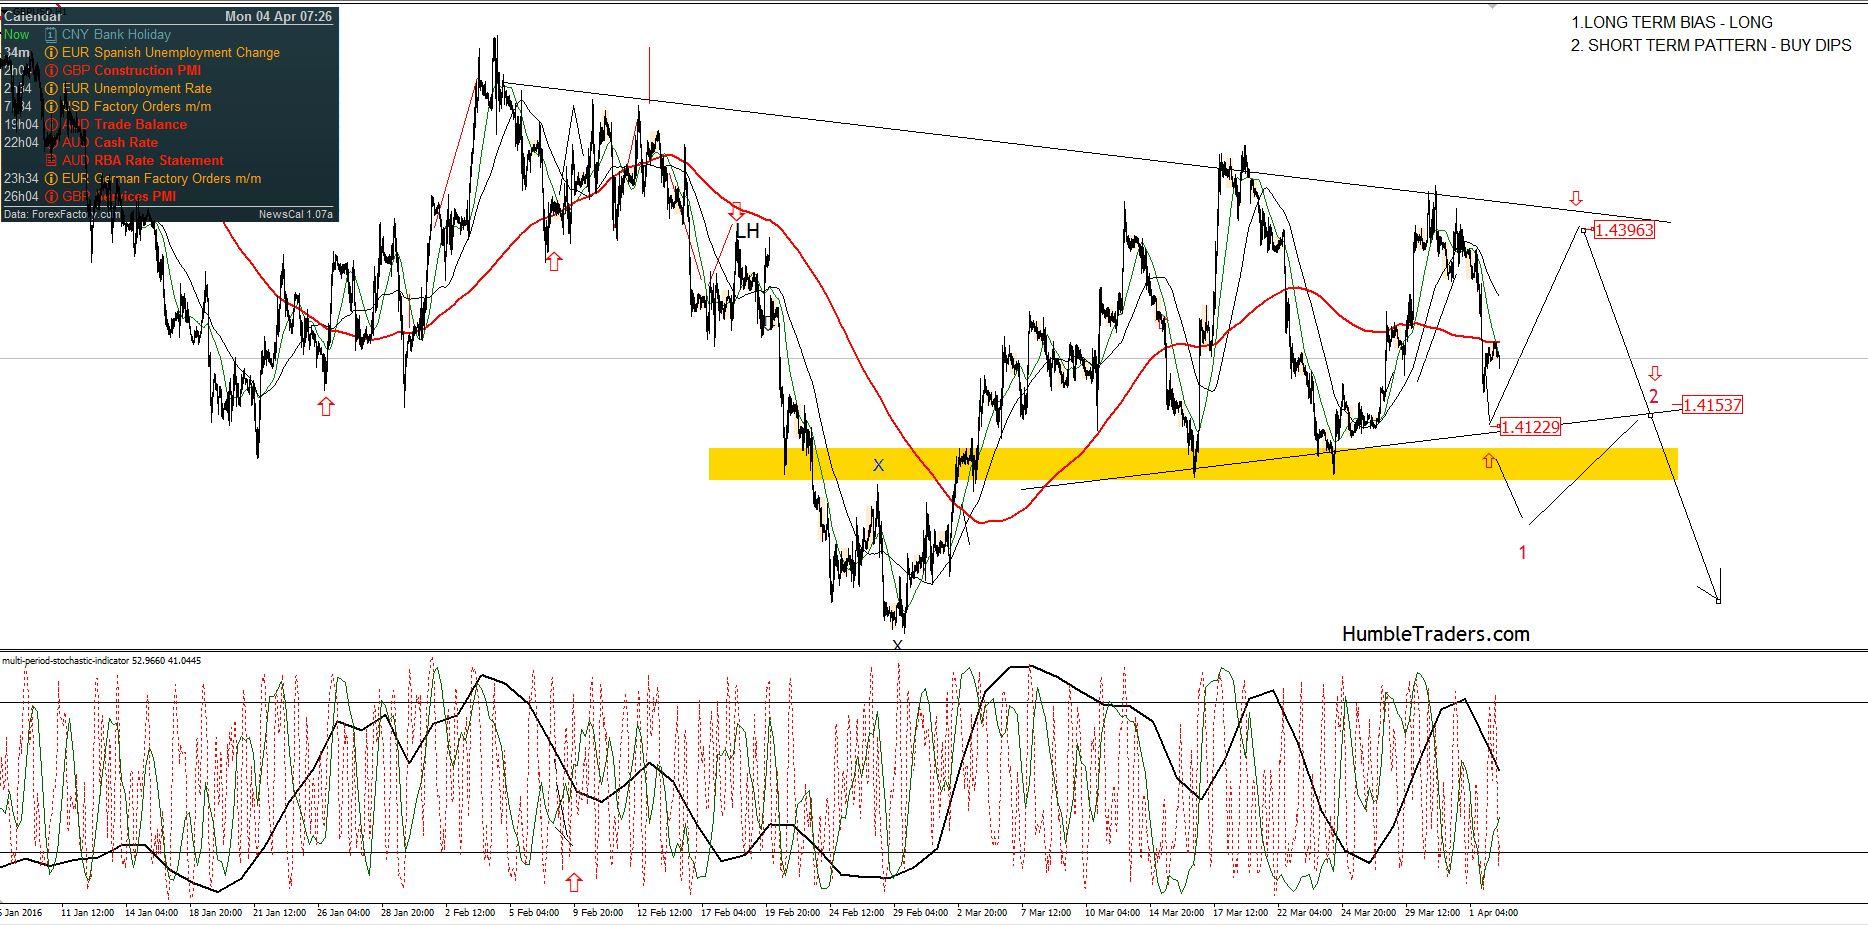
Cable, also as expected, reversed from the major support as indicated in the last week’s analysis. GBPUSD moved from 1.4050 towards 1.4450 and closed the week at 1.4222, giving up most of the gains. I managed to close some of that rally see GBPUSD short trade setup
I still see cable to be a rather bearish case in the short to midterm. There is no indication from the Commitments of traders that markets are turning bullish yet. The double bottom at 1.3850 could be possible in the next few weeks.
Looking at the technical picture, GBPUSD if forming a consolidation patter around the current levels. The pair has been very volatile recently and printed high daily ranges. I expect this patter to continue with the bearish outlook in mind.
BULLS
I expect cable to range trade. The pair could continue toward lower band of the triangle (see screenshot below). 1.4120 could prove to be a good entry for bulls. I advise to get on the smaller time frame and seek a reversal patter first.
BEARS
Bears could have more opportunities to play. The pair could retrace towards the upper border before printing lower again. Bears could seek a short setup around 1. 4400.If Cable starts the weeks with lower prices, bears should wait for the break 1.4130, after the price pulls back from (1) towards 1.4150, shorts could be established again.
GBPUSD Daily View
GBPUSD
15-30 min view
AUDUSD
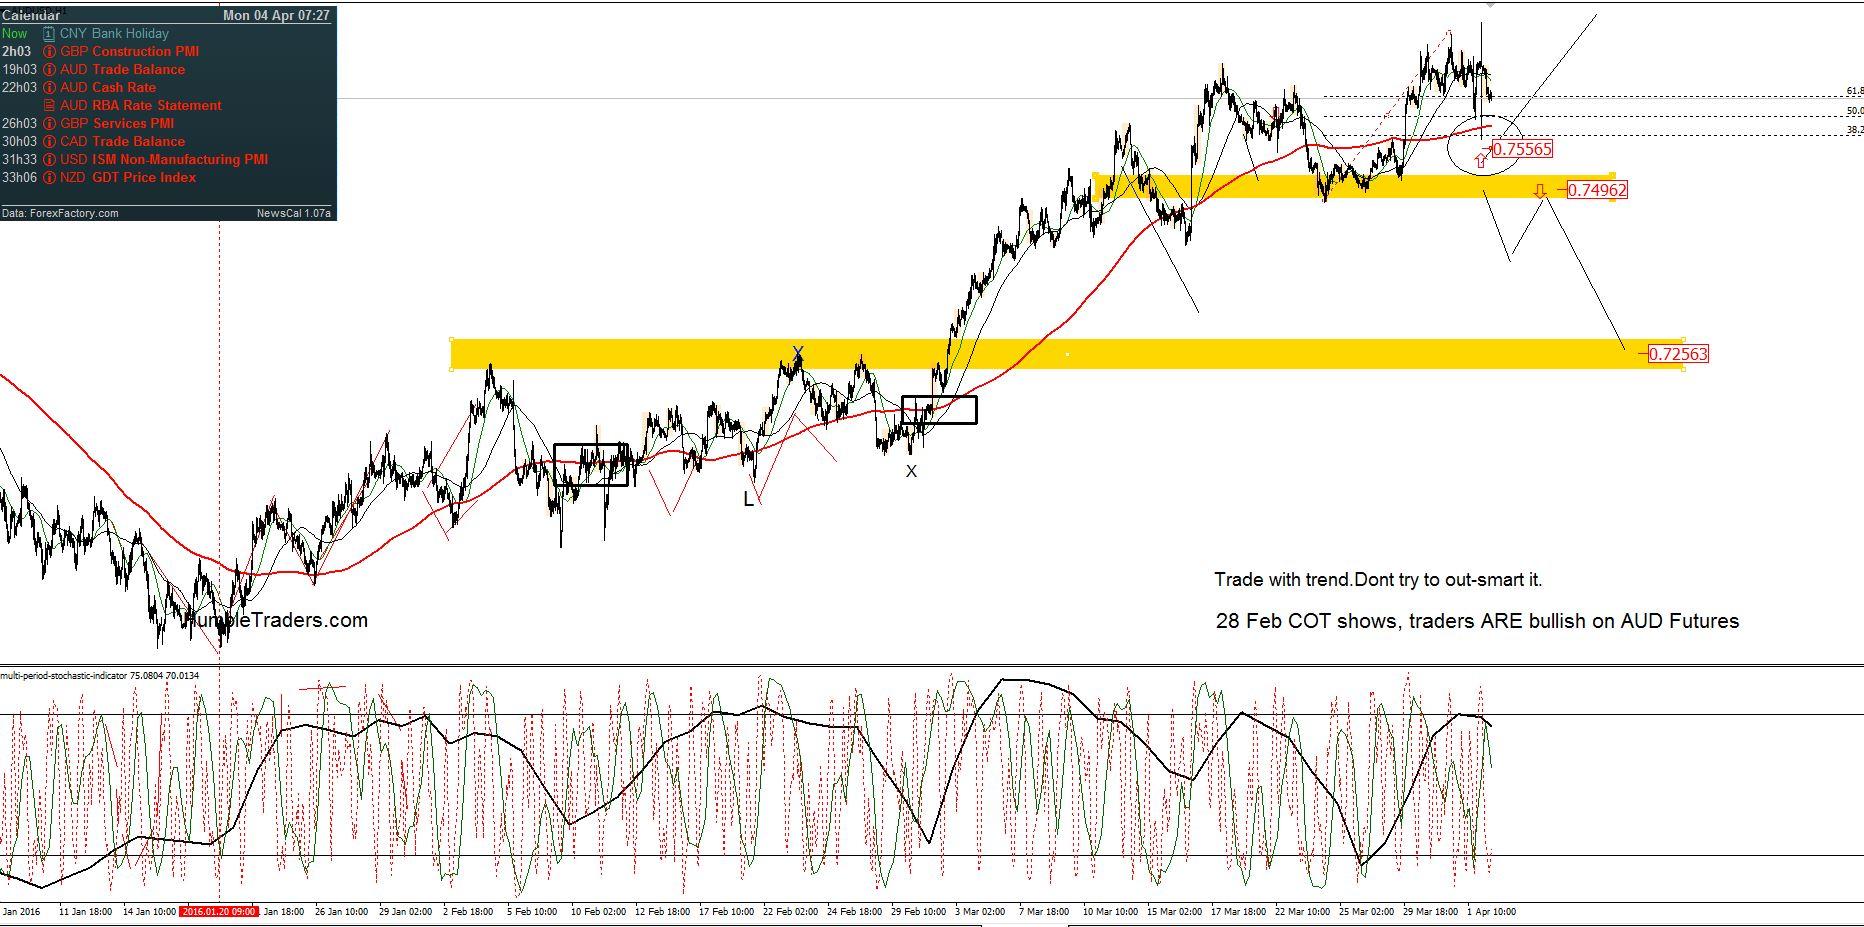
AUDUSD: 30min - 4h - Daily view
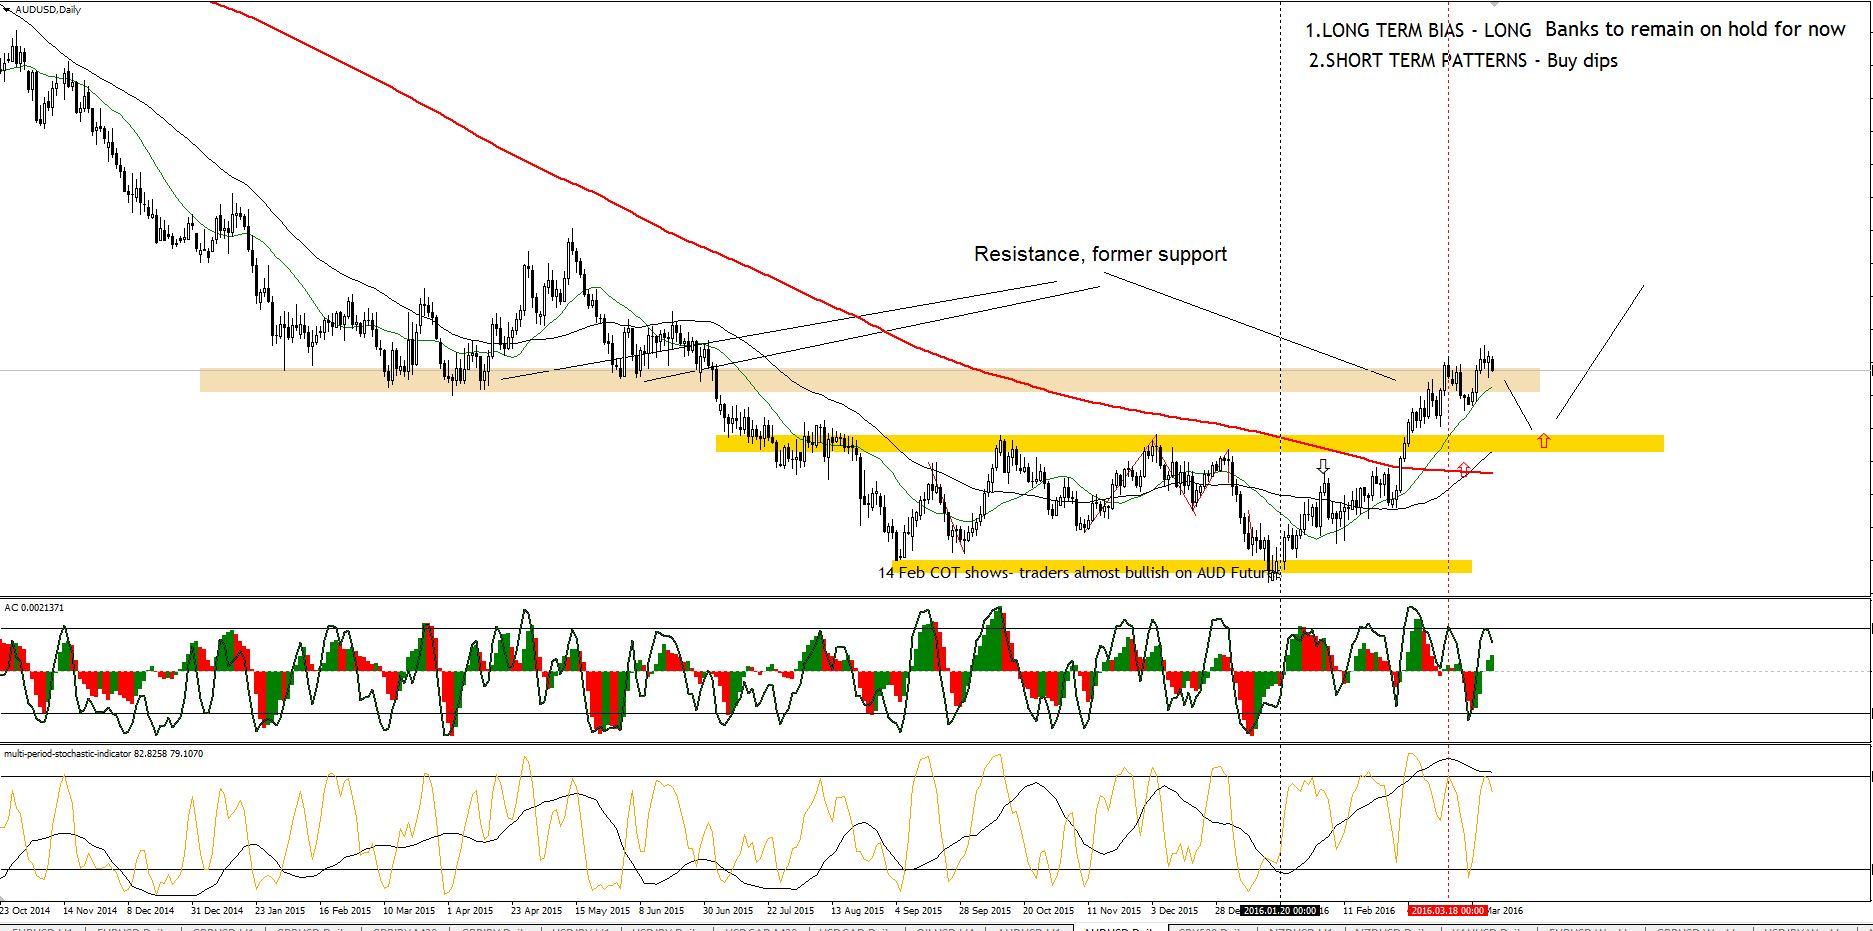
Aussie keeps printing higher. I was expecting some kind of correction from the resistance at 0.7600, but AUDUSD printed another high after a minor correction. I am strongly bullish in this market. This is firmly confirmed by Commitments of Traders report. My strategy will be buying on pull backs.
At the moment, this pair is strongly overbought (technically speaking) but the price action looks like we will see new highs pretty quickly.
After Friday’s NFP, Aussie printed lower but recovered all losses within few hours. This indicates to me, that the buying might continue into new week.
BEARS
The correction from the major resistance scenario is still valid. We should see some pull back from the current levels at some point. Bears should look for daily engulfing candle first to consider shorts. I would like to wait and see how the price will develop in the coming days. The 0.7500 should be broken to the downside first. If this is the case and the price pulls back to 0.75, bears could have some short opportunities there
BULLS
Given the recent aggressive buying, I would expect only small corrections in play. This is assuming that the market will move up.
0.7560 seems like a good level to buy (see the screenshot below). This is 38.2% Fib retracement from the recent leg up.
AUDUSD Daily View
AUDUSD
15-30 min view
Trading in Forex Exchange Market is VERY SPECULATIVE AND HIGHLY RISKY and is not suitable for all members of the general public but only for those investors who: (a) understand and are willing to assume the economic, legal and other risks involved. (b) Taking into account their personal financial circumstances, financial resources, life style and obligations are financially able to assume the loss of their entire investment. (c) Have the knowledge to understand Forex Exchange Market and the underlying assets.
Recommended Content
Editors’ Picks
EUR/USD consolidates recovery below 1.0700 amid upbeat mood

EUR/USD is consolidating its recovery but remains below 1.0700 in early Europe on Thursday. The US Dollar holds its corrective decline amid a stabilizing market mood, despite looming Middle East geopolitical risks. Speeches from ECB and Fed officials remain on tap.
GBP/USD advances toward 1.2500 on weaker US Dollar

GBP/USD is extending recovery gains toward 1.2500 in the European morning on Thursday. The pair stays supported by a sustained US Dollar weakness alongside the US Treasury bond yields. Risk appetite also underpins the higher-yielding currency pair. ahead of mid-tier US data and Fedspeak.
Gold appears a ‘buy-the-dips’ trade on simmering Israel-Iran tensions

Gold price attempts another run to reclaim $2,400 amid looming geopolitical risks. US Dollar pulls back with Treasury yields despite hawkish Fedspeak, as risk appetite returns.
Manta Network price braces for volatility as $44 million worth of MANTA is due to flood markets

Manta Network price is defending support at $1.80 as multiple technical indicators flash bearish. 21.67 million MANTA tokens worth $44 million are due to flood markets in a cliff unlock on Thursday.
Investors hunkering down

Amidst a relentless cautionary deluge of commentary from global financial leaders gathered at the International Monetary Fund and World Bank Spring meetings in Washington, investors appear to be taking a hiatus after witnessing significant market movements in recent weeks.