![]() Yann Quelenn
Yann Quelenn
Swissquote Bank Ltd
Are you trading today? Read the Forex Trading Strategies for the Day.
EUR/USD
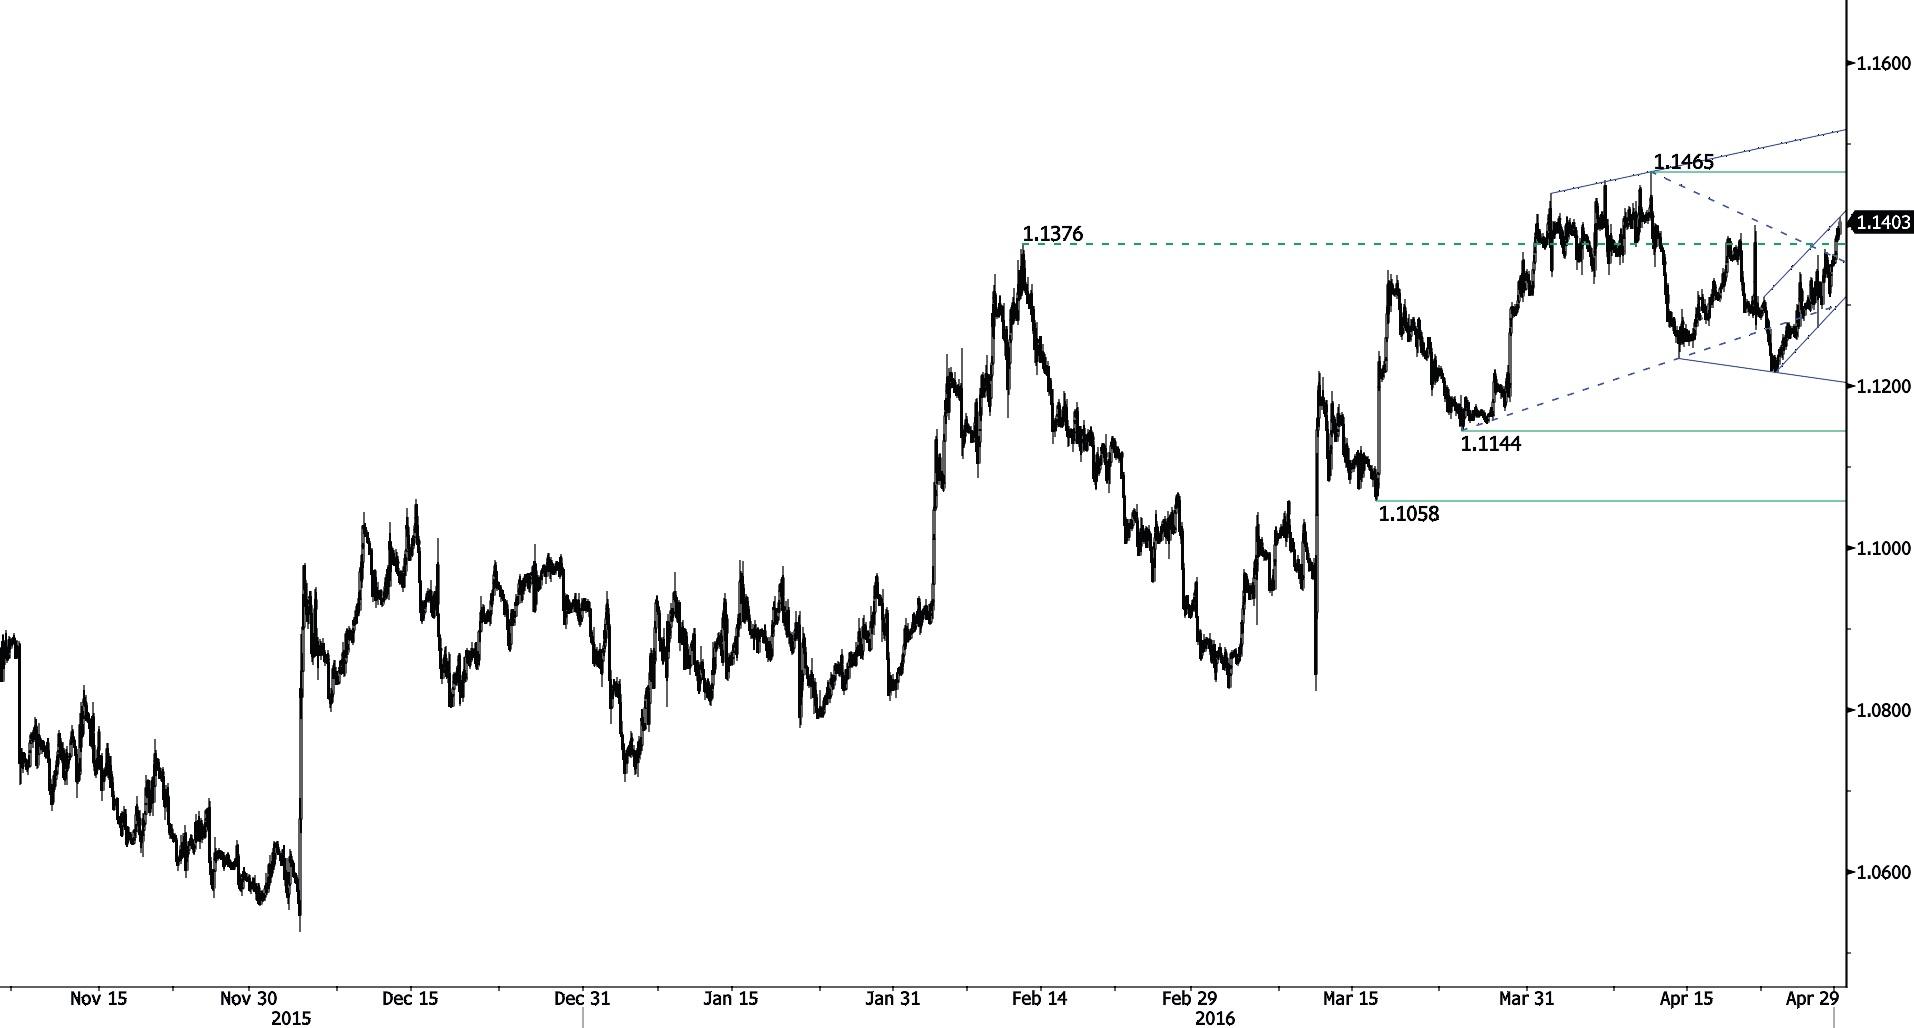
Bullish breakout.
-
EUR/USD has exited downtrend channel. Hourly support is located at 1.1217 (25/041/2016 low) and stronger support can be found at 1.1144 (24/03/2016 low). Hourly resistance can be found at 1.1465 (12/04/2016 high). Expected to show further move towards resistance at 1.1465.
-
In the longer term, the technical structure favours a bearish bias as long as resistance at 1.1746 ( holds. Key resistance is located at 1.1640 (11/11/2005 low). The current technical appreciation implies a gradual increase.
GBP/USD
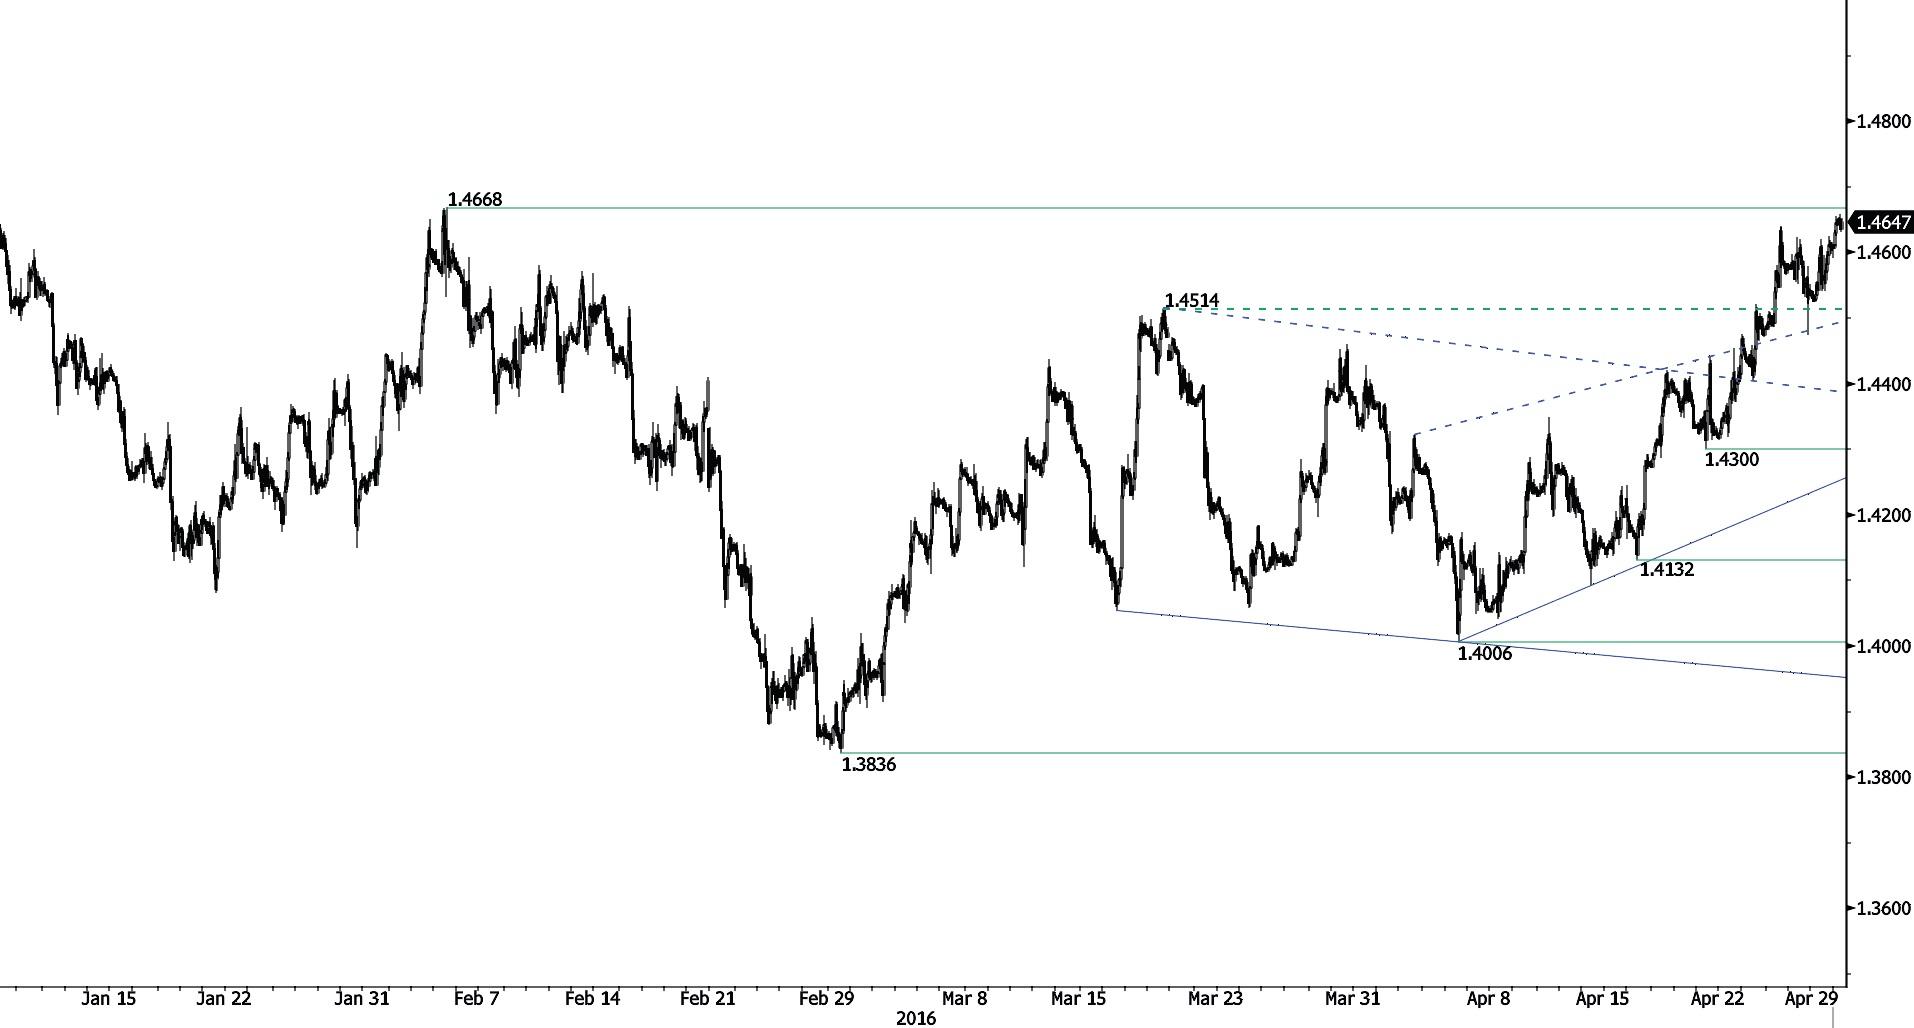
Bouncing from resistance at 1.4668.
-
GBP/USD has failed at the moment to reach resistance at 1.4668 (04/02/2016 high). Hourly support is given at 1.4475 (27/04/2016 high). Expected to show further another upside move toward resistance at 1.4668 (04/02/2016 high).
-
The long-term technical pattern is negative and favours a further decline towards key support at 1.3503 (23/01/2009 low), as long as prices remain below the resistance at 1.5340/64 (04/11/2015 low see also the 200 day moving average). However, the general oversold conditions and the recent pick-up in buying interest pave the way for a rebound.
USD/JPY
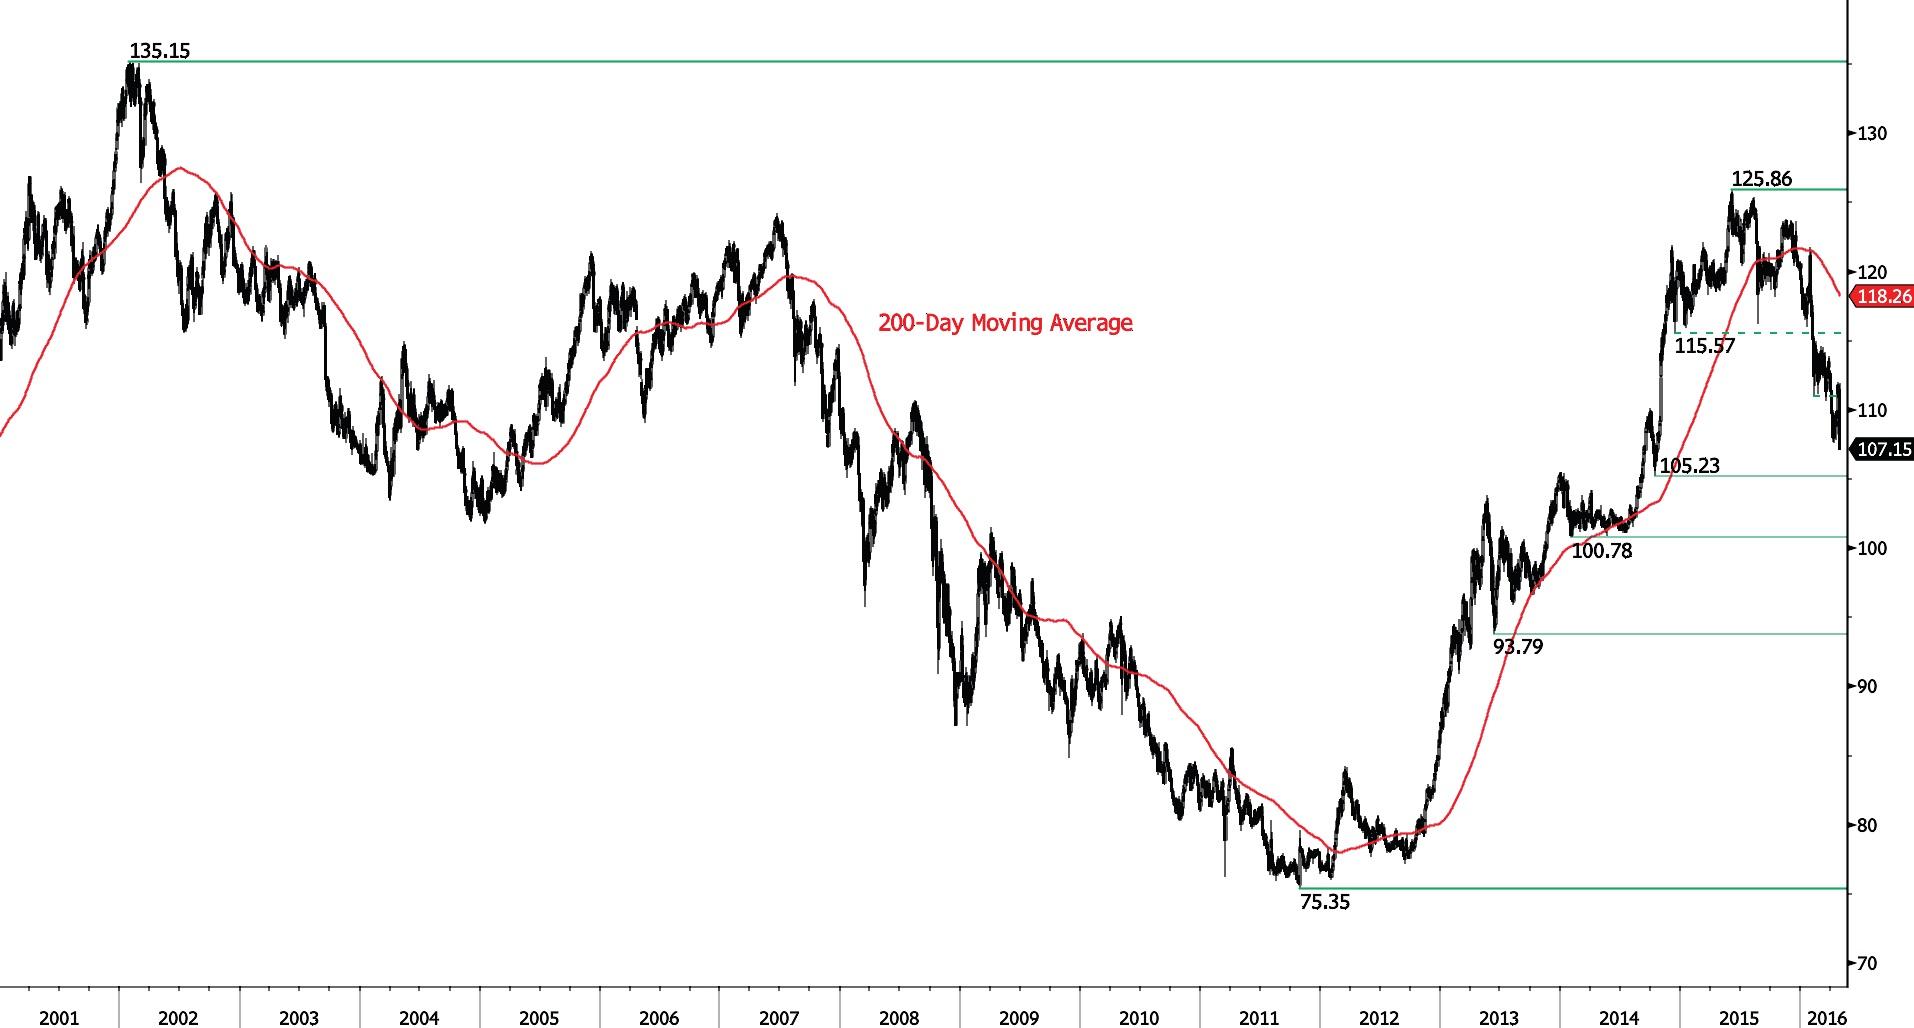
Further bearish move.
-
USD/JPY keeps on declining after BoJ rate decision. The pair has broken hourly support at 107.68 (07/04/2016 low). Resistance can be found at 111.88 (28/04/2016 high). Expected to show continued weakness.
-
We favour a long-term bearish bias. Support at 105.23 (15/10/2014 low) is on target. A gradual rise towards the major resistance at 135.15 (01/02/2002 high) seems now less likely. Another key support can be found at 105.23 (15/10/2014 low).
USD/CHF
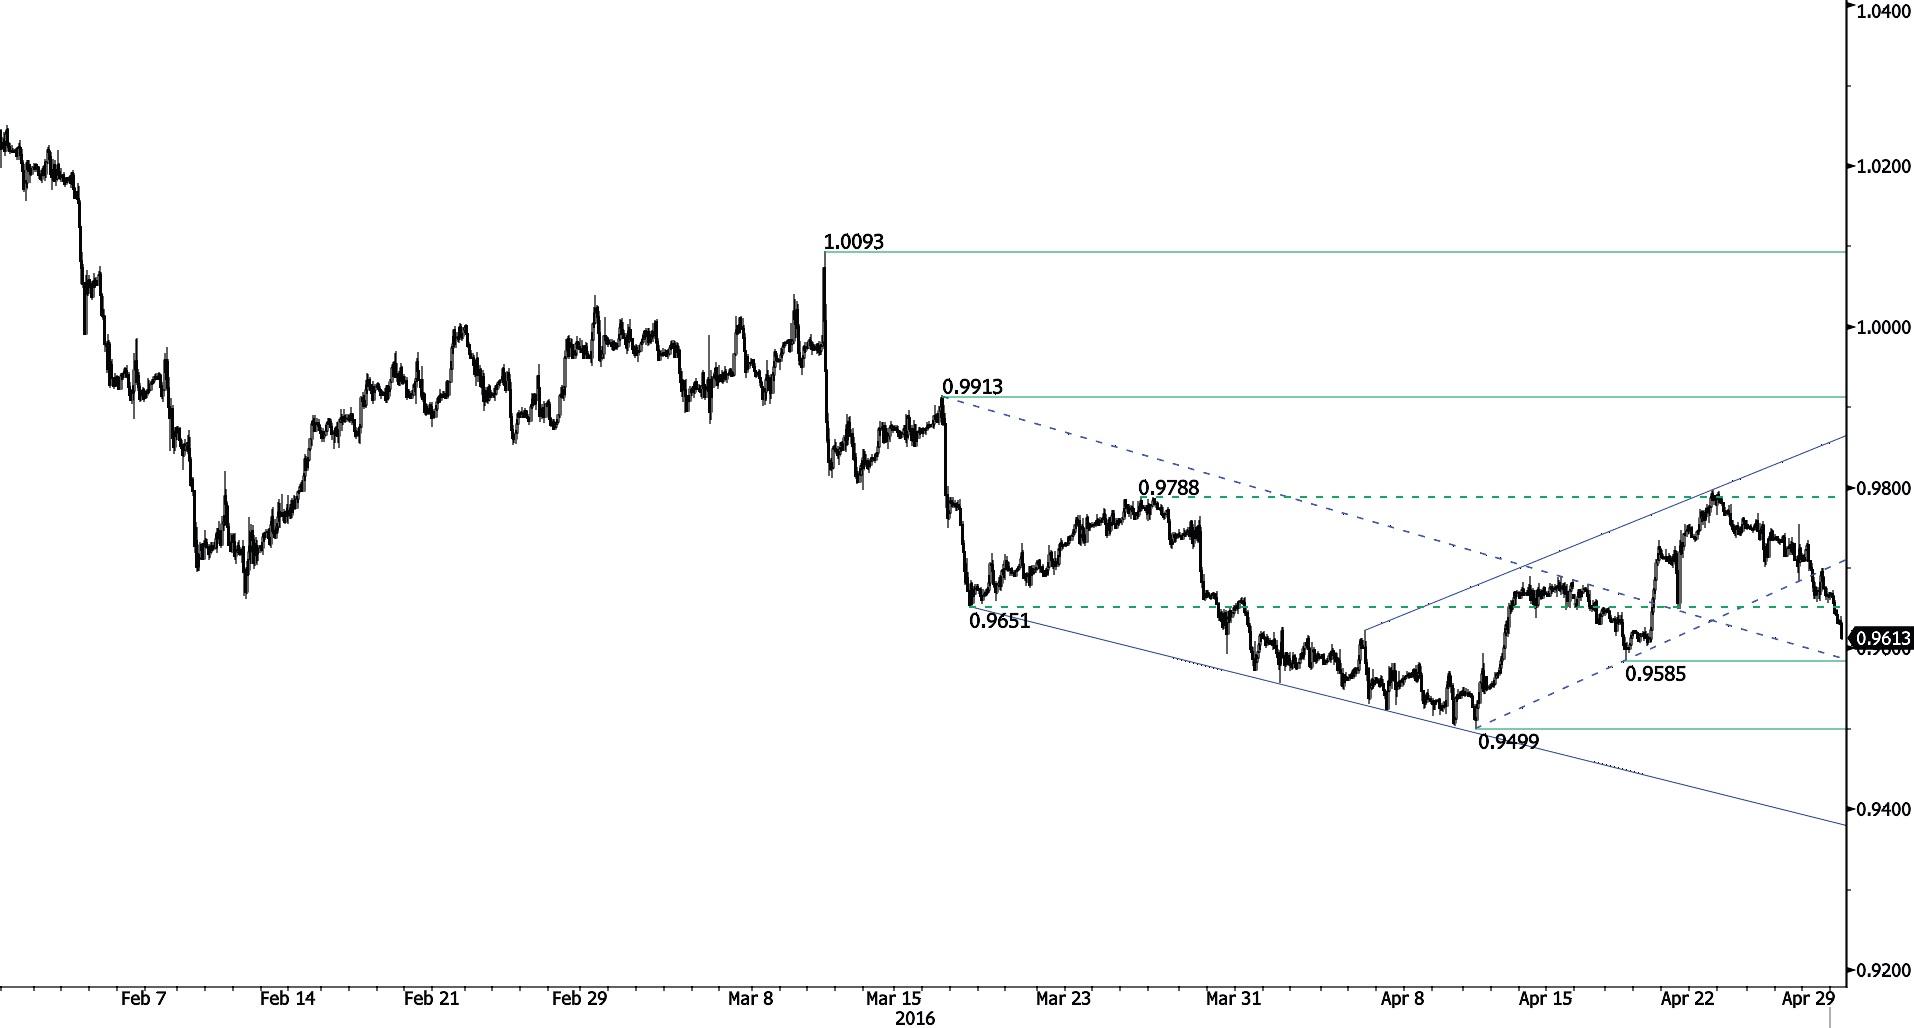
Monitoring support at 0.9585.
-
USD/CHF has exited short-term downtrend channel and is now monitoring support at 0.9585 (19/04/2016 low). Hourly support can be found at 0.9499 (12/04/2016 low). Expected to show further increase.
-
In the long-term, the pair is setting highs since mid-2015. Key support can be found 0.8986 (30/01/2015 low). The technical structure favours a long term bullish bias.
USD/CAD
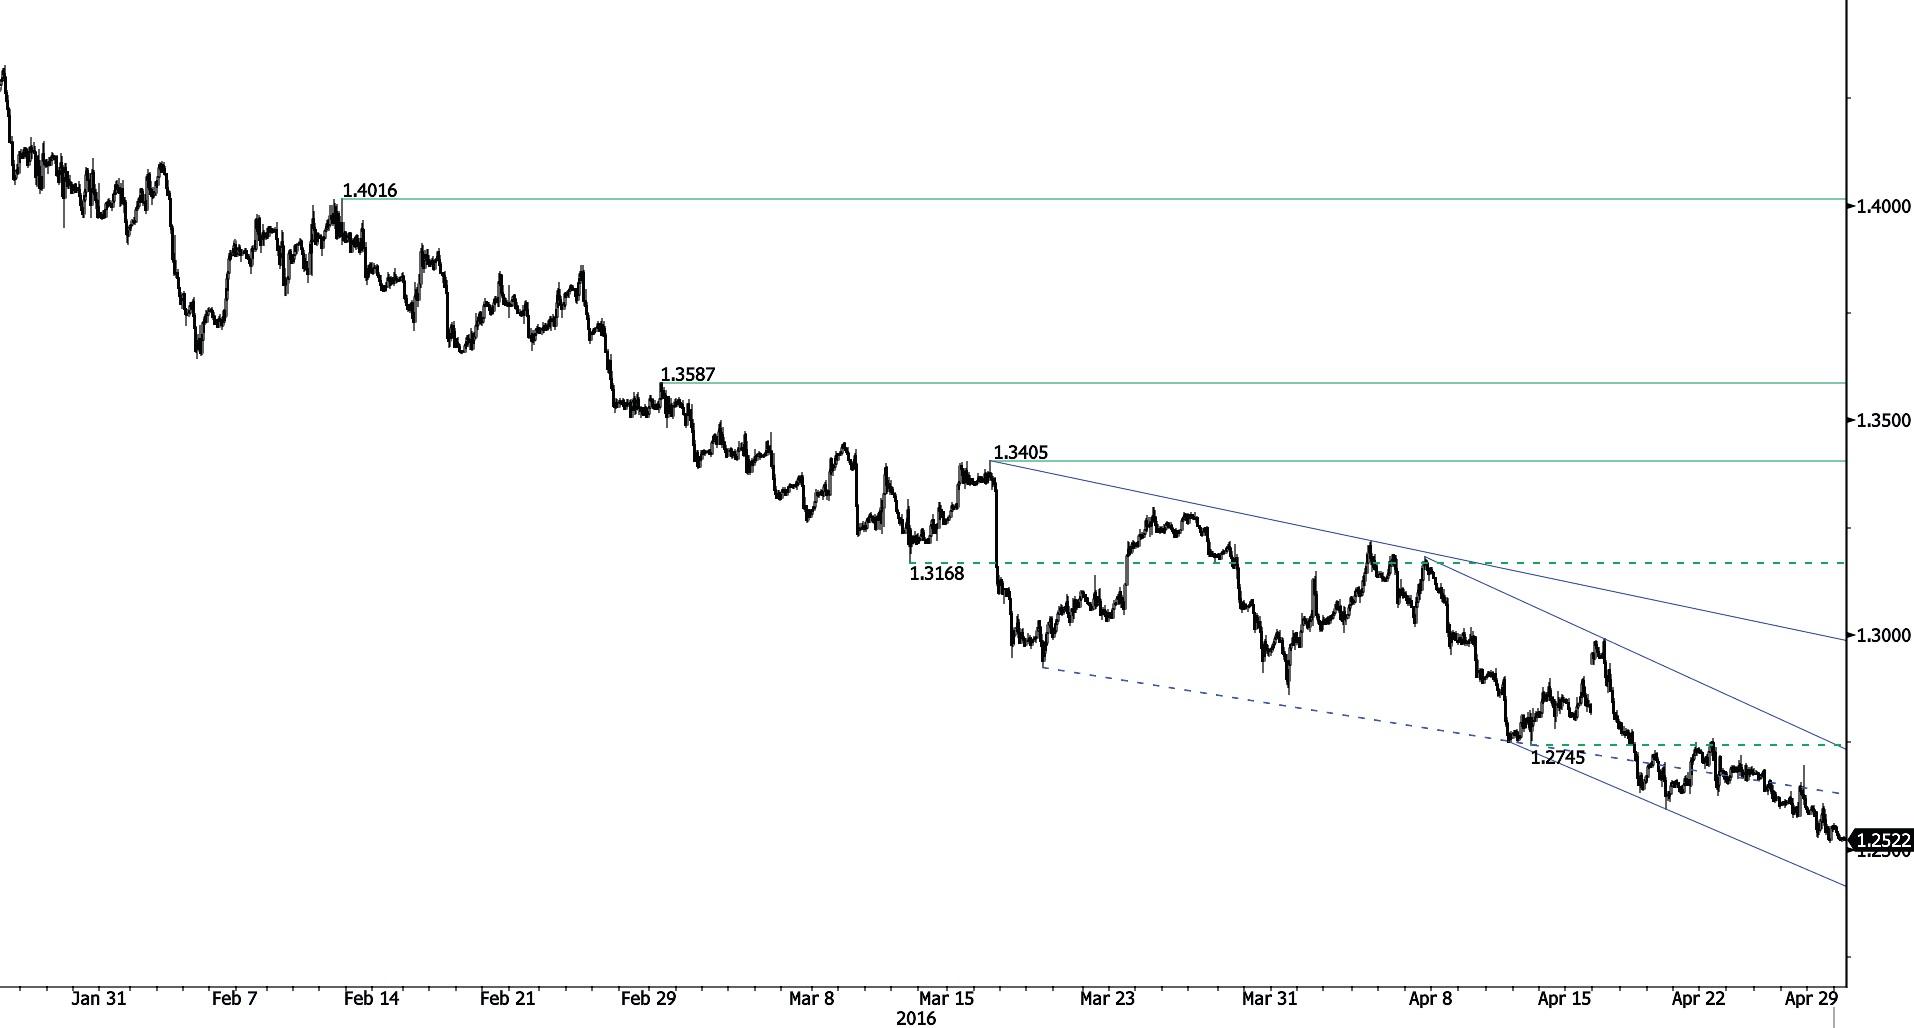
Bearish move won't end soon.
-
USD/CAD's bearish momentum is still on. Hourly support is located at 1.2514 (intraday low) while hourly resistance is given at 1.2694 (27/04/2016 high). Expected to show continued decline.
-
In the longer term, the pair is now trading well below the 200-day moving average. Strong resistance is given at 1.4948 (21/03/2003 high). Stronger support can be found at 1.1731 (06/01/2015 low).
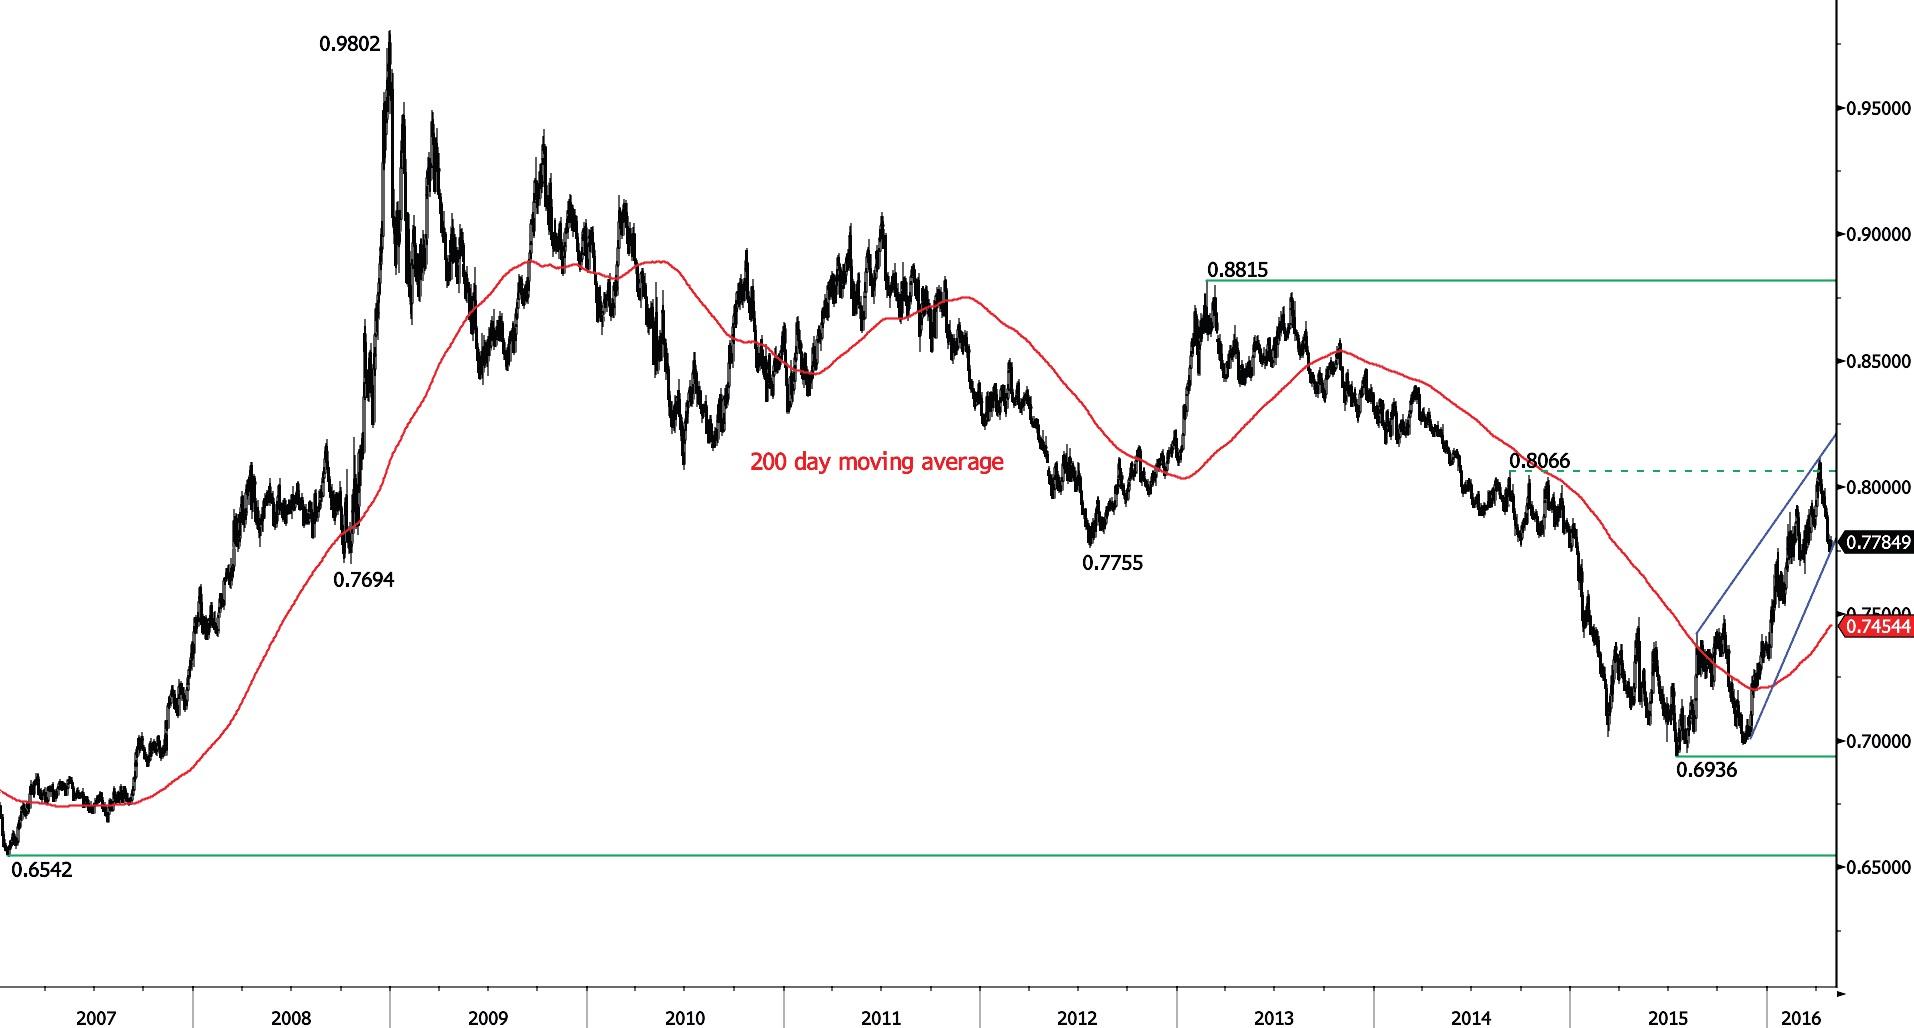
AUD/USD
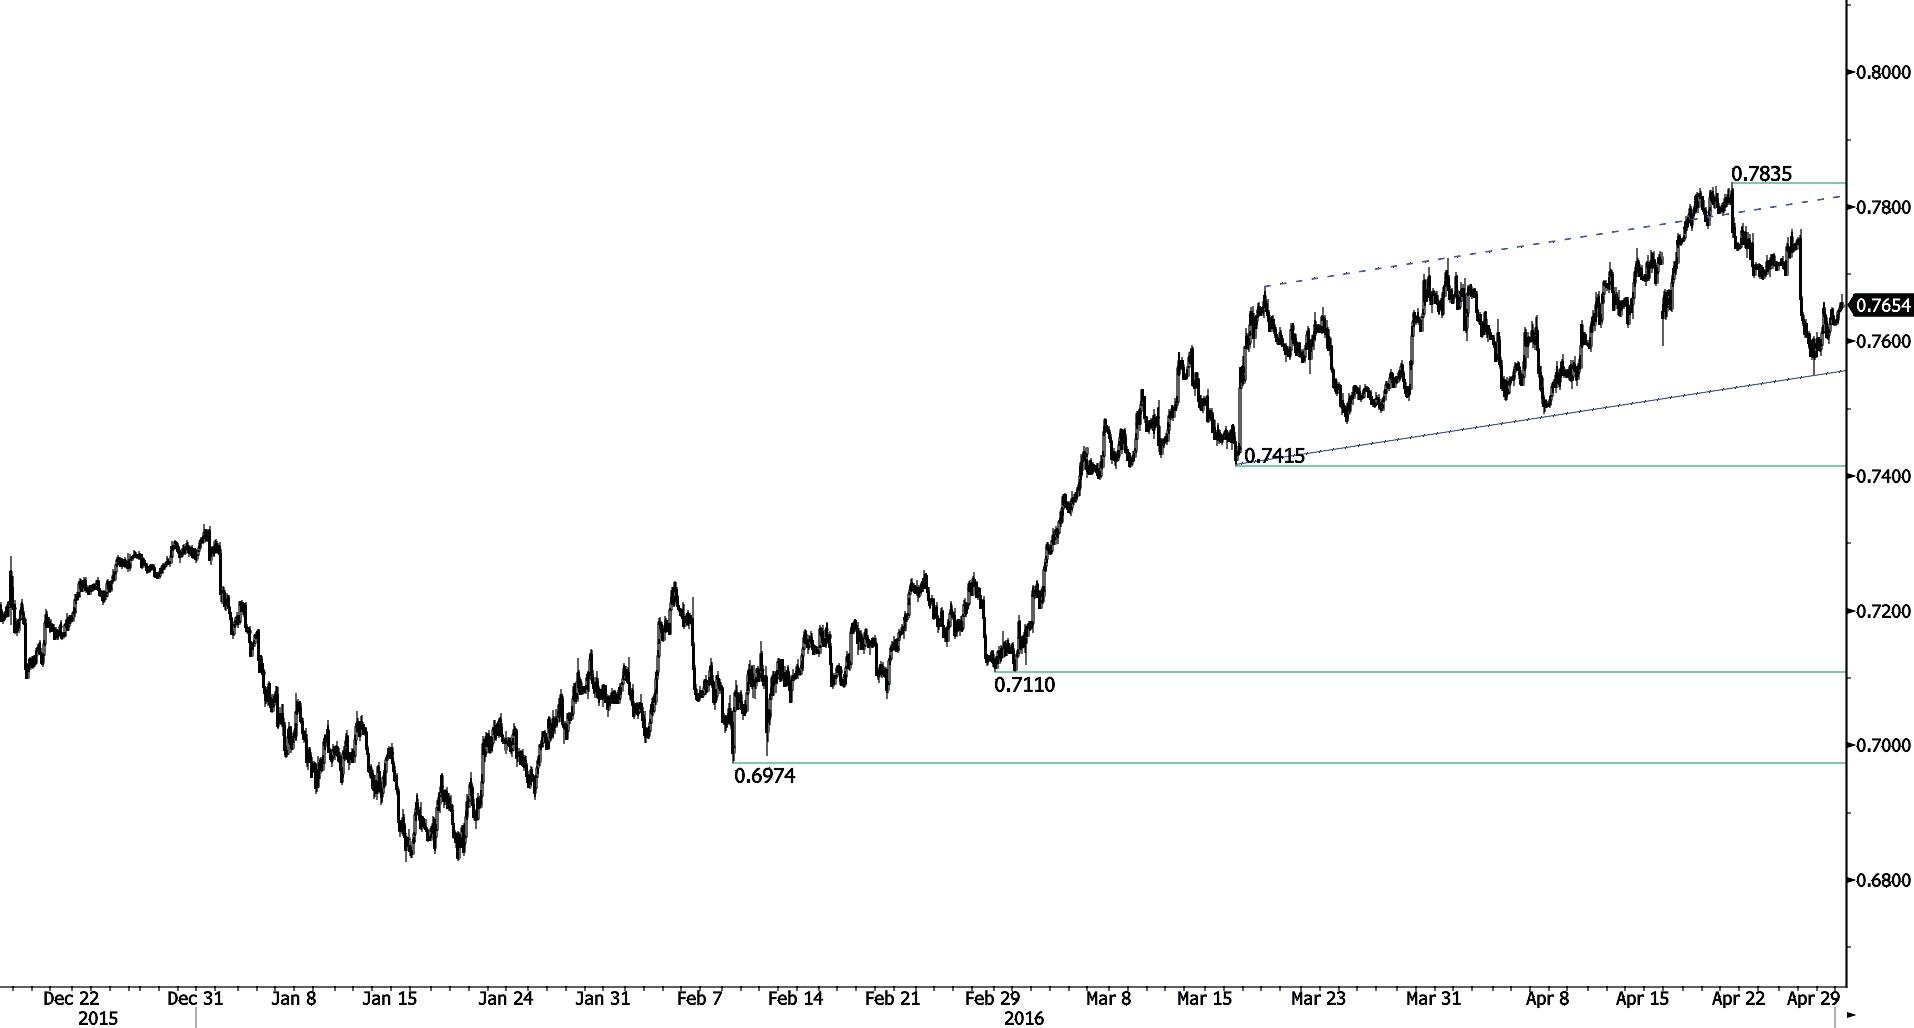
Consolidating.
-
AUD/USD has bounced back from support implied by the lower bound of the uptrend channel. Strong resistance area can be found at 0.7835 (24/04/2016 high). Hourly support is given at 0.7549 (rising trendline) then 0.7415 (16/03/2016 low). Medium-term buying pressures remains important as long as the pair remains above support implied by the uptrend channel and 0.7415.
-
In the long-term, we are waiting for further signs that the current downtrend is ending. Key supports stand at 0.6009 (31/10/2008 low) . A break of the key resistance at 0.8295 (15/01/2015 high) is needed to invalidate our long-term bearish view. In addition, we still note that the pair is now above the 200-dma which confirms our view that buying pressures are increasing.
EUR/CHF
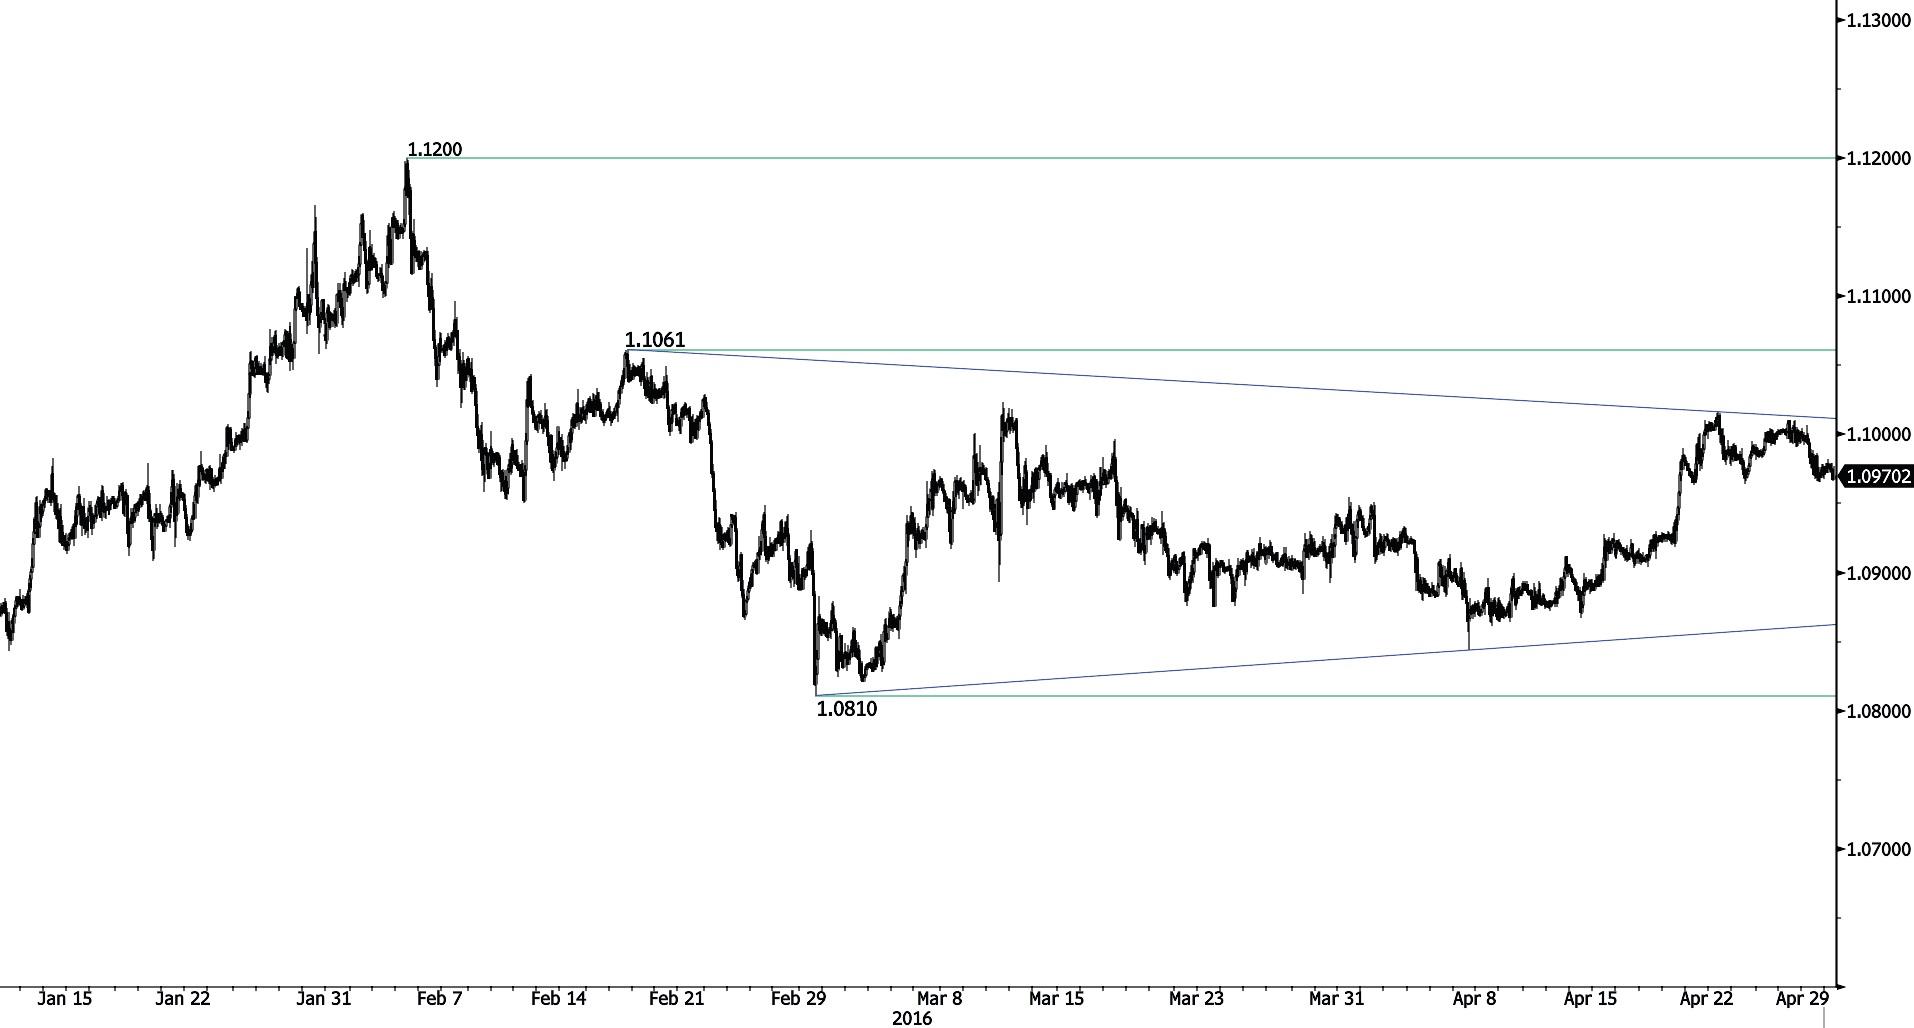
Starts again to decline.
-
EUR/CHF is trading around 1.1000 which is a strong resistance area. Selling pressures seem important at this level. Hourly support can be found at 1.0863 (23/03/2016 low) while hourly resistance is given at 1.1061 (17/02/2016 high). Expected to show continued monitoring of strong resistance area at 1.1000.
-
In the longer term, the technical structure remains positive. Resistance can be found at 1.1200 (04/02/2015 high). Yet,the ECB's QE programme is likely to cause persistent selling pressures on the euro, which should weigh on EUR/CHF. Supports can be found at 1.0184 (28/01/2015 low) and 1.0082 (27/01/2015 low).
EUR/JPY
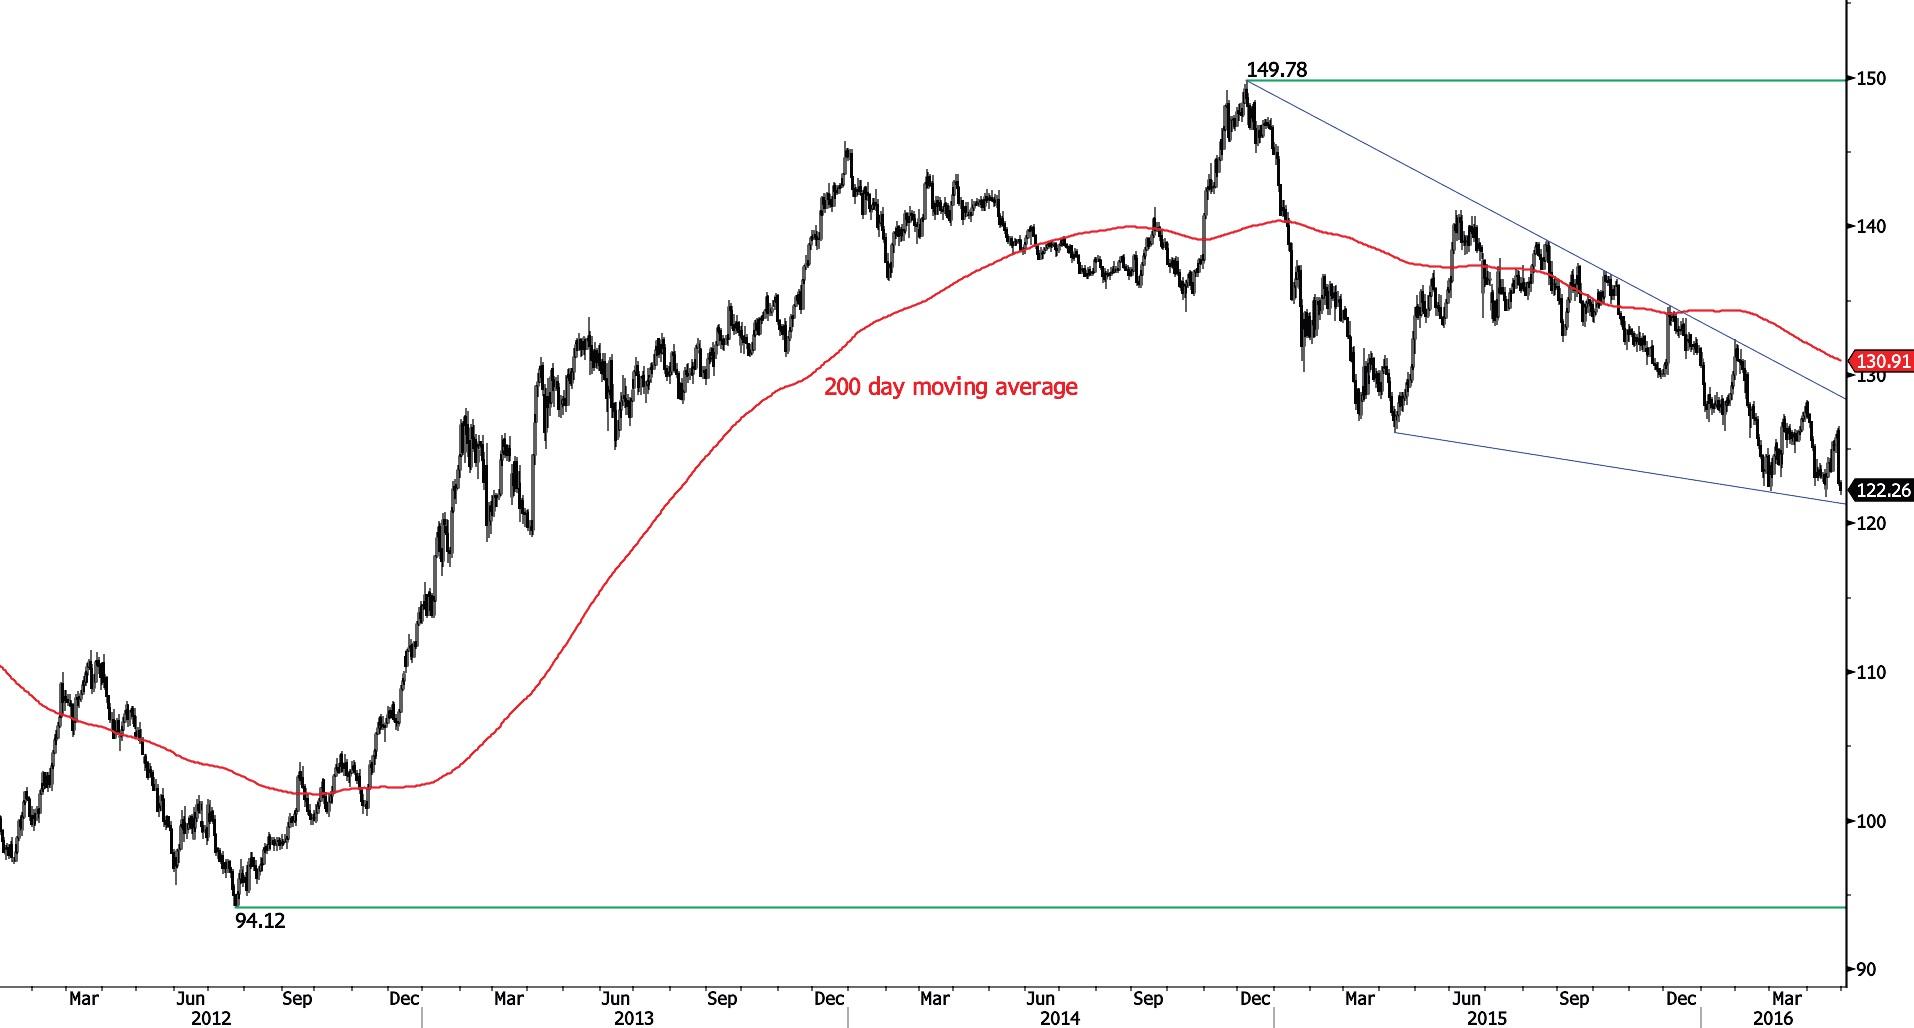
Monitoring long-term downtrend channel.
-
EUR/JPY is decreasing on BoJ rate decision. Hourly support can be found at 121.72 (18/04/2016 low). Expected to show further weakness in the short-term.
-
In the longer term, the technical structure validates a medium-term succession of lower highs and lower lows. As a result, the resistance at 149.78 (08/12/2014 high) has likely marked the end of the rise that started in July 2012. Strong support is given at 118.73 (25/02/2013 low). A key resistance can be found at 141.06 (04/06/2015 high).
EUR/GBP
Sideways price action.
-
EUR/GBP has exited short-term bearish momentum. As expected, medium-term upside momentum has prevailed. Hourly resistance can be found at 0.7811 (25/04/2016 high). Hourly support can be found at 0.7736 (26/04/2016 low). Expected to reverse around 0.7800 in the shortterm and to monitor again resistance area at 0.8000 within the next few weeks.
-
In the long-term, the pair is currently recovering from recent lows in 2015. The technical structure suggests a growing upside momentum. The pair is trading well above its 200 DMA. Strong resistance can be found at 0.8815 (25/02/2013 high).
GOLD (in USD)
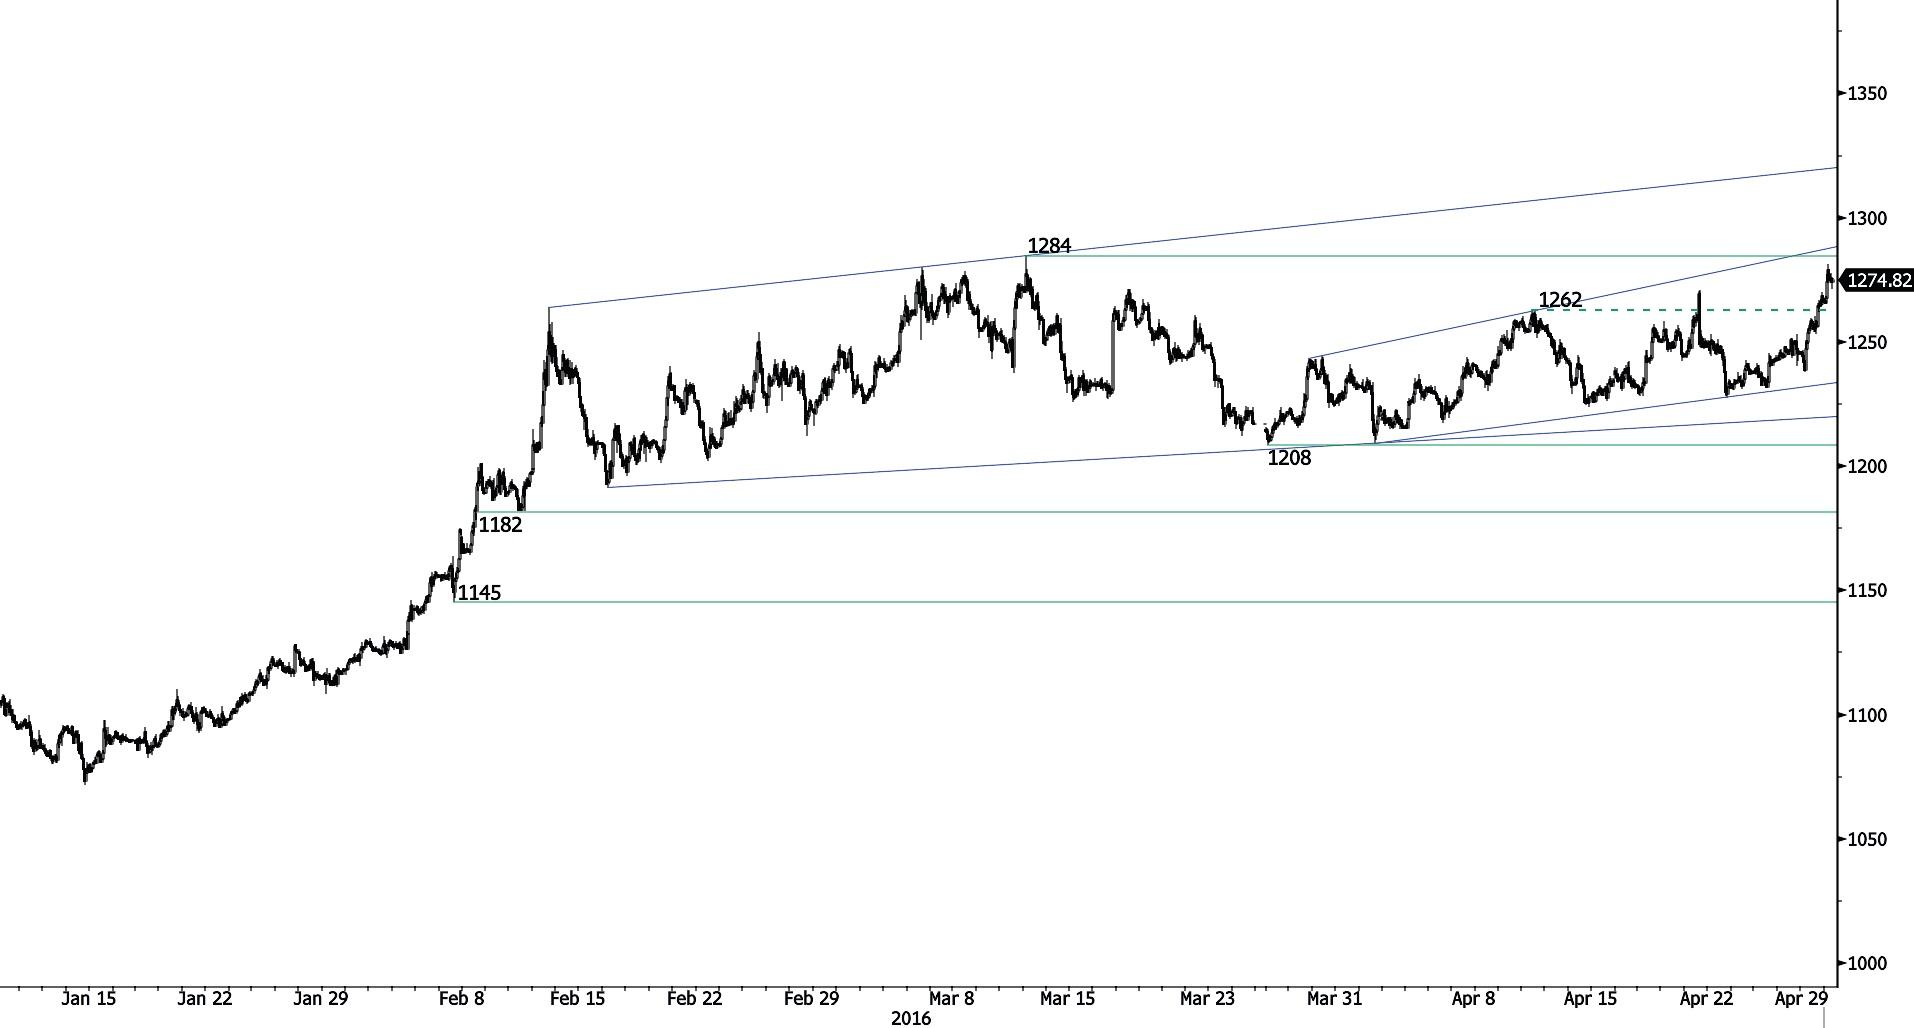
Pushing higher.
-
Gold is lying in a short-term uptrend channel. The metal keeps on increasing. Support is given at 1208 (28/03/2016). Resistance can be found at 1284 (11/03/2016 high). A break of support at 1182 (08/02/2016 low) is necessary to confirm deeper selling pressures. Expected to reach 1300 in the medium-term.
-
In the long-term, the technical structure suggests that there is a growing upside momentum. A break of 1392 (17/03/2014) is necessary ton confirm it, A major support can be found at 1045 (05/02/2010 low).
SILVER (in USD)
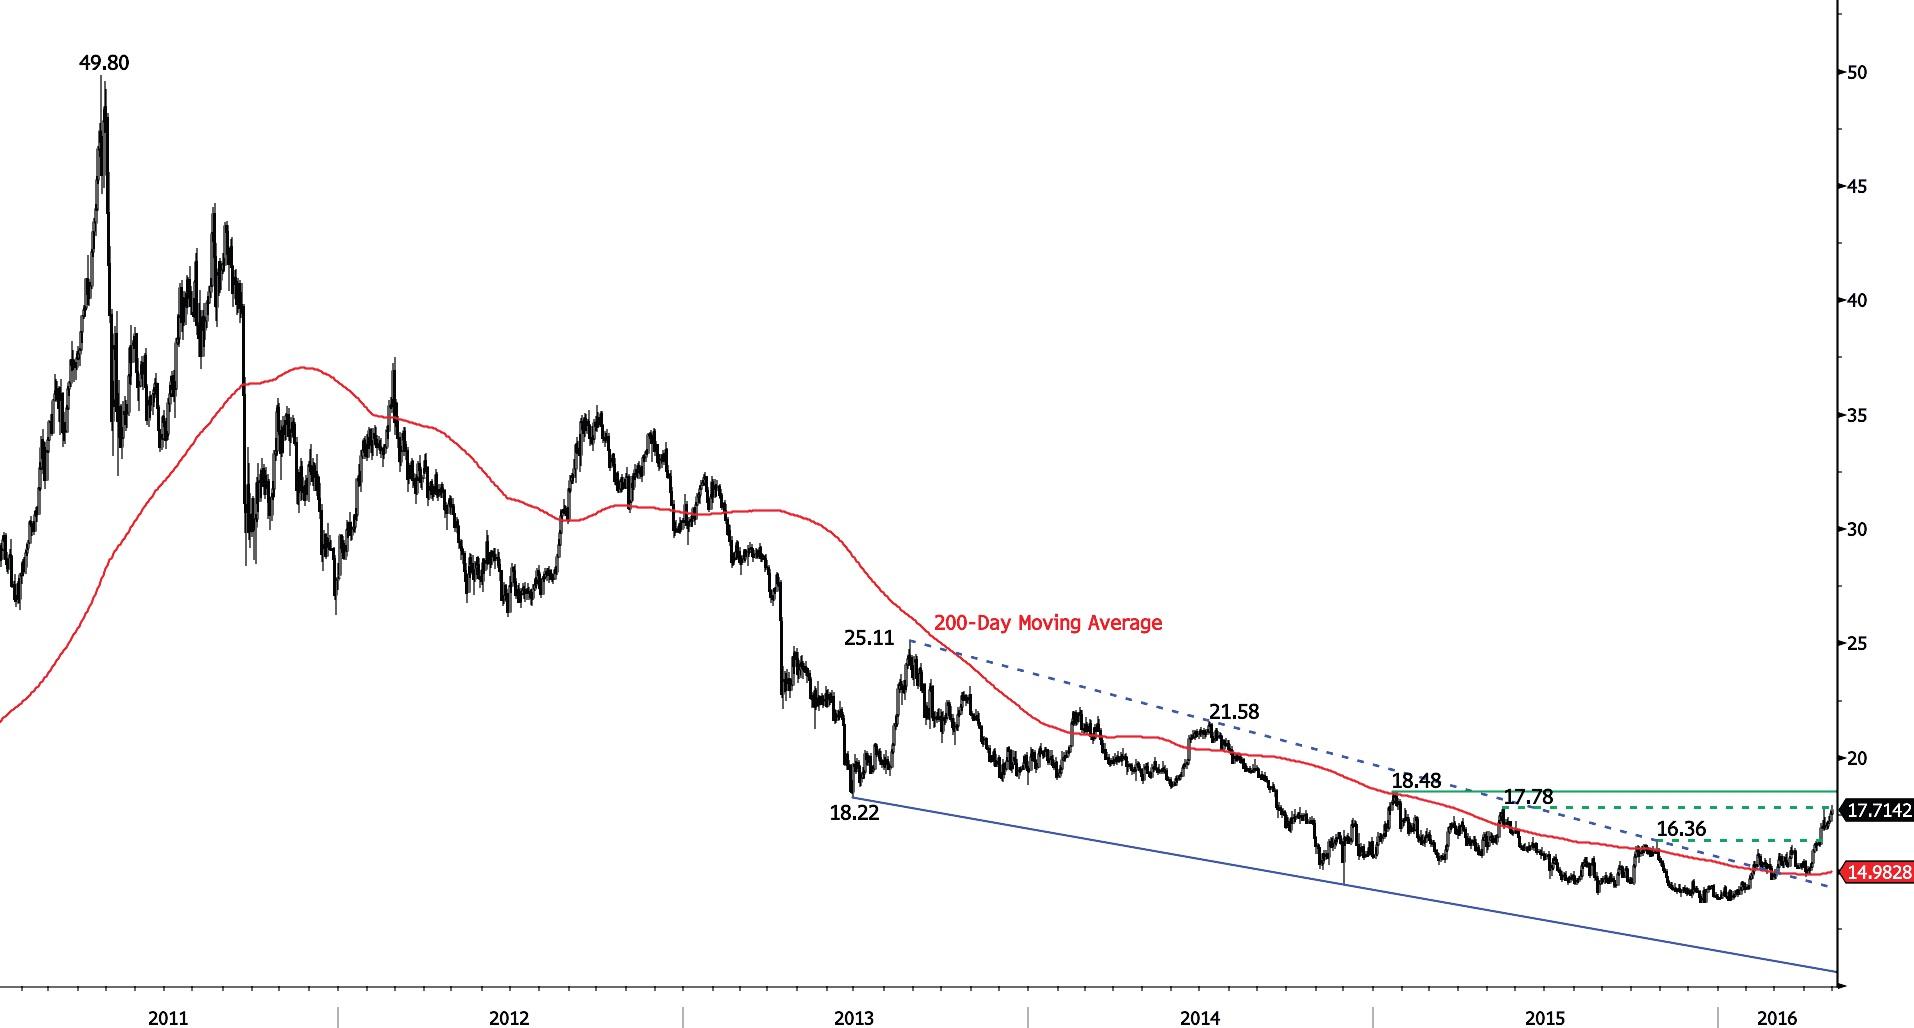
Almost to 18.00.
-
Silver's momentum is clearly positive. Daily resistance at 17.78 (18/05/2015) has been broken while hourly support can be found at 16.74 (21/04/2016 low). Expected to see further consolidation before entering into another upside move.
-
In the long-term, the break of the major support area between 18.64 (30/05/2014 low) and 18.22 (28/06/2013 low) confirms an underlying downtrend. Strong support can be found at 11.75 (20/04/2009). A key resistance stands at 18.89 (16/09/2014 high).
Crude Oil (in USD)
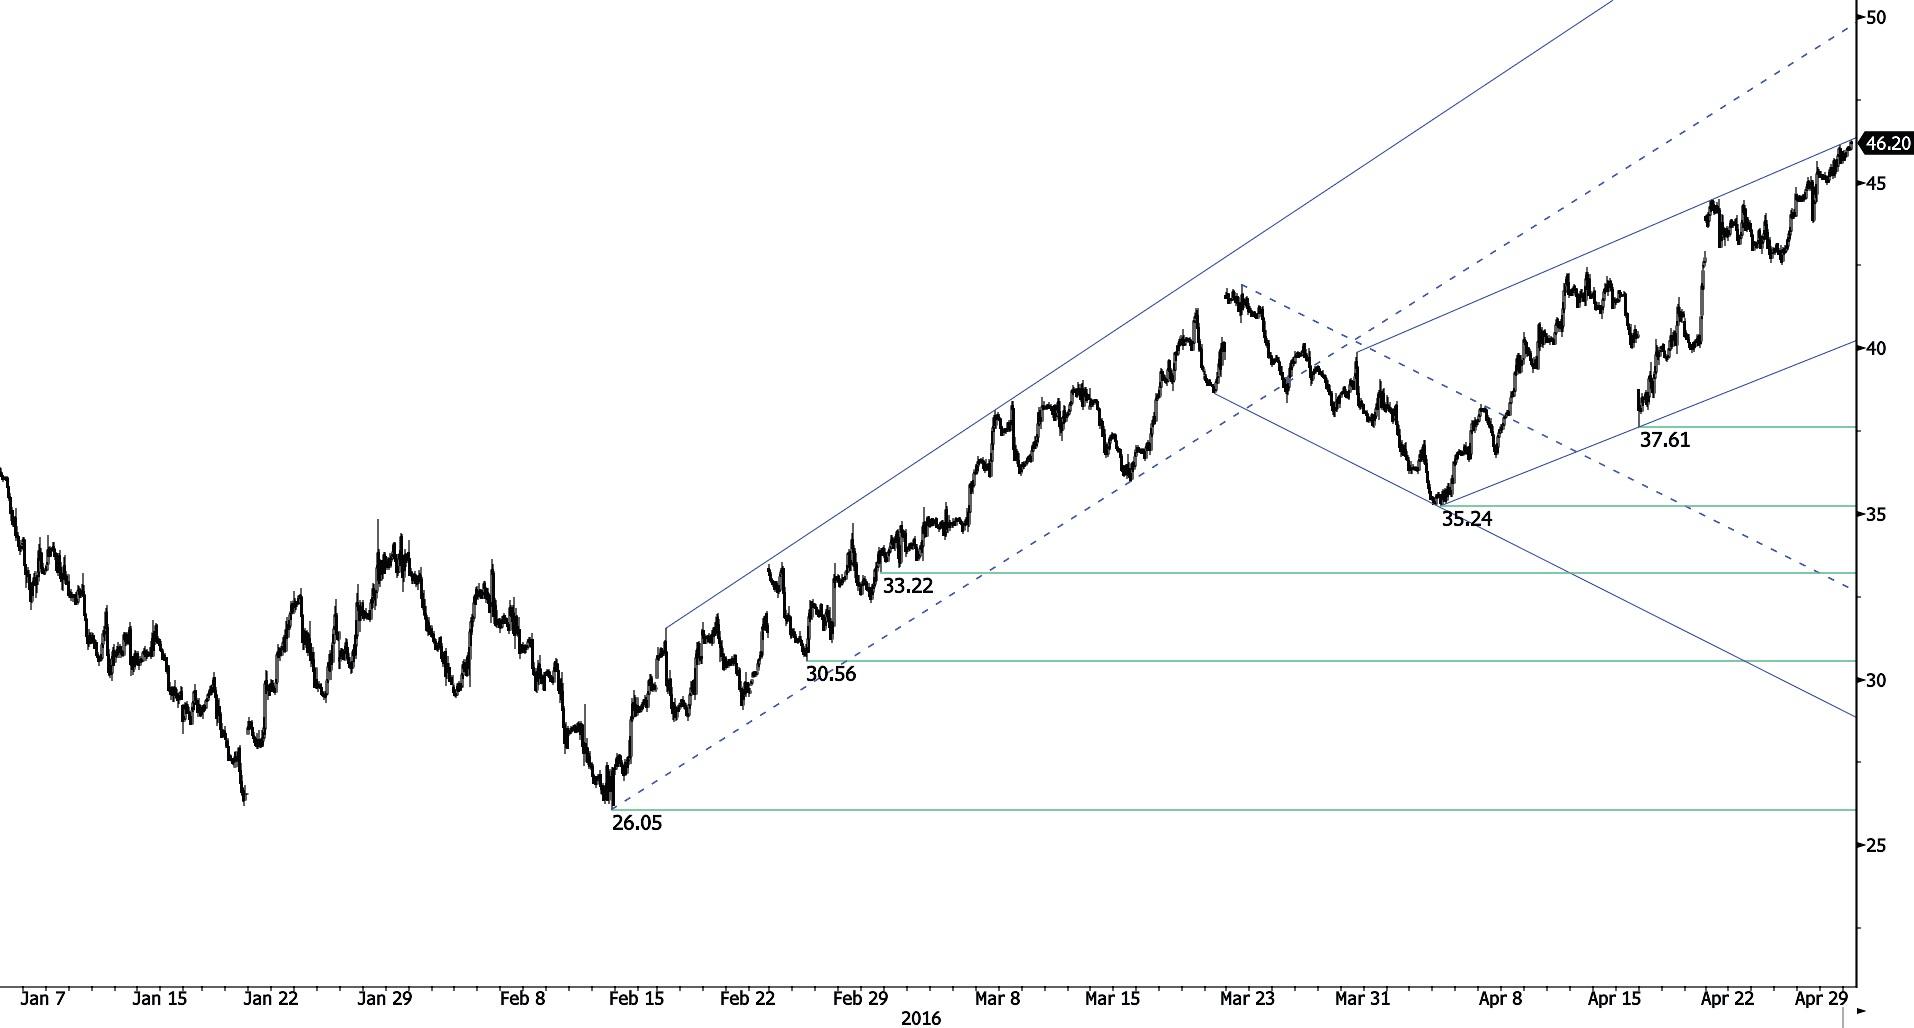
Monitoring uptrend channel.
-
Crude is pushing higher within a short-term uptrend channel. The medium-term momentum is also clearly bullish. Hourly support can be found at 42.52 (2604/2016 low) while strong resistance lies at 48.36 (03/11/2016 low). The technical structure suggests a further short-term retracement of the commodity.
-
In the long-term, crude oil is on a sharp decline but is now showing some signs of recovery. Strong support lies at 24.82 (13/11/2002). Crude oil is holding above its 200-Day Moving Average. Crude oil should recover during this year.

This report has been prepared by Swissquote Bank Ltd and is solely been published for informational purposes and is not to be construed as a solicitation or an offer to buy or sell any currency or any other financial instrument. Views expressed in this report may be subject to change without prior notice and may differ or be contrary to opinions expressed by Swissquote Bank Ltd personnel at any given time. Swissquote Bank Ltd is under no obligation to update or keep current the information herein, the report should not be regarded by recipients as a substitute for the exercise of their own judgment.
Recommended Content
Editors’ Picks
EUR/USD clings to daily gains above 1.0650

EUR/USD gained traction and turned positive on the day above 1.0650. The improvement seen in risk mood following the earlier flight to safety weighs on the US Dollar ahead of the weekend and helps the pair push higher.
GBP/USD recovers toward 1.2450 after UK Retail Sales data

GBP/USD reversed its direction and advanced to the 1.2450 area after touching a fresh multi-month low below 1.2400 in the Asian session. The positive shift seen in risk mood on easing fears over a deepening Iran-Israel conflict supports the pair.
Gold holds steady at around $2,380 following earlier spike

Gold stabilized near $2,380 after spiking above $2,400 with the immediate reaction to reports of Israel striking Iran. Meanwhile, the pullback seen in the US Treasury bond yields helps XAU/USD hold its ground.
Bitcoin Weekly Forecast: BTC post-halving rally could be partially priced in Premium

Bitcoin price shows no signs of directional bias while it holds above $60,000. The fourth BTC halving is partially priced in, according to Deutsche Bank’s research.
Week ahead – US GDP and BoJ decision on top of next week’s agenda

US GDP, core PCE and PMIs the next tests for the Dollar. Investors await BoJ for guidance about next rate hike. EU and UK PMIs, as well as Australian CPIs also on tap.