EUR/USD
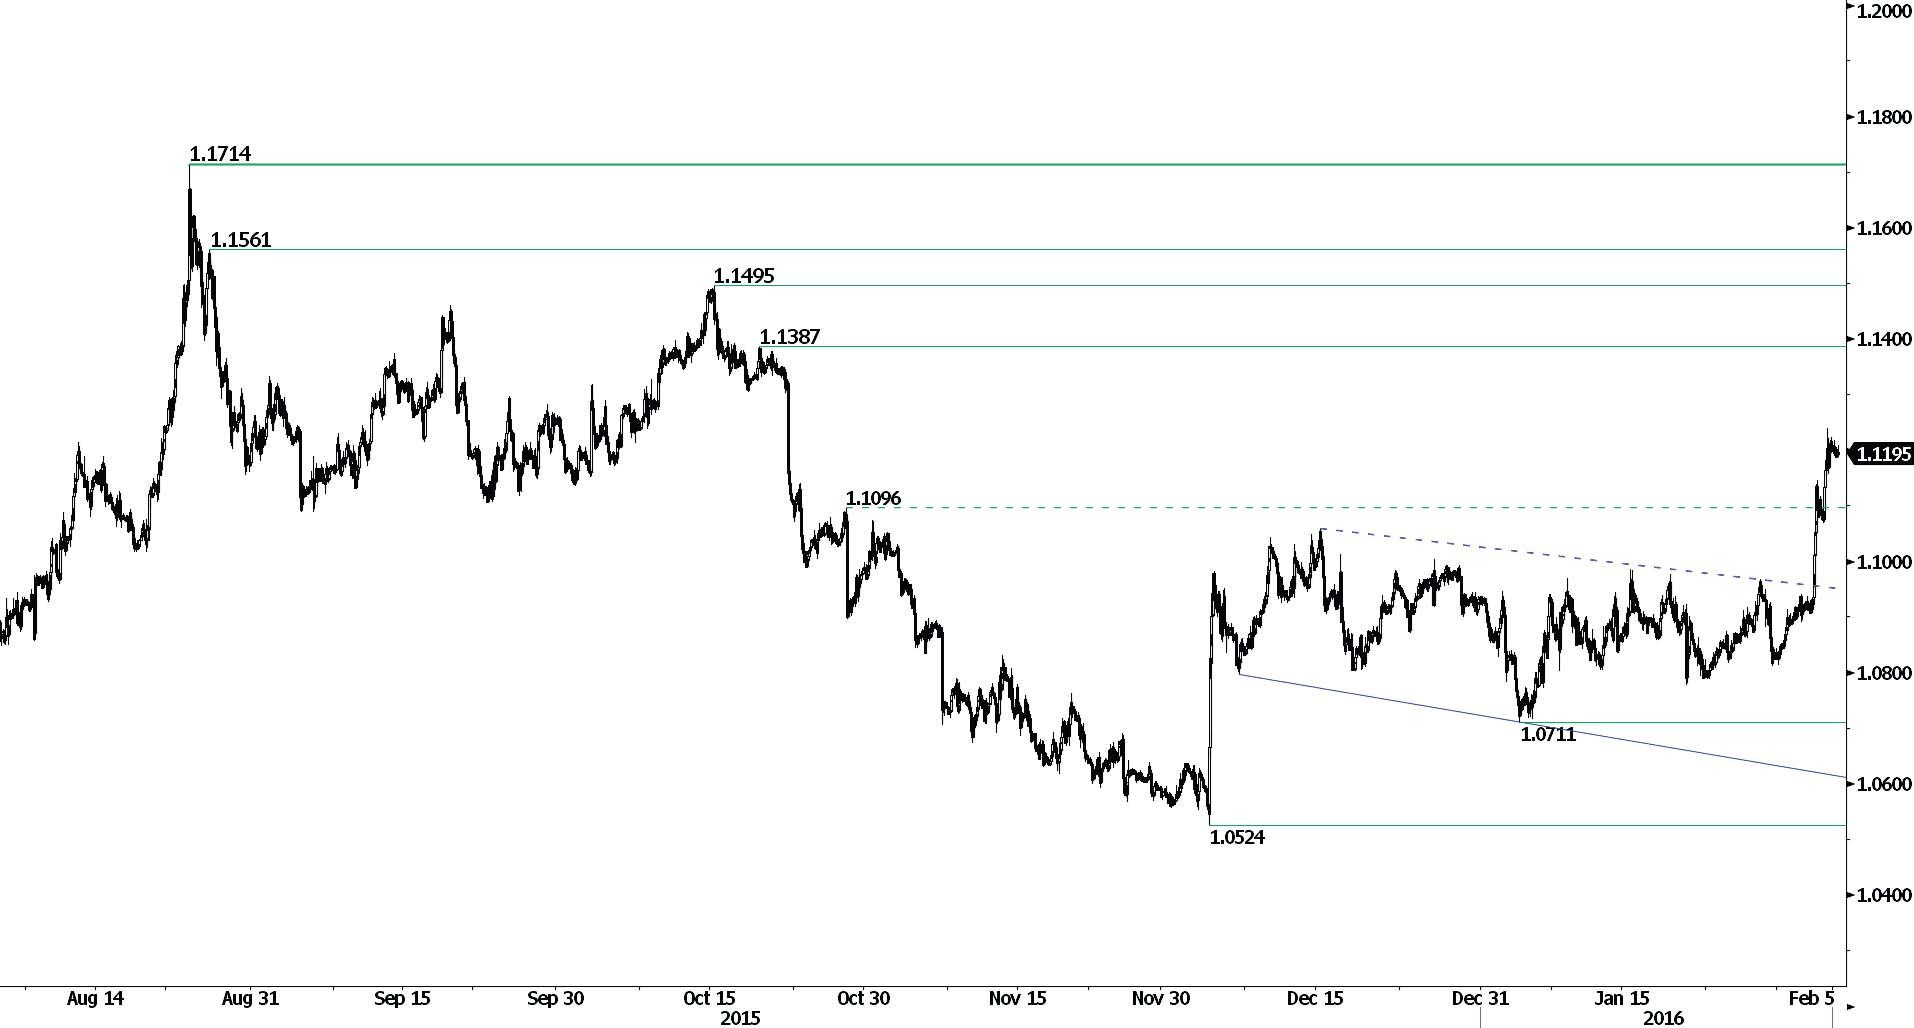
Strong short-term bullish momentum.
EUR/USD is pushing towards daily resistance at 1.1387 (20/11/2015 high). Hourly support may be found at 1.0711 (05/01/2016 low). Yet, expected to show further consolidation.
In the longer term, the technical structure favours a bearish bias as long as resistance holds. Key resistance is located region at 1.1453 (range high) and 1.1640 (11/11/2005 low) is likely to cap any price appreciation. The current technical deteriorations favours a gradual decline towards the support at 1.0504 (21/03/2003 low).
GBP/USD
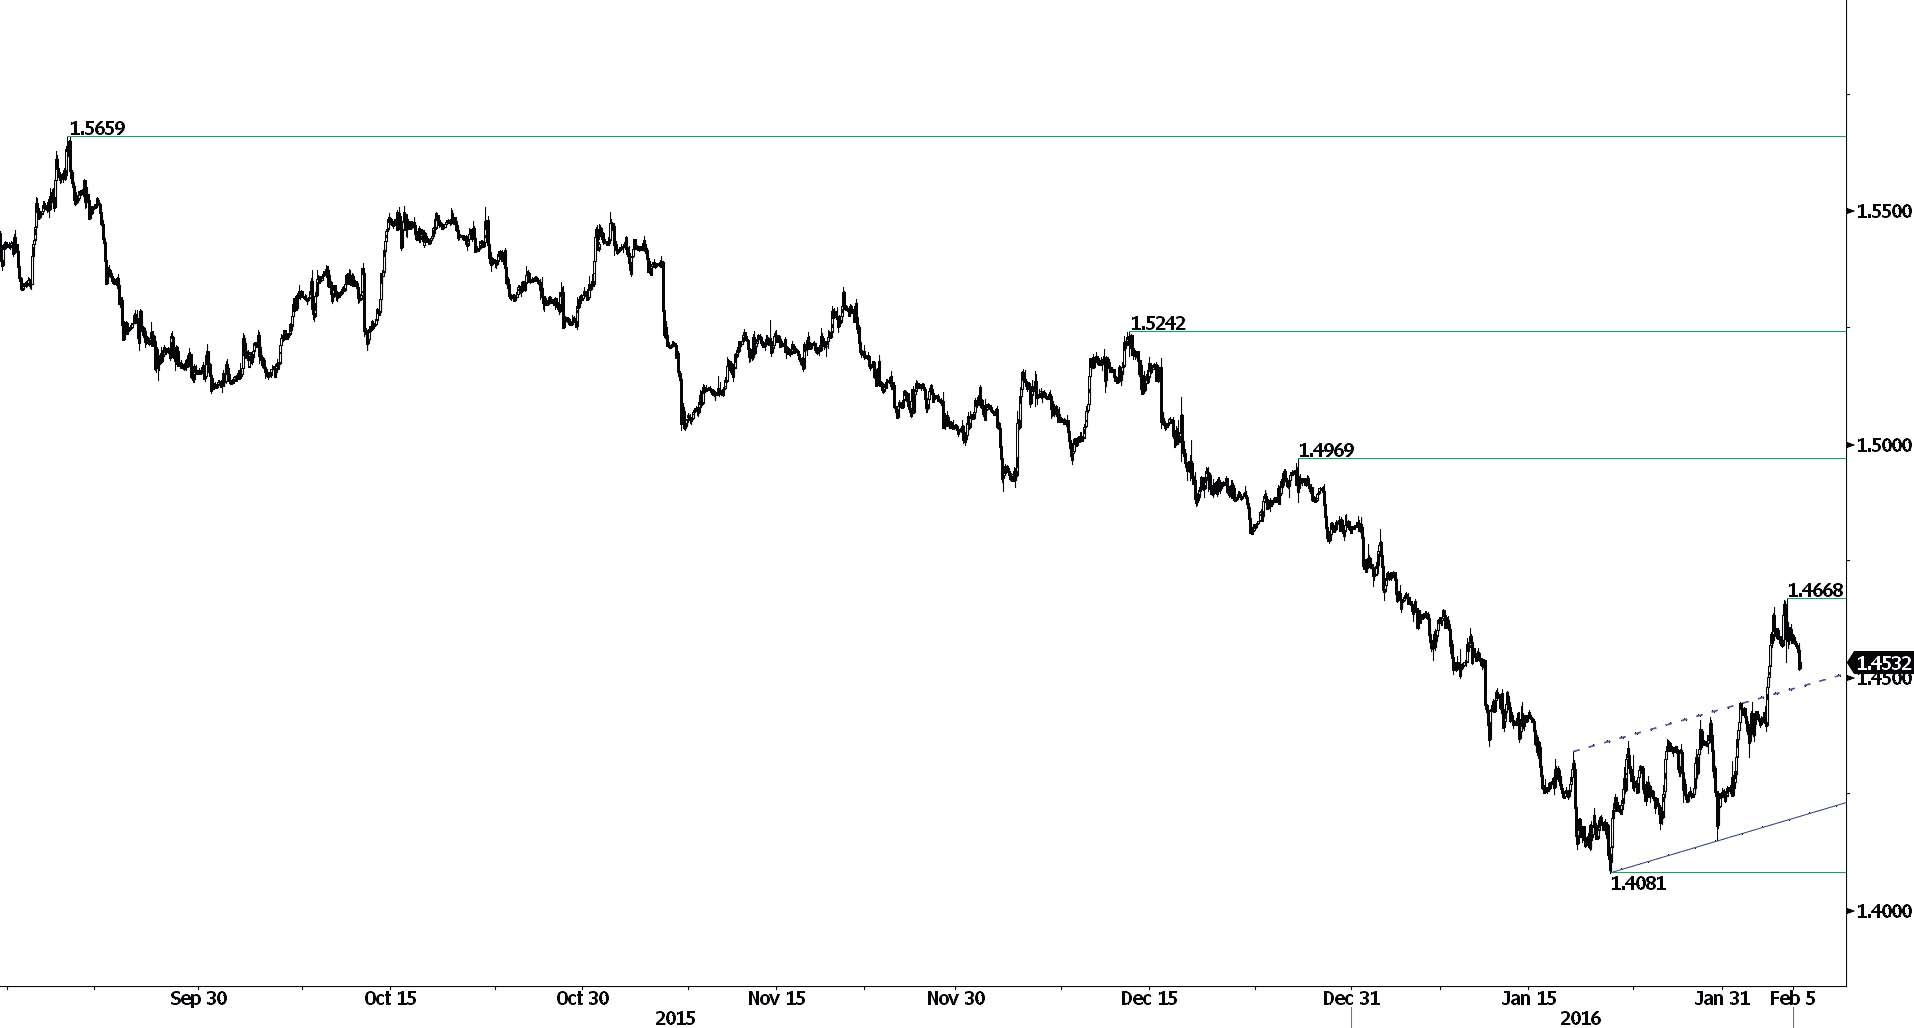
Bearish consolidation.
GBP/USD's growing short-term momentum is consolodating. Hourly resistance can be found at 1.4969 (27/12/2015 high). Hourly support can be found at 1.4081 (21/01/2015 low). Expected to show further increase.
The long-term technical pattern is negative and favours a further decline towards the key support at 1.3503 (23/01/2009 low), as long as prices remain below the resistance at 1.5340/64 (04/11/2015 low see also the 200 day moving average). However, the general oversold conditions and the recent pick-up in buying interest pave the way for a rebound.
USD/JPY
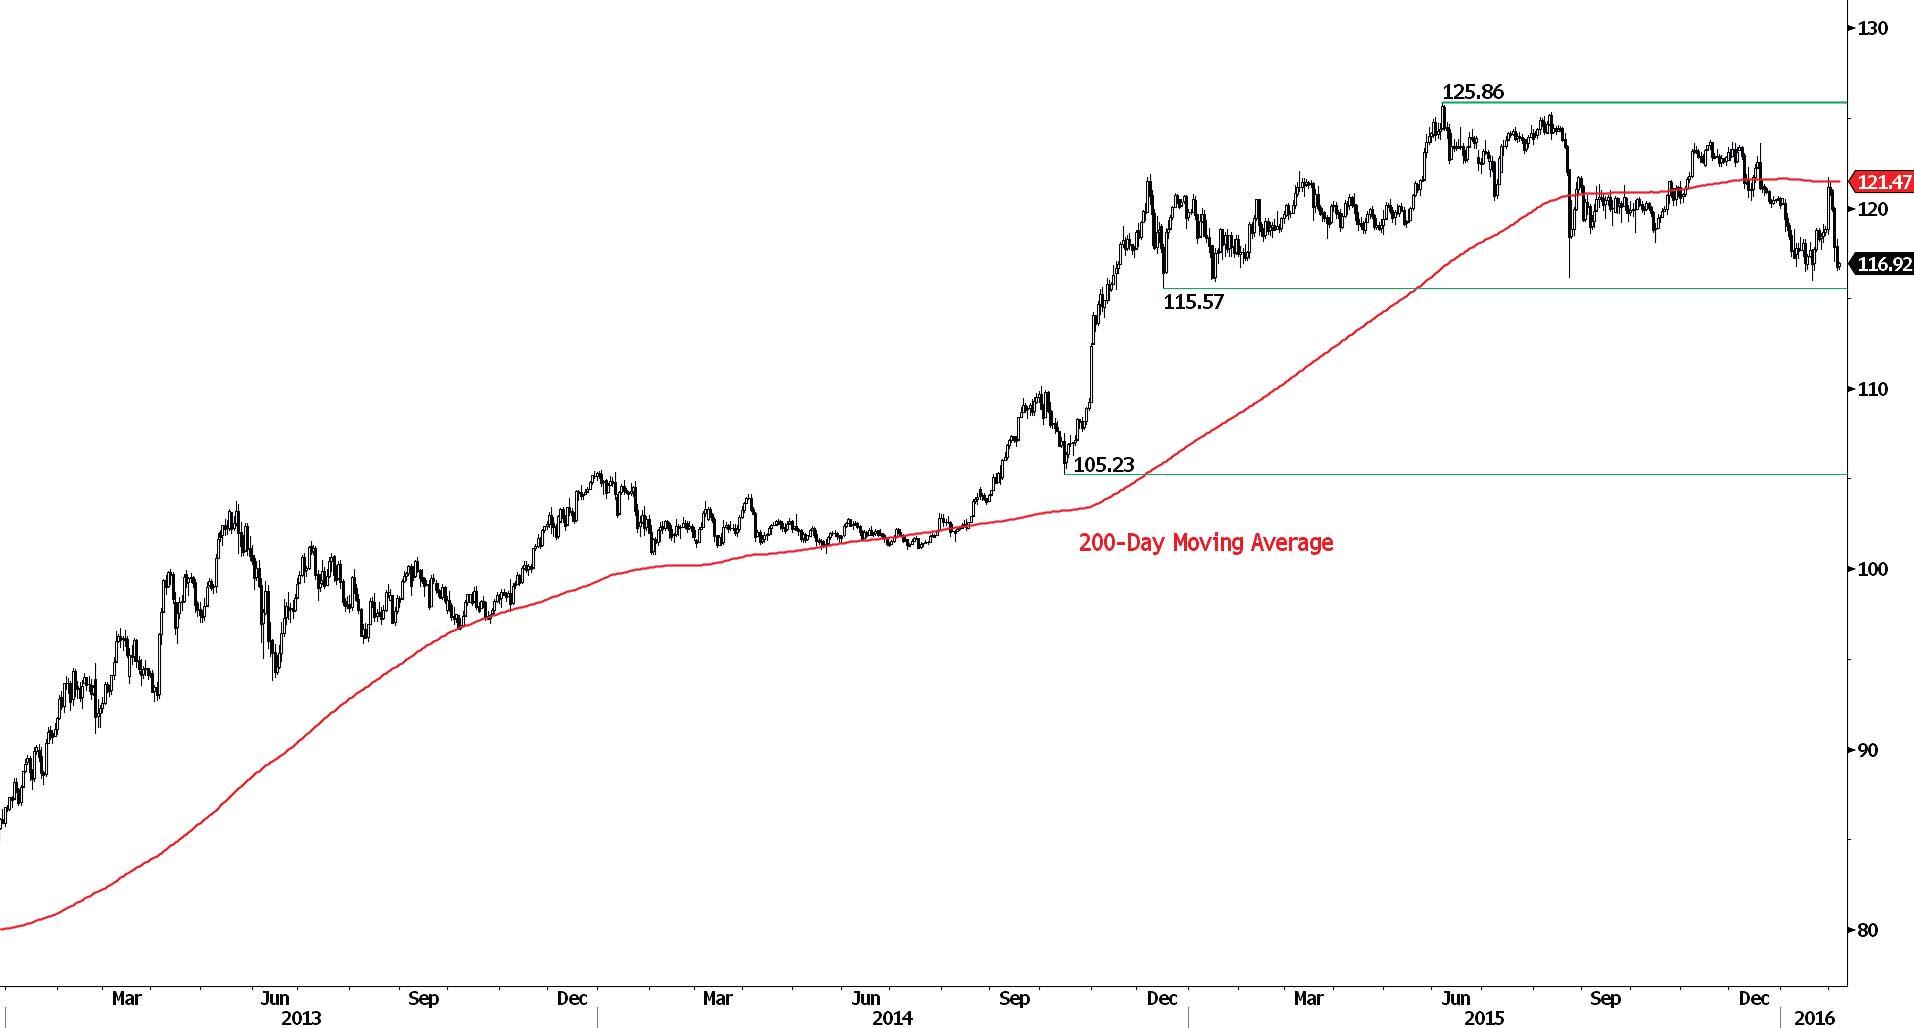
Approaching key support at 115.57.
USD/JPY is weakening for the 4th session in a rowm moving to 116.00 from 122.00. Hourly resistance lies at 123.76 (18/11/2015 high). Hourly support lies can be found at 115.98 (20/01/2016 low). Expected to show further decline. • A
long-term bullish bias is favored as long as the strong support at 115.57 (16/12/2014 low) holds. A gradual rise towards the major resistance at 135.15 (01/02/2002 high) is favored. A key support can be found at 116.18 (24/08/2015 low).
USD/CHF
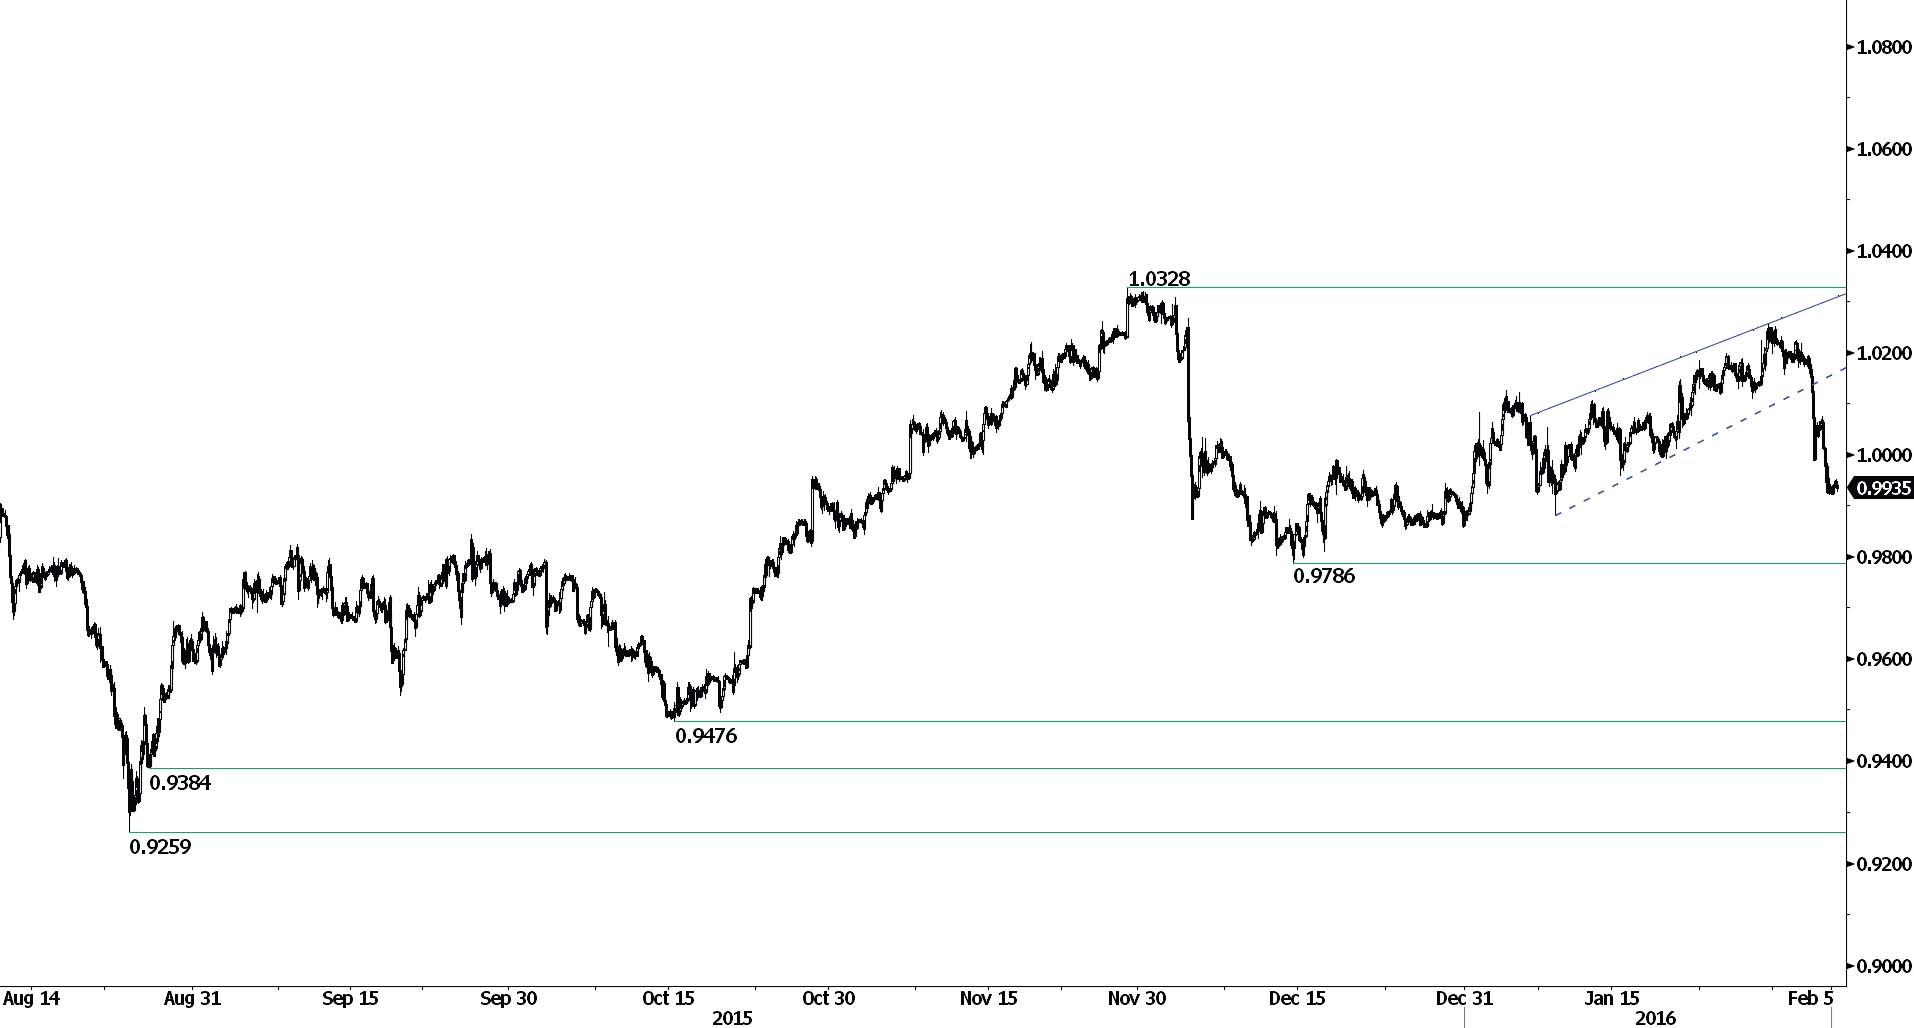
Breaking parity.
USD/CHF is holding below parity. Hourly support is located at 0.9786 (14/12/2015 low) and hourly resistance can be found at 1.0328 (27/11/2015 high). Expected to show continued decline.
In the long-term, the pair has broken resistance at 0.9448 and key resistance at 0.9957 suggesting further uptrend. Key support can be found 0.8986 (30/01/2015 low). As long as these levels hold, a long term bullish bias is favoured.
USD/CAD
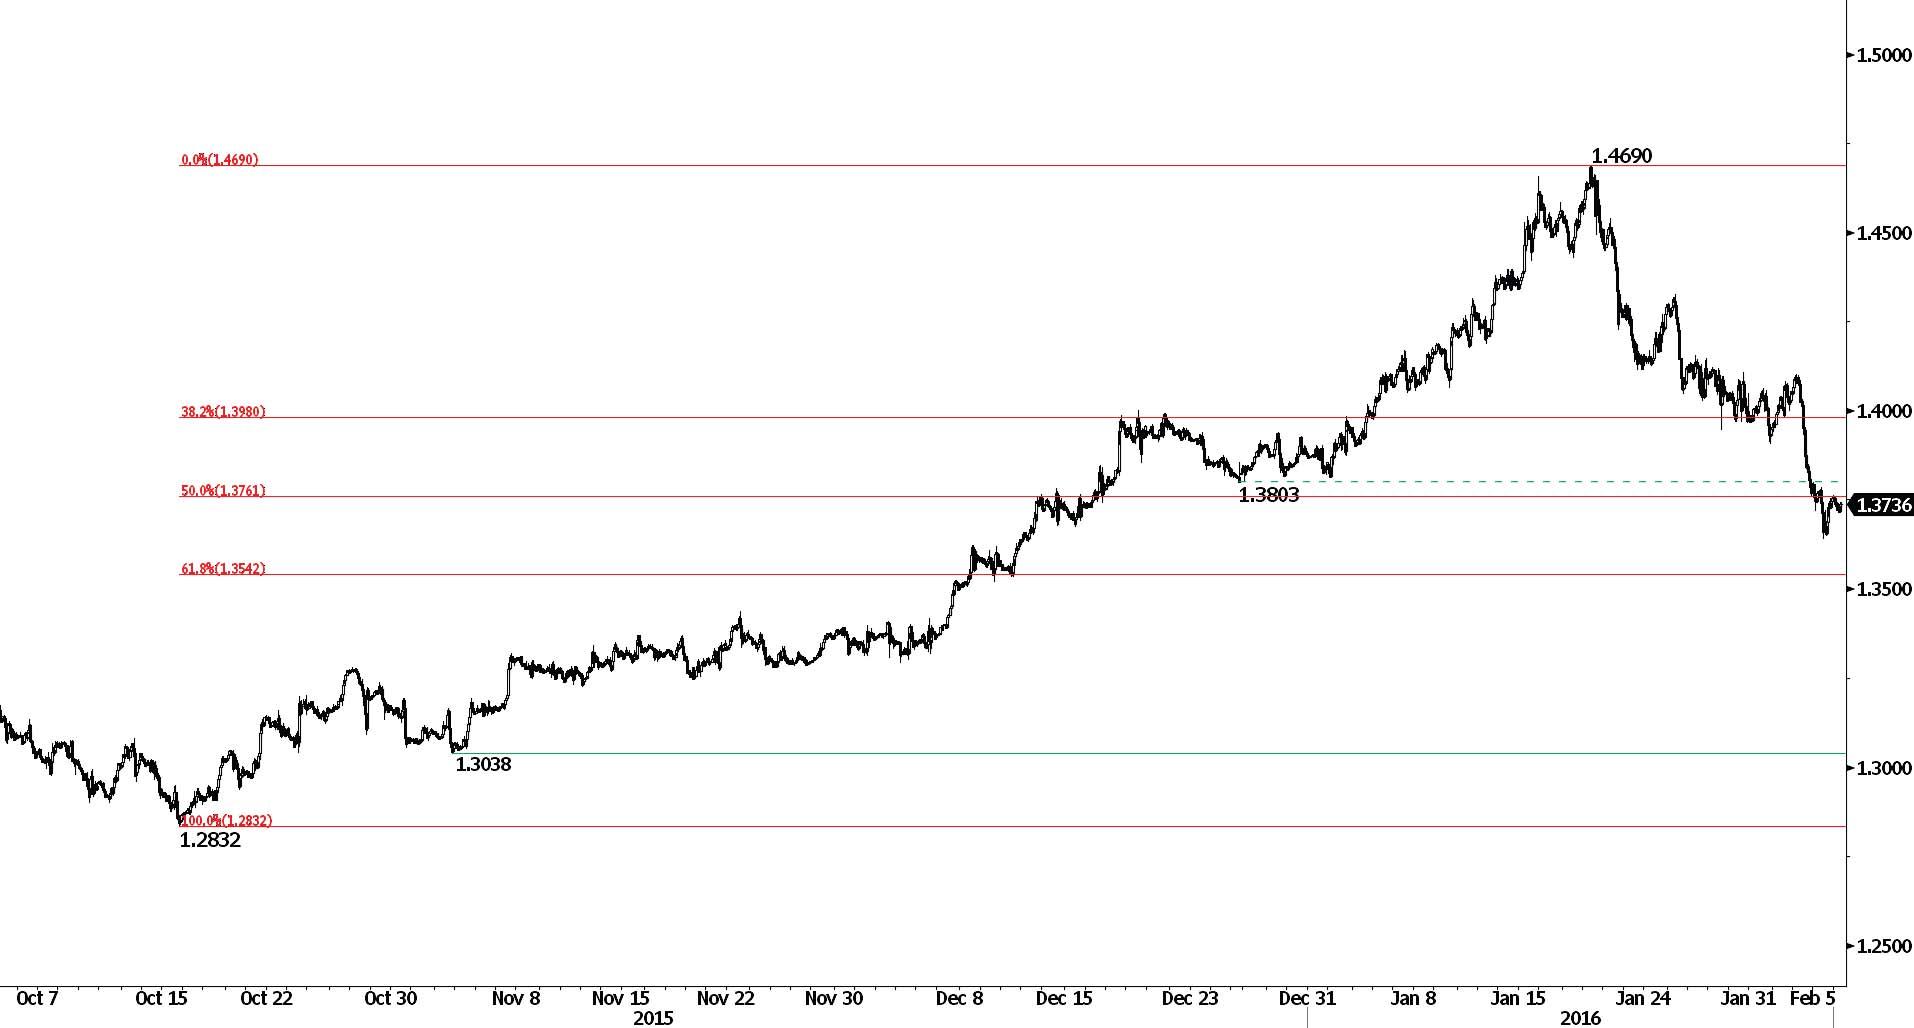
Breaking 50% Fibonacci retracement.
USD/CAD's bearish momentum keeps going. Hourly support lies at 61.8% Fibonacci retracement at 1.3542. Daily resistance can be found at 1.4690 (20/01/2015 high). Expected to show further decline.
In the longer term, the break of the key resistance at 1.3065 (13/03/2009 high) has indicated increasing buying pressures, which favours further medium-term strengthening. Strong resistance is given at 1.4948 (21/03/2003 high). Support can be found at 1.2832 (15/10/2015 low) then 1.1731 (06/01/2015 low).
AUD/USD
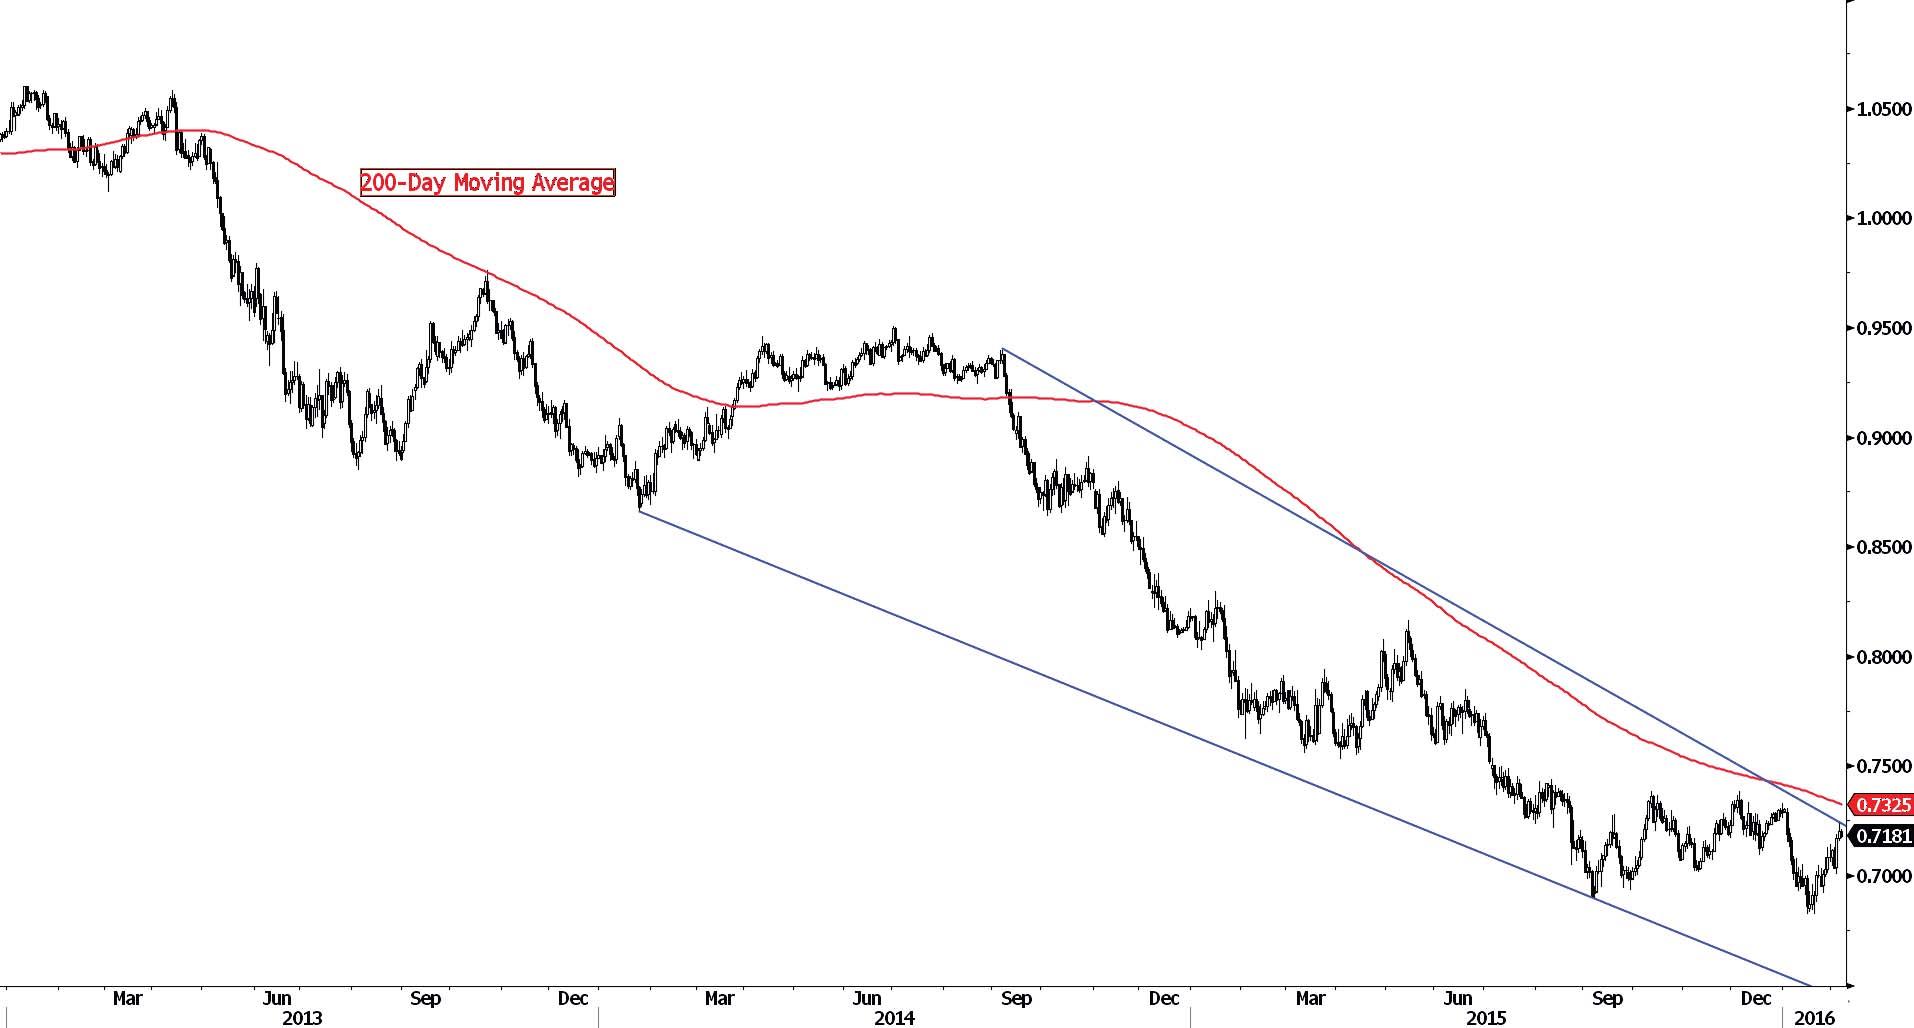
Monitoring long-term downtrend channel.
AUD/USD keeps on increasing. Hourly support lies at 0.6827 (15/01/2015 low). Hourly resistance is given at 0.7328 (31/12/2015 high). Even if the medium-term technical structure remains clearly negative, expected to show continued shortterm increase.
In the long-term, we are waiting for further signs that the current downtrend is ending. Key supports stand at 0.6009 (31/10/2008 low) . A break of the key resistance at 0.8295 (15/01/2015 high) is needed to invalidate our long-term bearish view. In addition, we still note that the pair remains well below the 200-dma which confirms selling pressures.
EUR/CHF
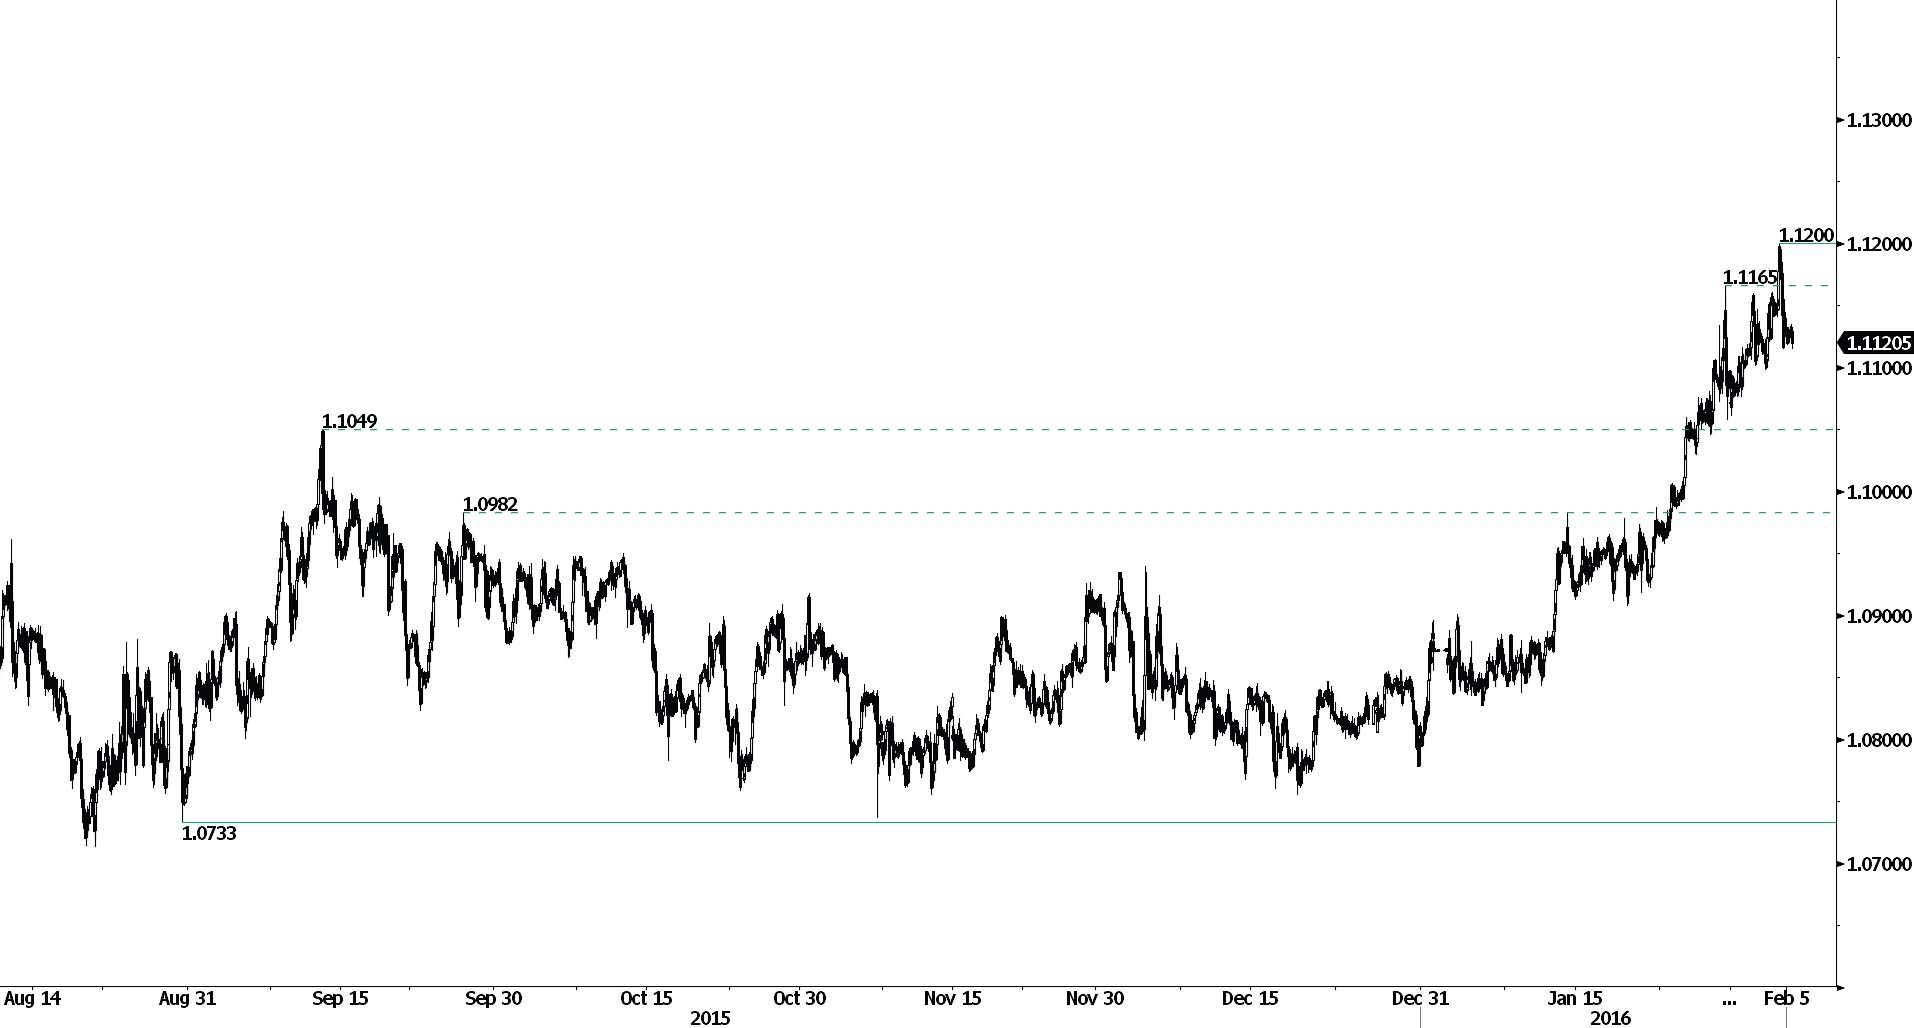
Strong momentum starts to slow.
EUR/CHF's bullish momentum is now weakening. Hourly resistance lies at 1.1200 (04/02/2016 high). Hourly support lies at 1.0733 (28/08/2015 low). Expected to show continued increase towards 1.1200.
In the longer term, the technical structure is positive as prices have broken resistance at 1.1049 (11/09/20115 high). Yet,the ECB's QE programme is likely to cause persistent selling pressures on the euro, which should weigh on EUR/CHF. Supports can be found at 1.0184 (28/01/2015 low) and 1.0082 (27/01/2015 low).
EUR/JPY
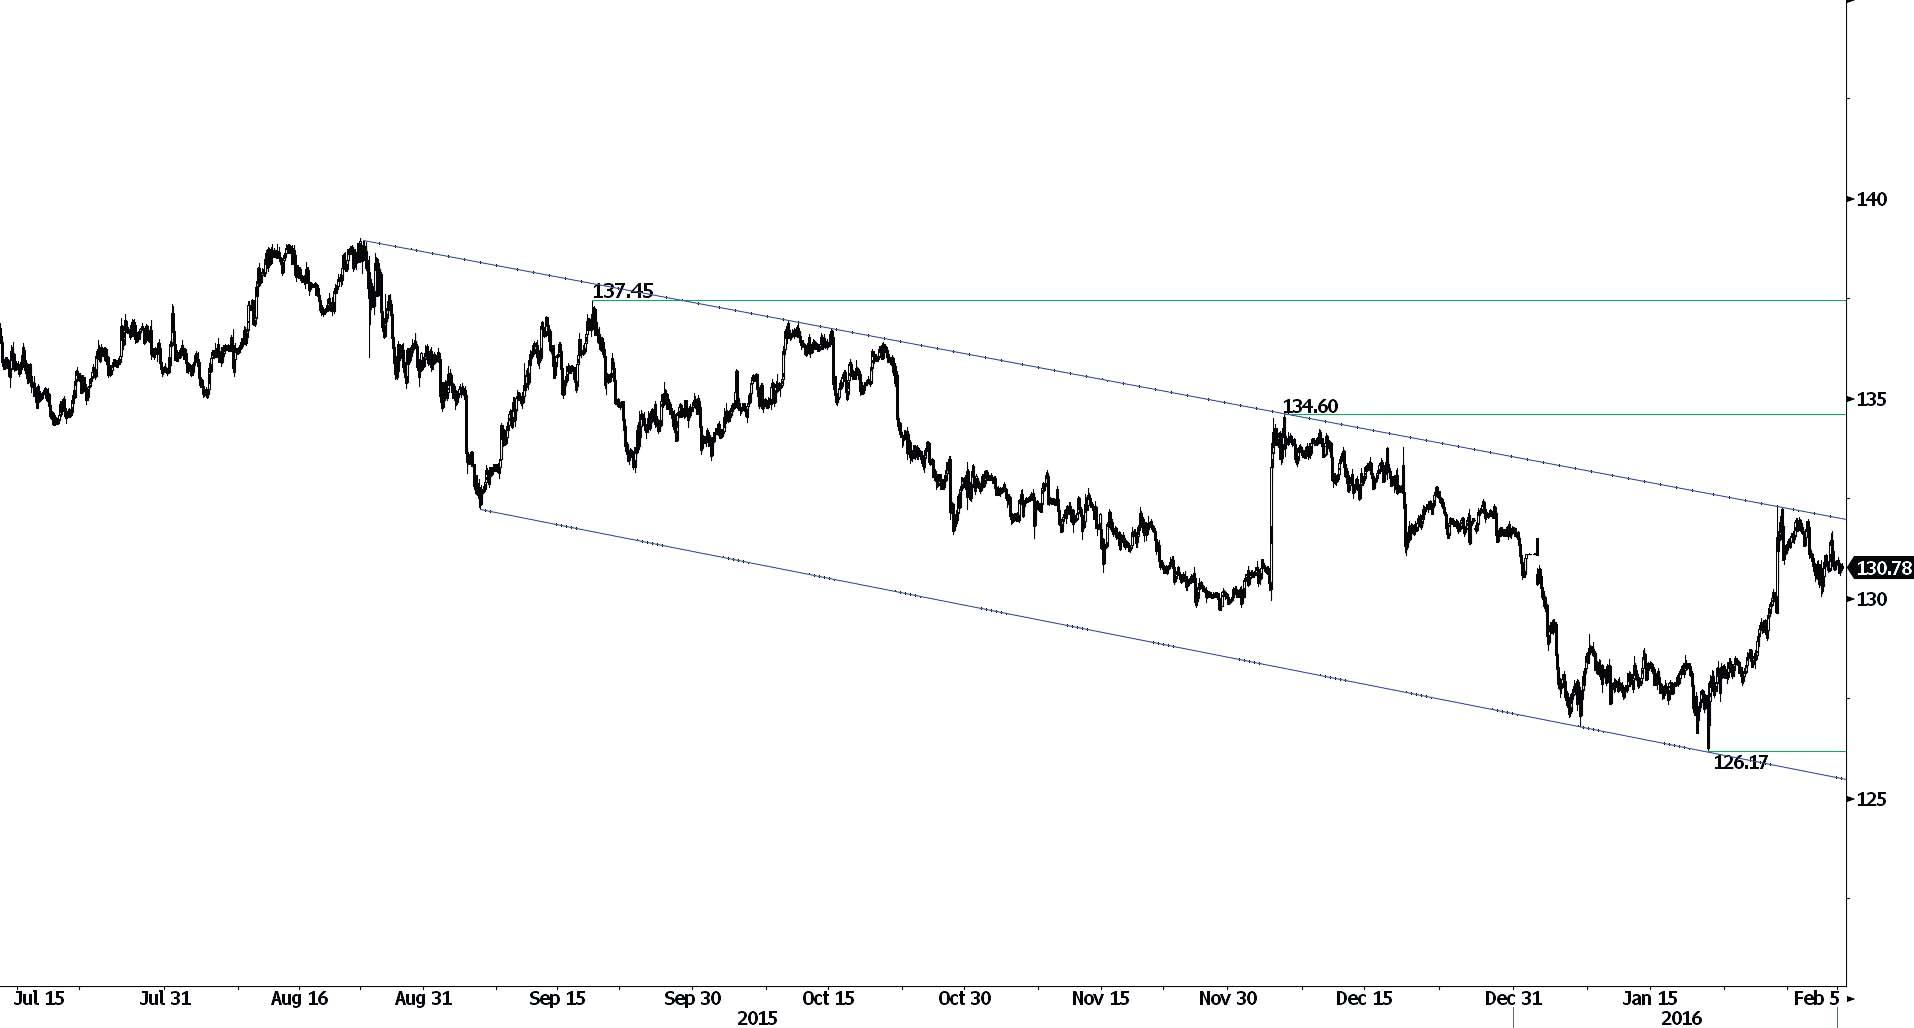
Riding the downtrend channel.
EUR/JPY is monitoring the upper bound implied by the downtrend channel. Hourly resistance lies at 134.60 (04/12/2015 high). Stronger resistance is located at 137.45 (17/09/2015 high). Expected to bounce back.
In the longer term, the technical structure validates a medium-term succession of lower highs and lower lows. As a result, the resistance at 149.78 (08/12/2014 high) has likely marked the end of the rise that started in July 2012. Key supports stand at 124.97 (13/06/2013 low) and 118.73 (25/02/2013 low). A key resistance can be found at 141.06 (04/06/2015 high).
EUR/GBP
Back to highest level of the year.
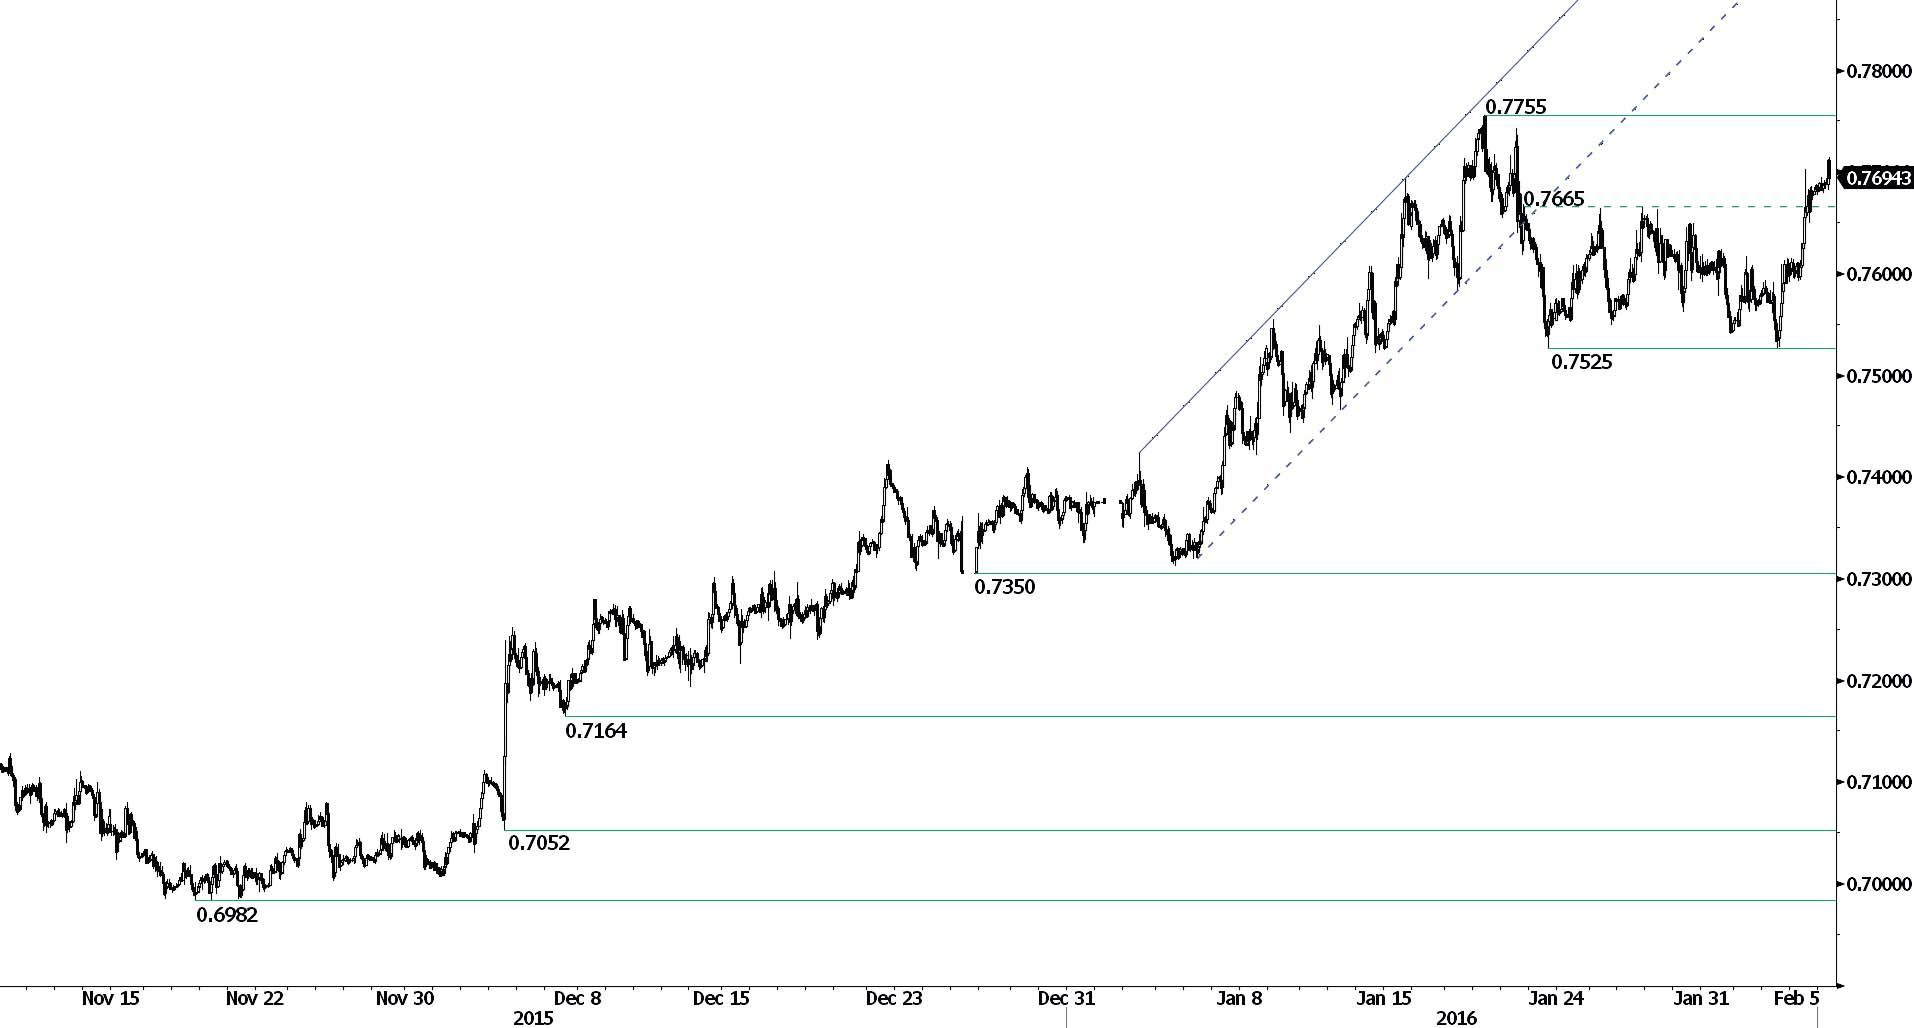
EUR/GBP has exited its range by breaking hourly resistance at 0.7665 (21/01/2015 high). hourly support can be found at 0.7525 (22/01/2015 low). Expected to show further increase.
In the long-term, prices tend to reverse from the underlying declining trend. The general oversold conditions suggest a growing upside momentum. A key resistance at 0.7592 (03/02/2015) has been broken.
GOLD (in USD)
Solid momentum.
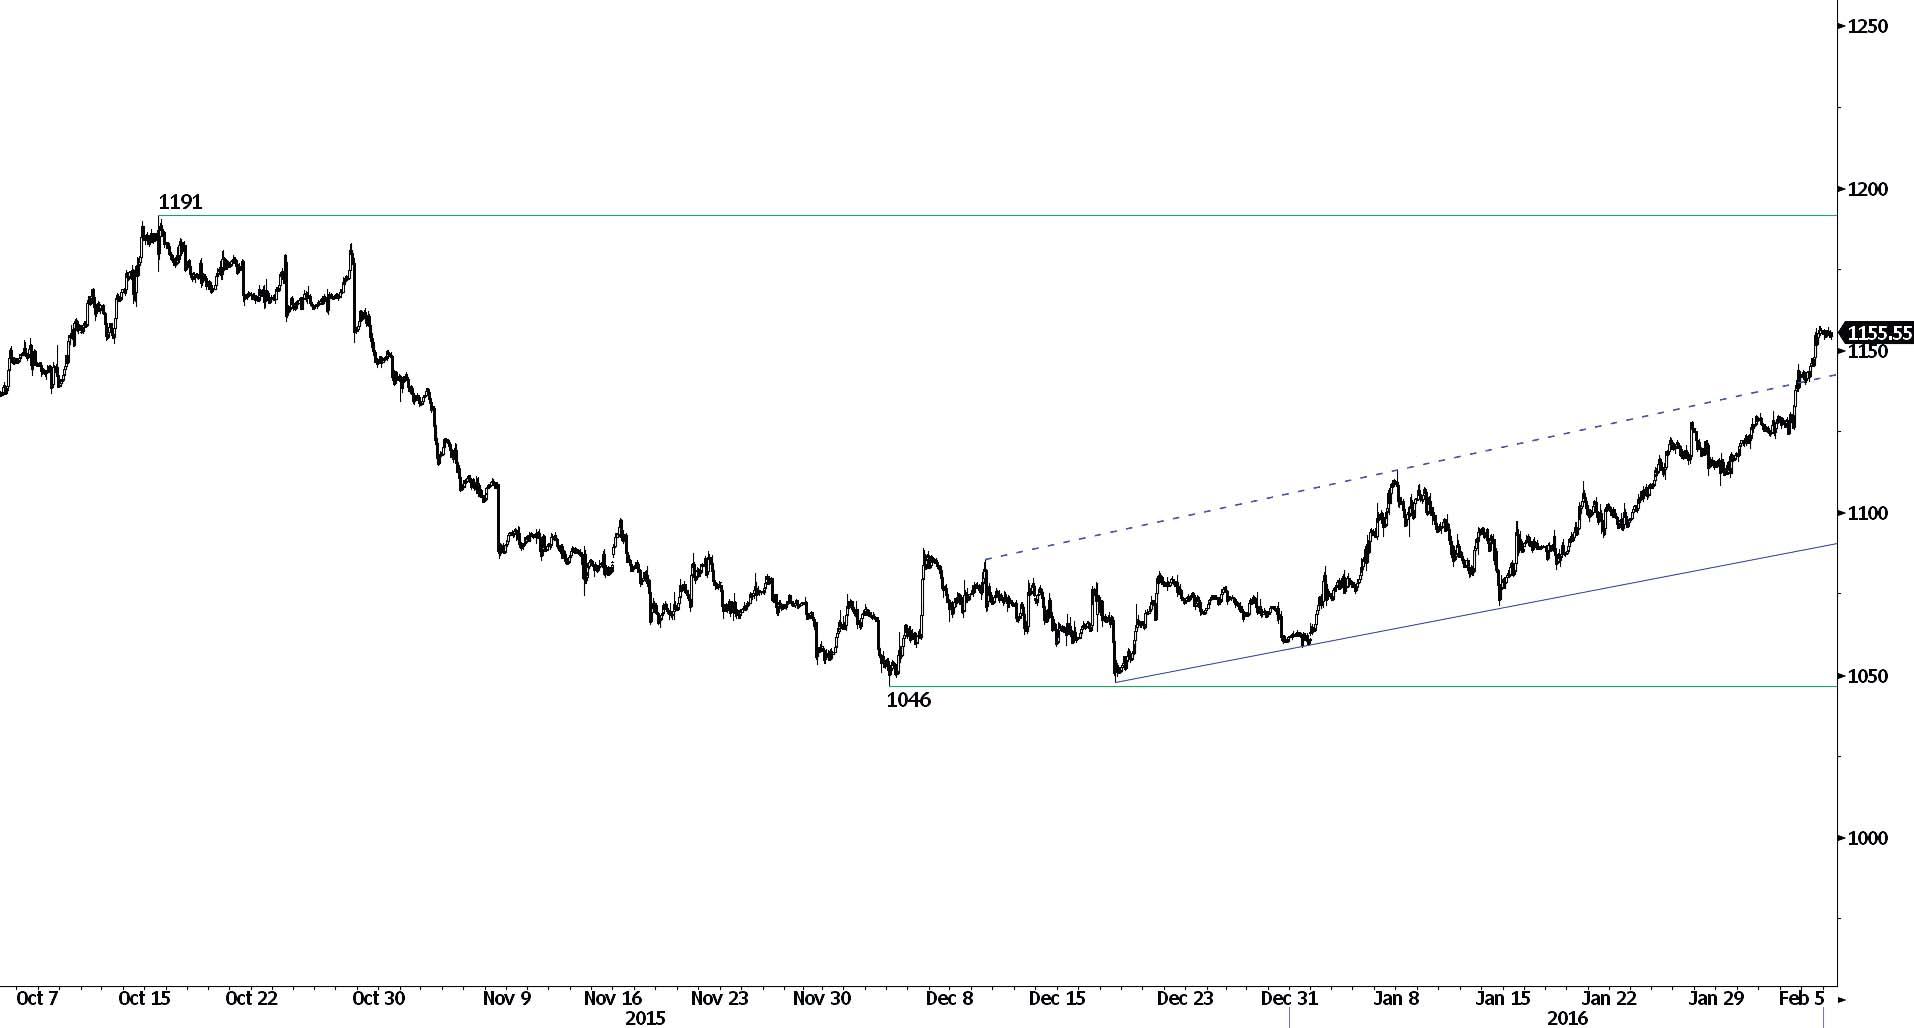
Gold continues to move higher. Hourly support is given at 1046 (03/12/2015 low) and hourly resistance can be found at 1191 (15/10/2015 high). Expected to show a deeper upside move.
In the long-term, the underlying downtrend (see declining channel) continues to favour a bearish bias. A break of the resistance at 1223 is needed to suggest something more than a temporary rebound. A major support can be found at 1045 (05/02/2010 low).
SILVER (in USD)
Monitoring the 50% Fibonacci retracement.
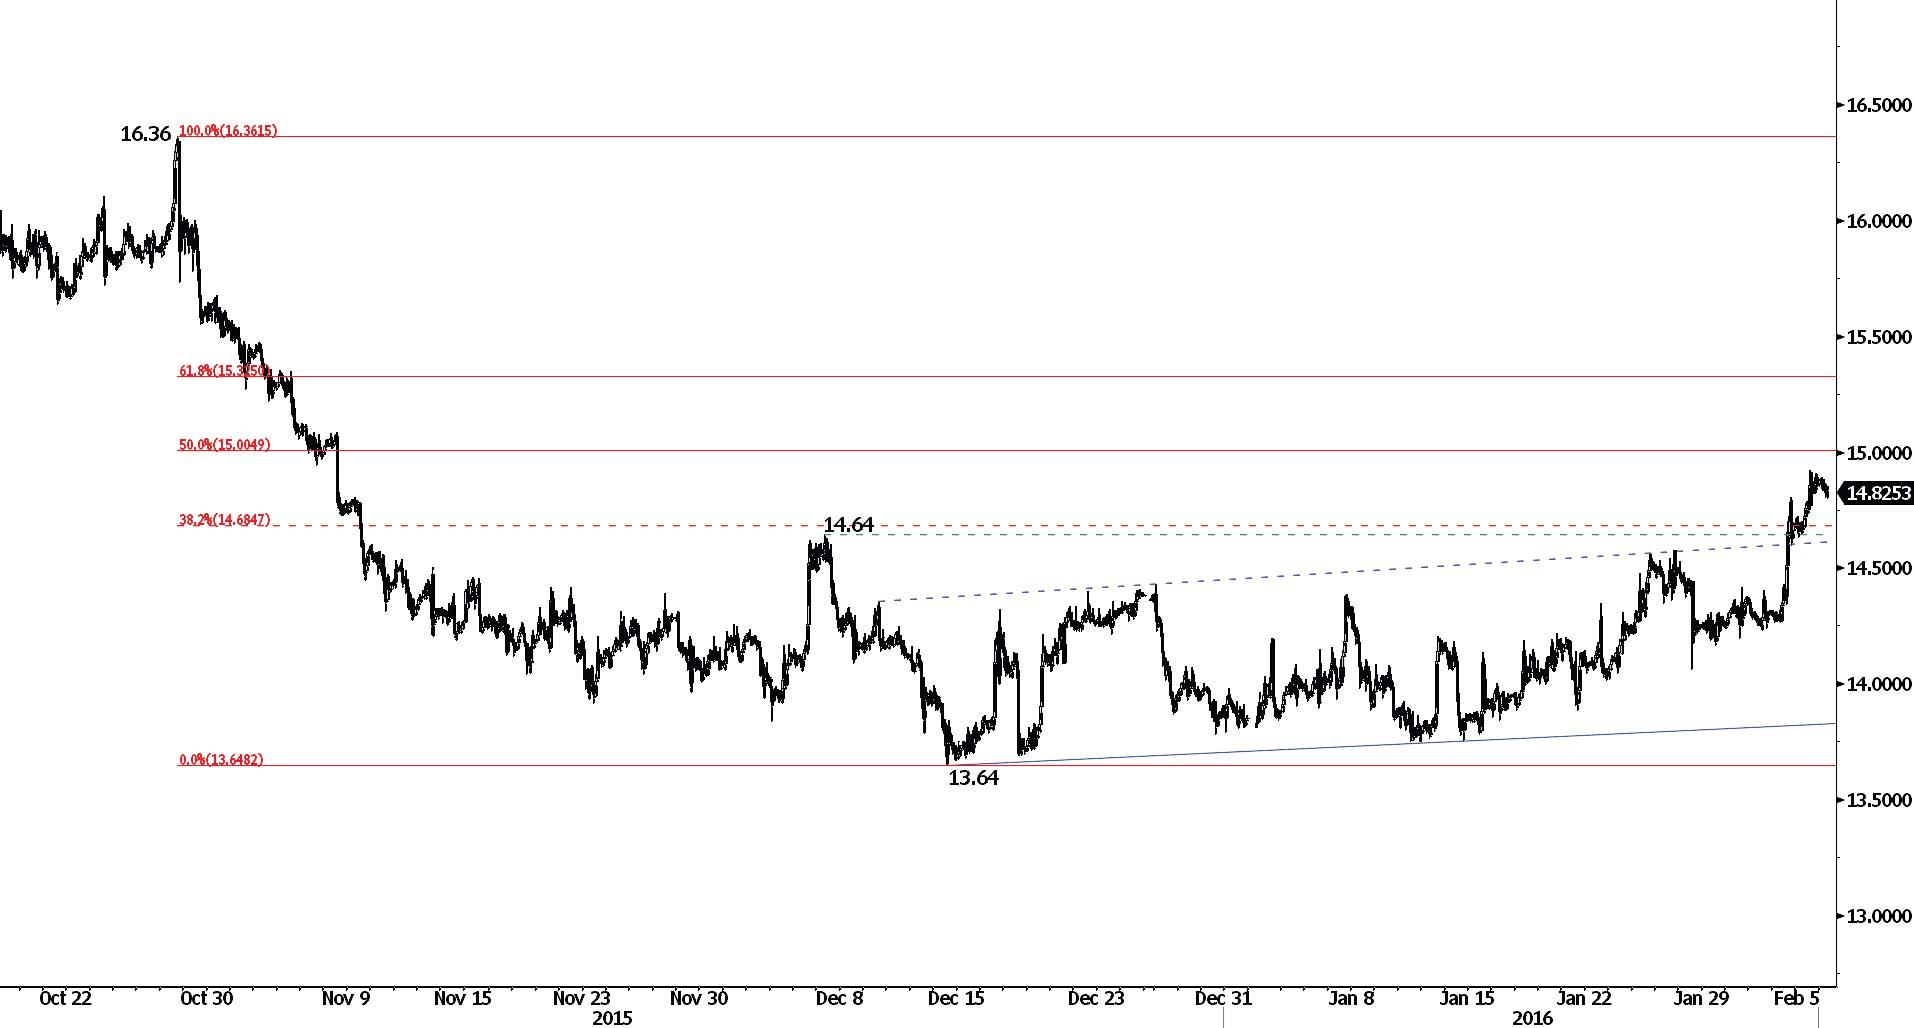
Silver is increasing. Hourly support is given at 14.16 (29/01/2016 low). Hourly resistance lies at the 50% Fibonacci retracement. The overall technical structure suggests further increase.
In the long-term, the break of the major support area between 18.64 (30/05/2014 low) and 18.22 (28/06/2013 low) confirms an underlying downtrend. Strong support can be found at 11.75 (20/04/2009). A key resistance stands at 18.89 (16/09/2014 high).
Crude Oil (in USD)
Pausing below 32.00.
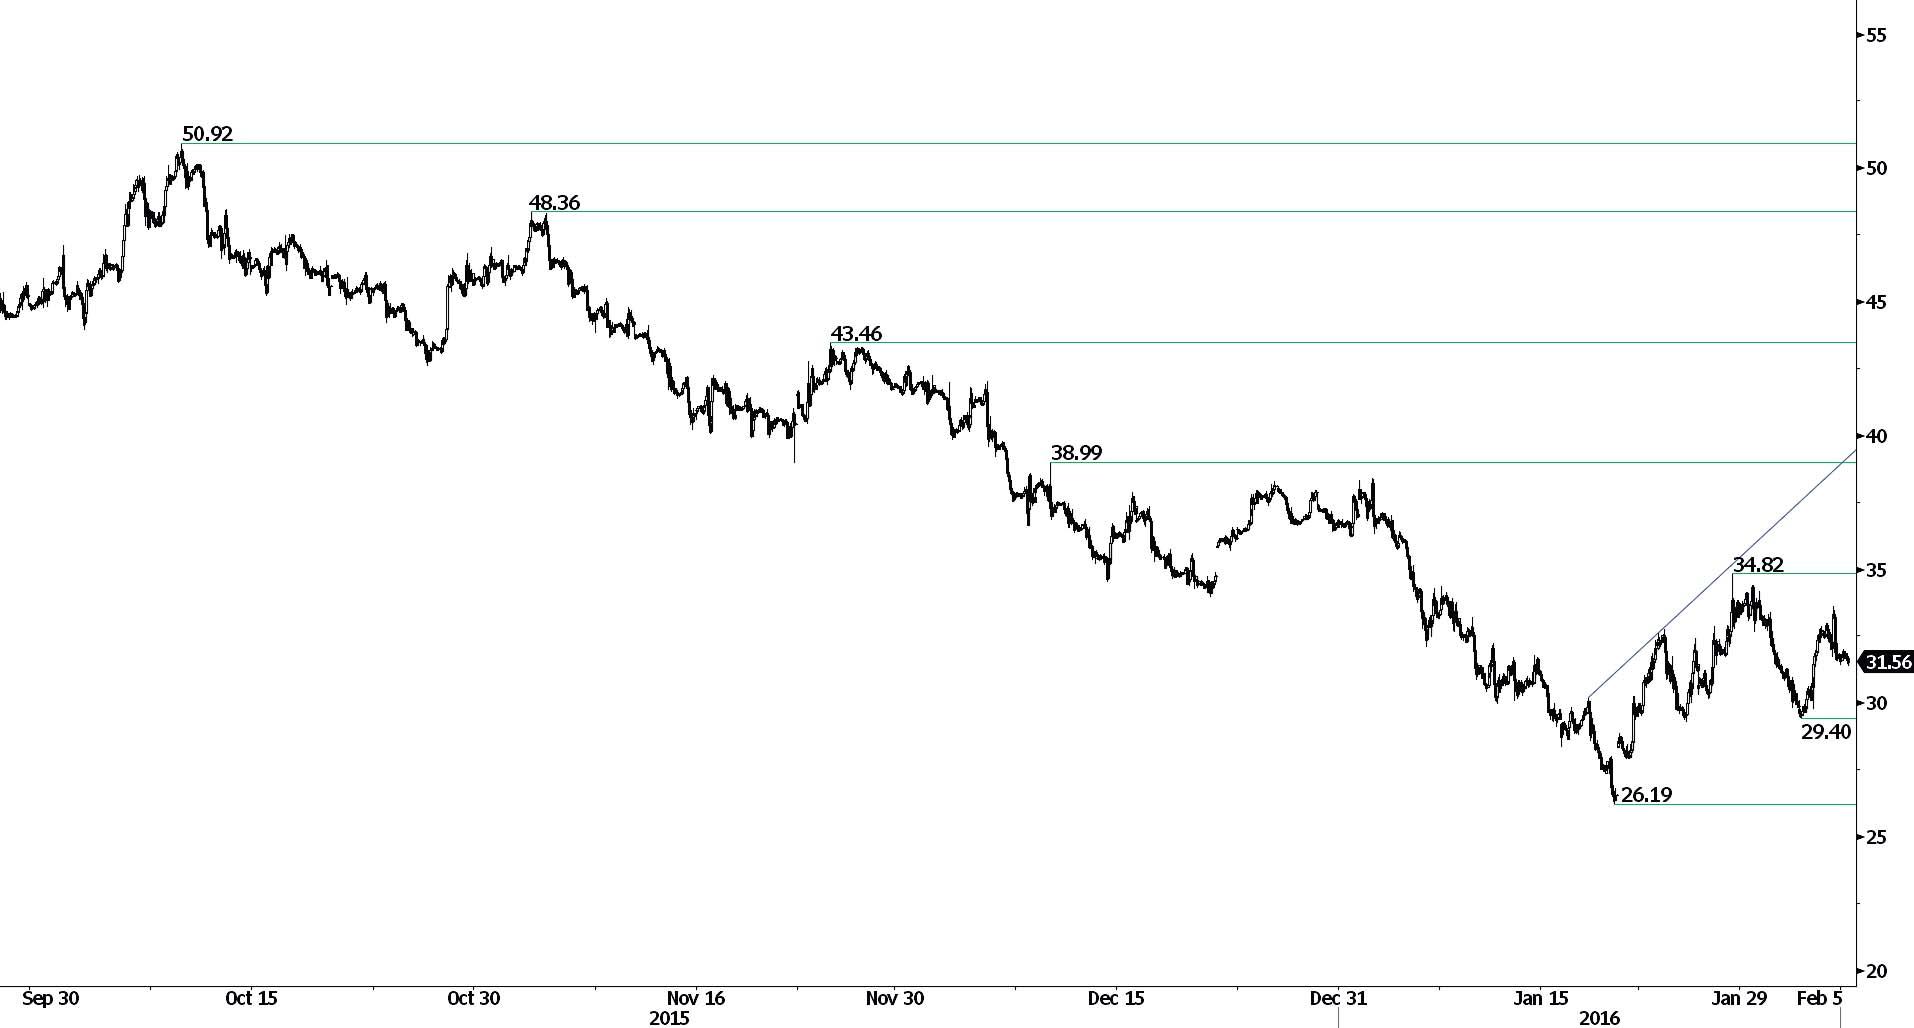
Crude is weakening below 32.00. The technical structure remains clearly negative in a context of oil oversupply. Hourly support is given at 26.19 (20/01/2016 low) and hourly resistance can be found at 34.82 (28/01/2016 high). Expected to see further decline.
In the long-term, crude oil is on a sharp decline and is of course no showing any signs of recovery. Strong support at 24.82 (13/11/2002) is now on target. Crude oil is holding way below its 200-Day Moving Average (setting up at around 47). There are currently no signs that a reverse trend may happen.
This report has been prepared by Swissquote Bank Ltd and is solely been published for informational purposes and is not to be construed as a solicitation or an offer to buy or sell any currency or any other financial instrument. Views expressed in this report may be subject to change without prior notice and may differ or be contrary to opinions expressed by Swissquote Bank Ltd personnel at any given time. Swissquote Bank Ltd is under no obligation to update or keep current the information herein, the report should not be regarded by recipients as a substitute for the exercise of their own judgment.
Recommended Content
Editors’ Picks
EUR/USD fluctuates near 1.0700 after US data

EUR/USD stays in a consolidation phase at around 1.0700 in the American session on Wednesday. The data from the US showed a strong increase in Durable Goods Orders, supporting the USD and making it difficult for the pair to gain traction.
USD/JPY refreshes 34-year high, attacks 155.00 as intervention risks loom

USD/JPY is renewing a multi-decade high, closing in on 155.00. Traders turn cautious on heightened risks of Japan's FX intervention. Broad US Dollar rebound aids the upside in the major. US Durable Goods data are next on tap.
Gold stays in consolidation above $2,300

Gold finds it difficult to stage a rebound midweek following Monday's sharp decline but manages to hold above $2,300. The benchmark 10-year US Treasury bond yield stays in the green above 4.6% after US data, not allowing the pair to turn north.
Worldcoin looks set for comeback despite Nvidia’s 22% crash Premium

Worldcoin price is in a better position than last week's and shows signs of a potential comeback. This development occurs amid the sharp decline in the valuation of the popular GPU manufacturer Nvidia.
Three fundamentals for the week: US GDP, BoJ and the Fed's favorite inflation gauge stand out Premium

While it is hard to predict when geopolitical news erupts, the level of tension is lower – allowing for key data to have its say. This week's US figures are set to shape the Federal Reserve's decision next week – and the Bank of Japan may struggle to halt the Yen's deterioration.
