![]() Yann Quelenn
Yann Quelenn
Swissquote Bank Ltd
Are you trading today? Read the Forex Trading Strategies for the Day.
EUR/USD
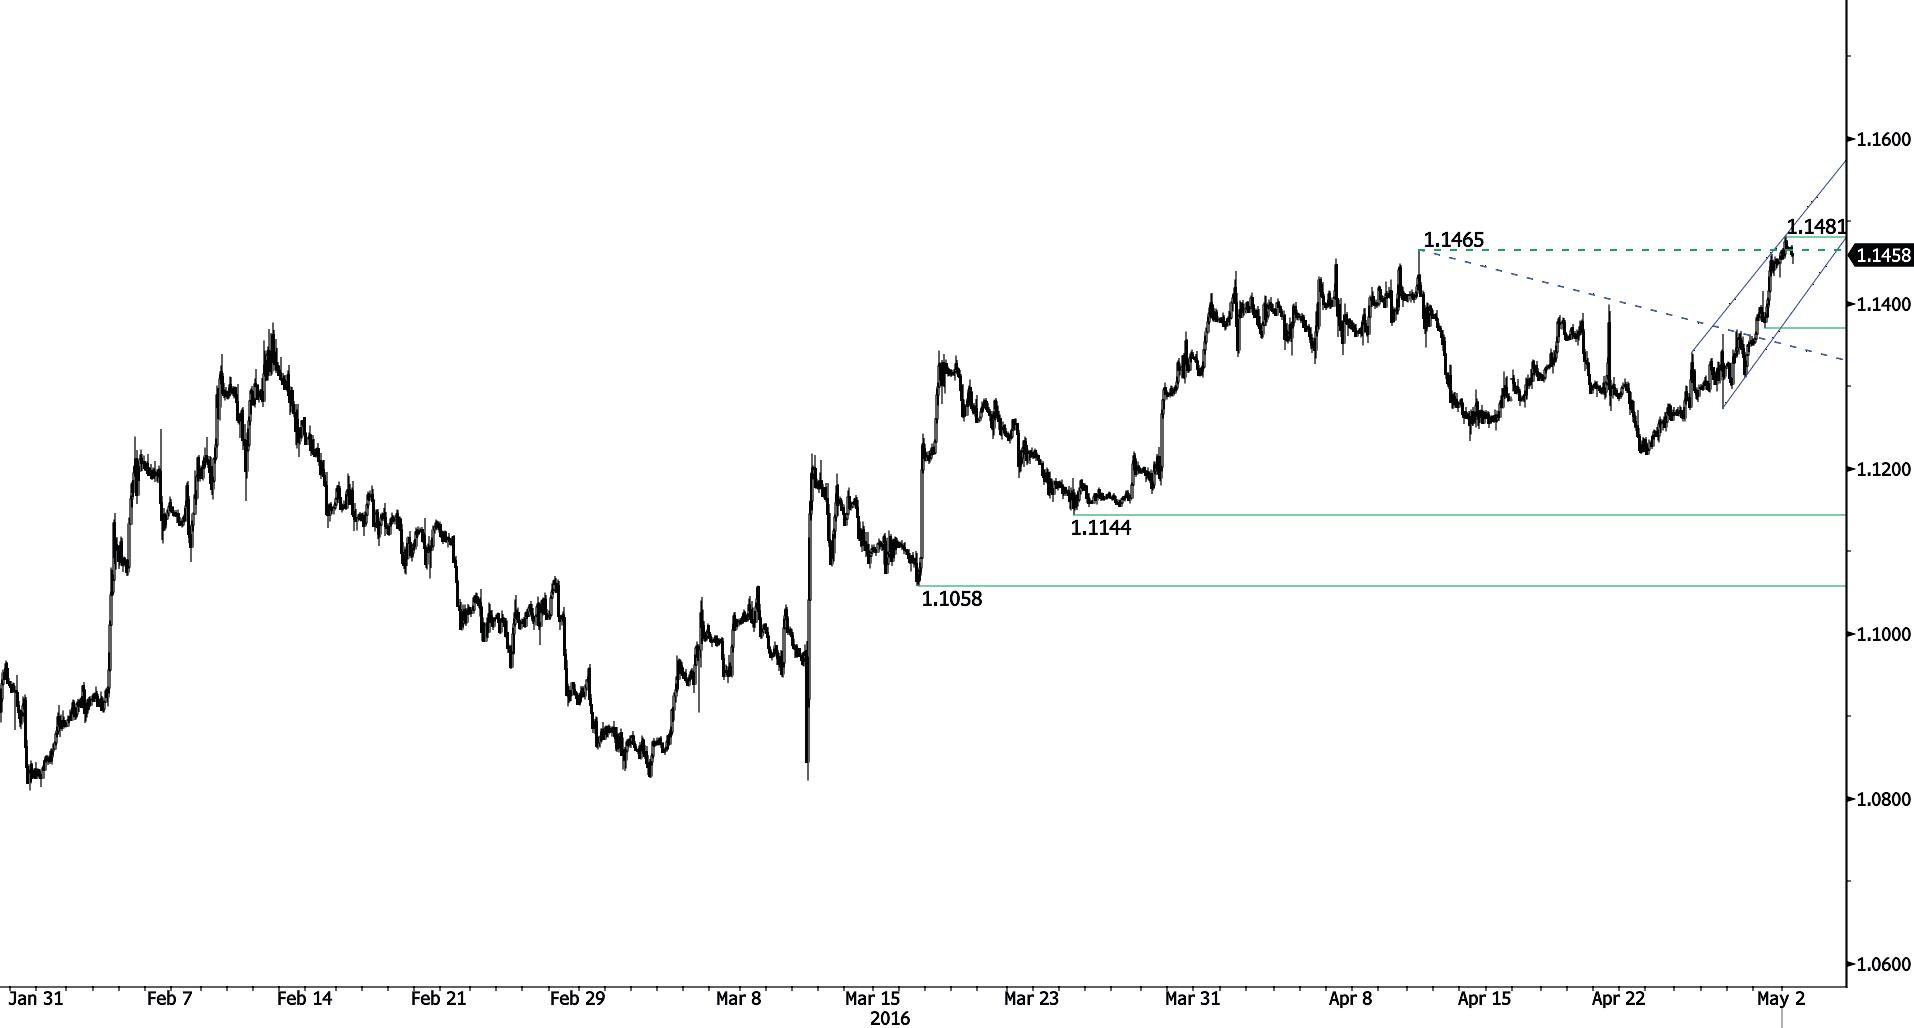
Breaking resistance at 1.1465.
-
EUR/USD keeps on increasing. Hourly resistance at 1.1465 (12/04/2016 high) has been broken. Hourly support is located at 1.1217 (25/041/2016 low) and stronger support can be found at 1.1144 (24/03/2016 low). Expected to show further increase.
-
In the longer term, the technical structure favours a bearish bias as long as resistance at 1.1746 ( holds. Key resistance is located at 1.1640 (11/11/2005 low). The current technical appreciation implies a gradual increase.
GBP/USD
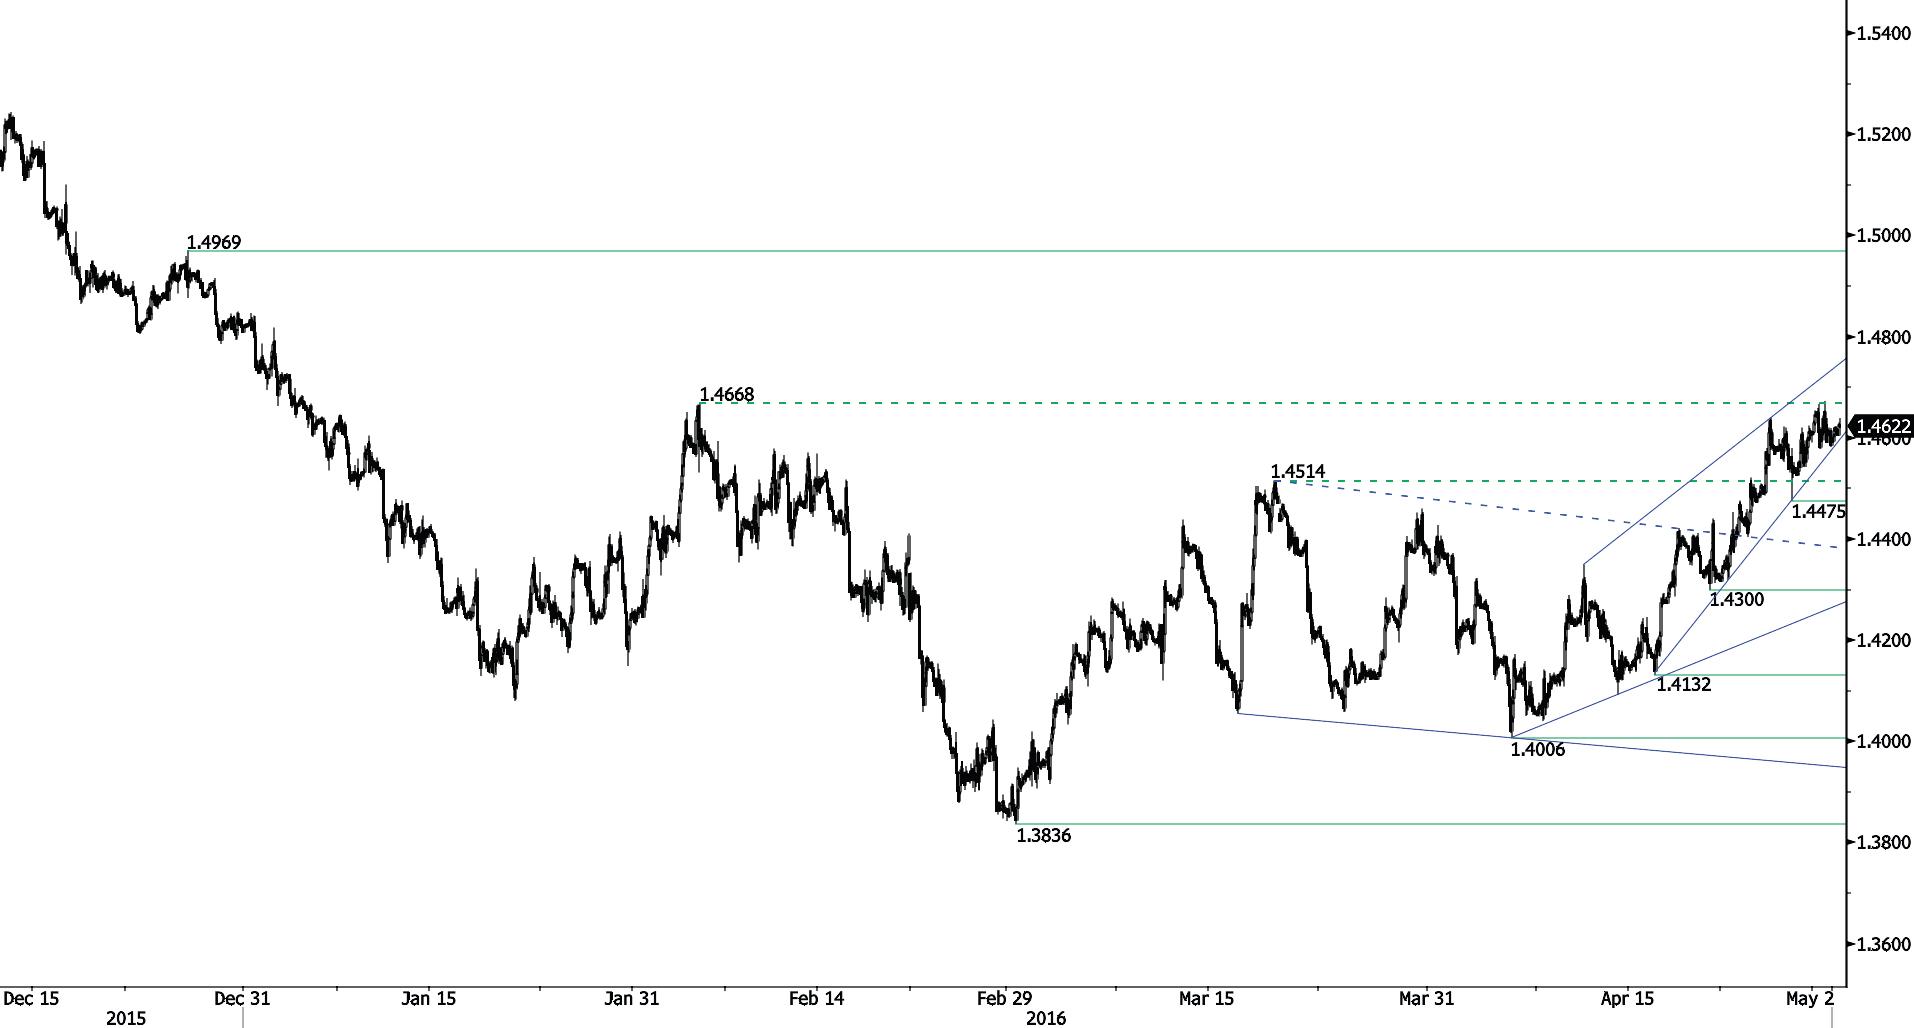
Trading sideways around strong resistance area.
-
GBP/USD has broken resistance at 1.4668 (04/02/2016 high). Hourly support is given at 1.4475 (27/04/2016 high). Expected to show further consolidation before entering into another upside move.
-
The long-term technical pattern is negative and favours a further decline towards key support at 1.3503 (23/01/2009 low), as long as prices remain below the resistance at 1.5340/64 (04/11/2015 low see also the 200 day moving average). However, the general oversold conditions and the recent pick-up in buying interest pave the way for a rebound.
USD/JPY
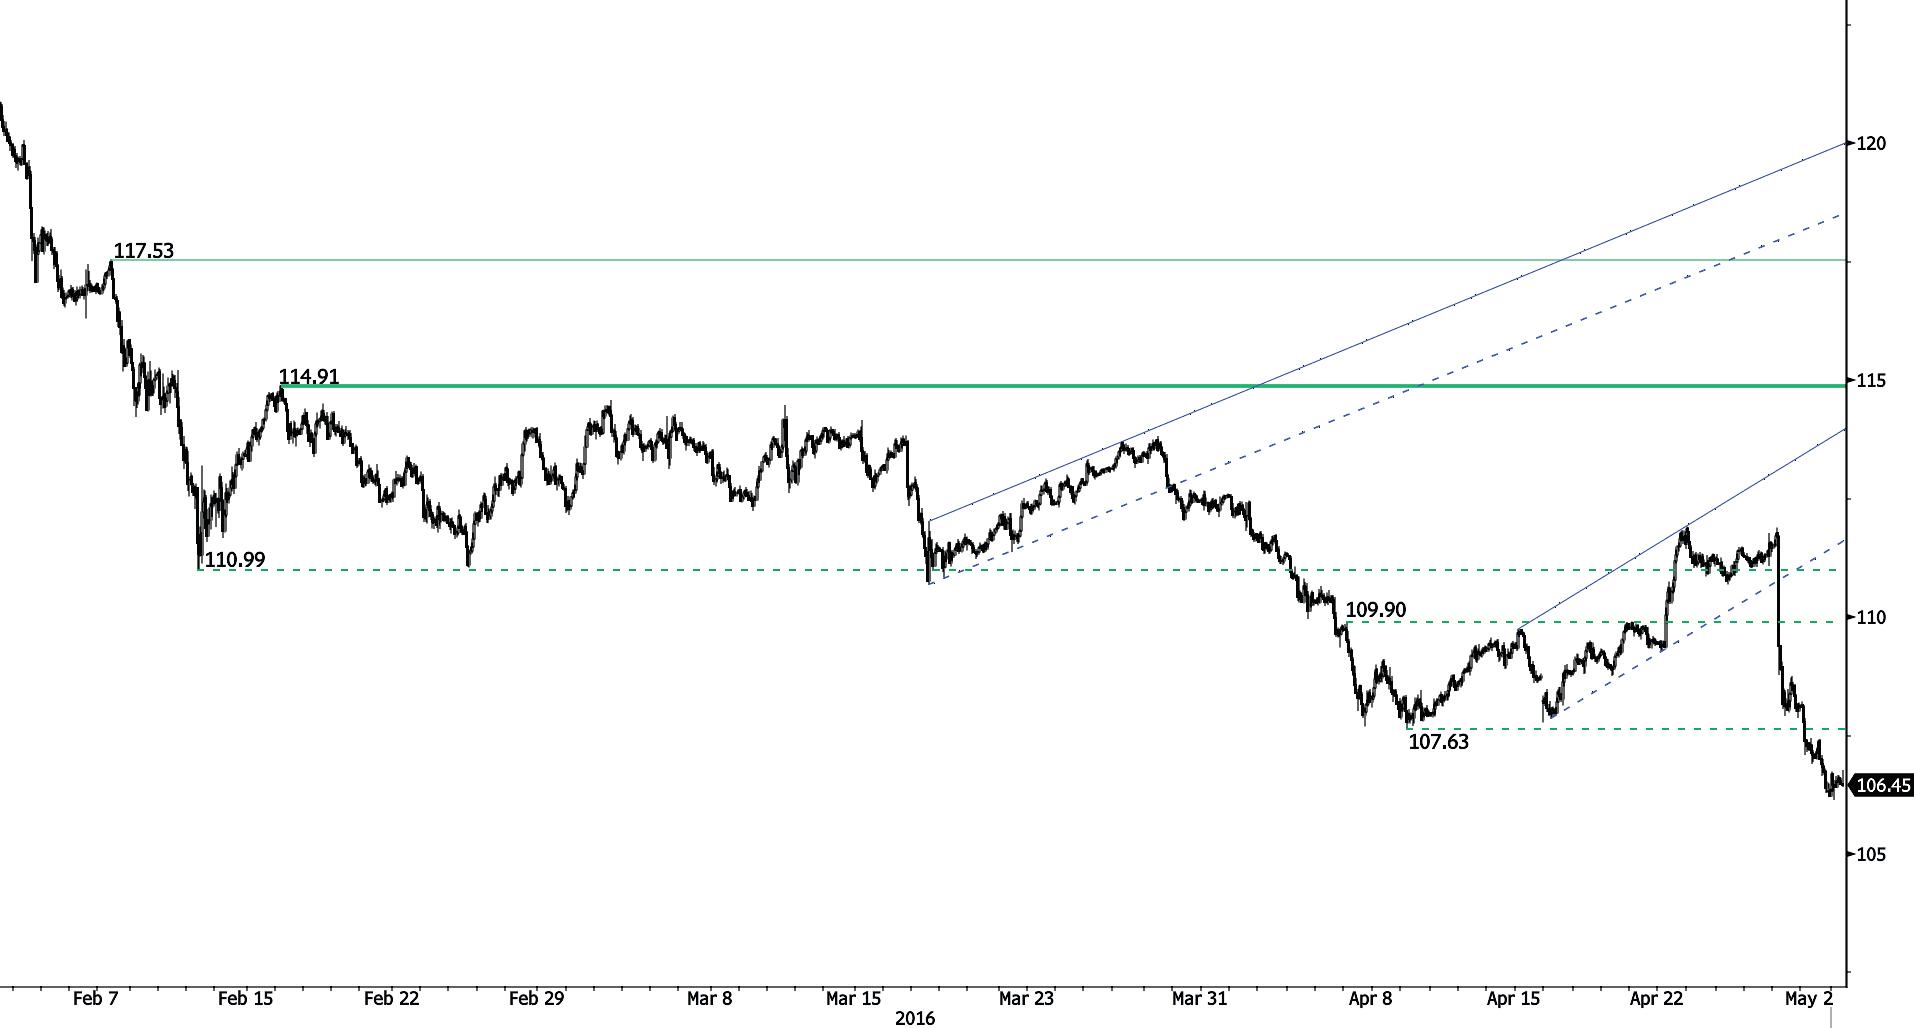
Weakening
-
USD/JPY keeps on declining. Hourly support can be found at 106.15 (intraday low). Hourly resistance can be found at 107.42 (29/04/2016 high), stronger resistance can be found at 111.88 (28/04/2016 high). Expected to show continued weakness.
-
We favour a long-term bearish bias. Support at 105.23 (15/10/2014 low) is on target. A gradual rise towards the major resistance at 135.15 (01/02/2002 high) seems now less likely. Another key support can be found at 105.23 (15/10/2014 low).
USD/CHF
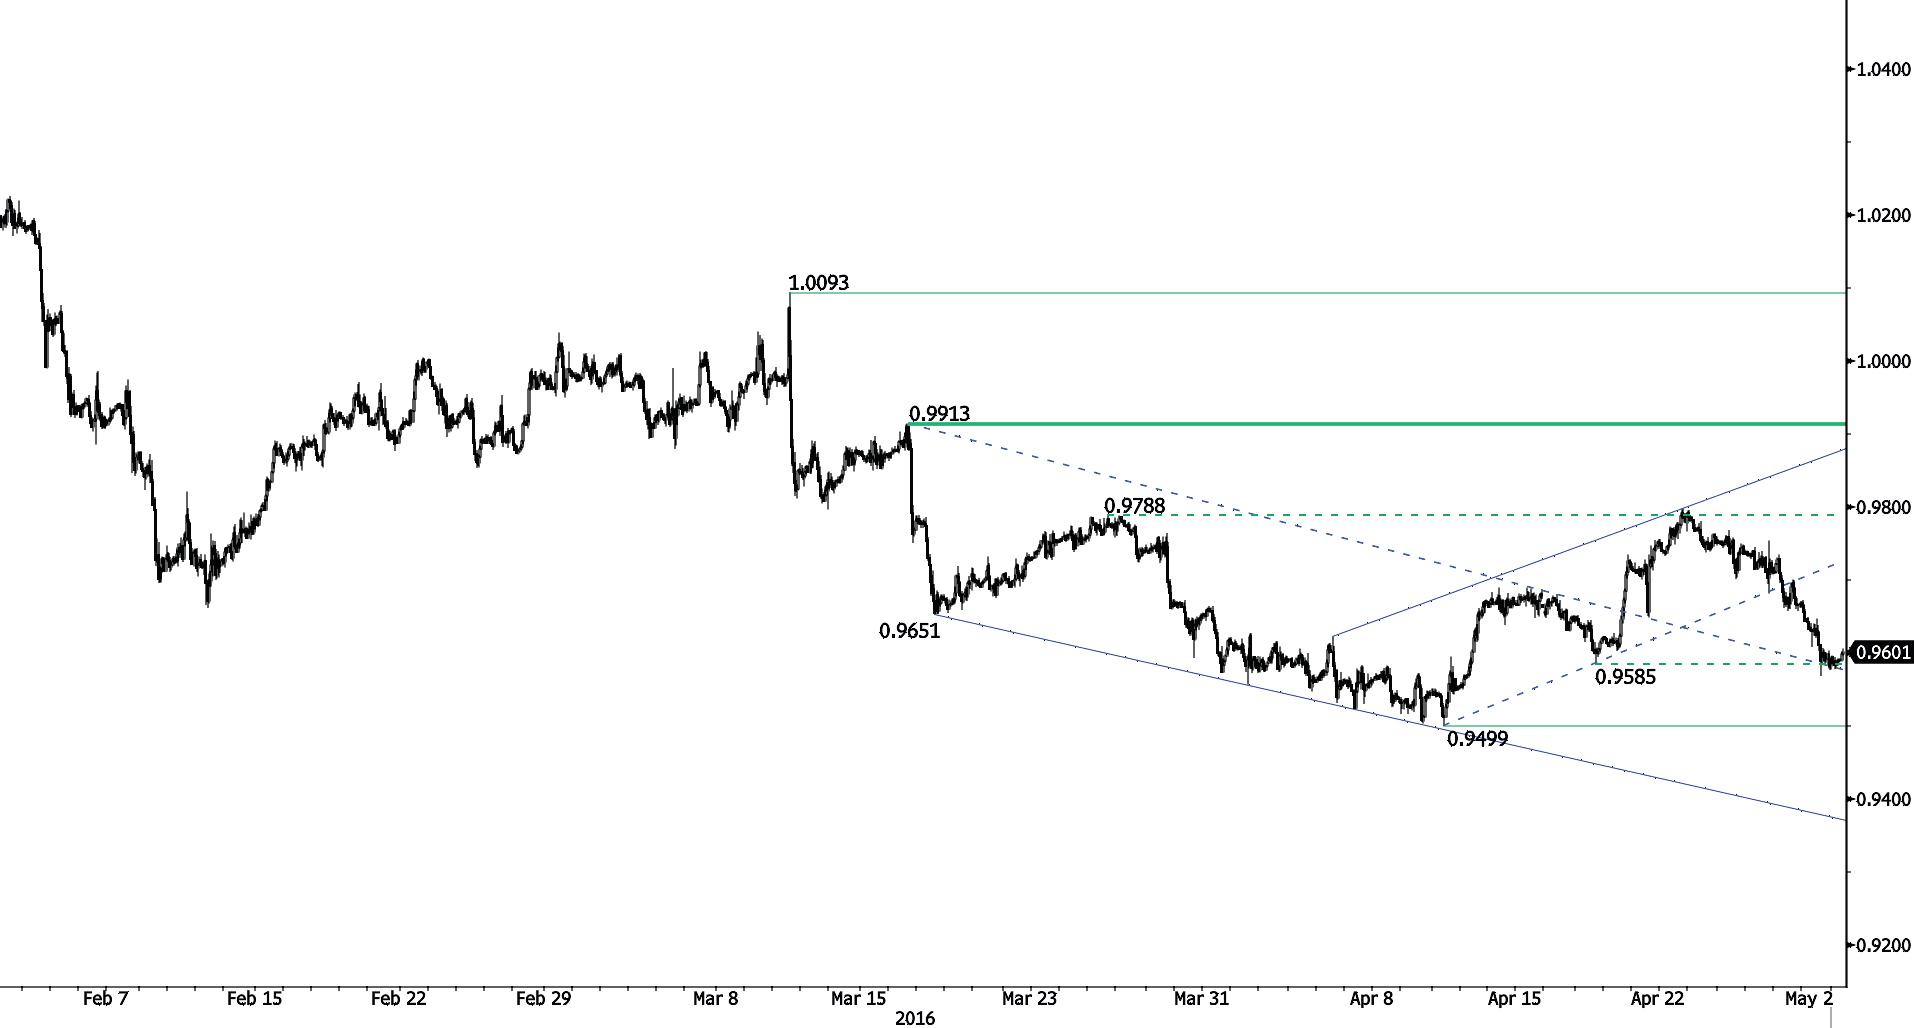
Breaking support at 0.9585.
-
USD/CHF is clearly oriented downwards on the medium-term and has broken hourly support at 0.9585 (19/04/2016 low). Stronger support can be found at 0.9499 (12/04/2016 low). Expected to show further further weakening.
-
In the long-term, the pair is setting highs since mid-2015. Key support can be found 0.8986 (30/01/2015 low). The technical structure favours a long term bullish bias.
USD/CAD
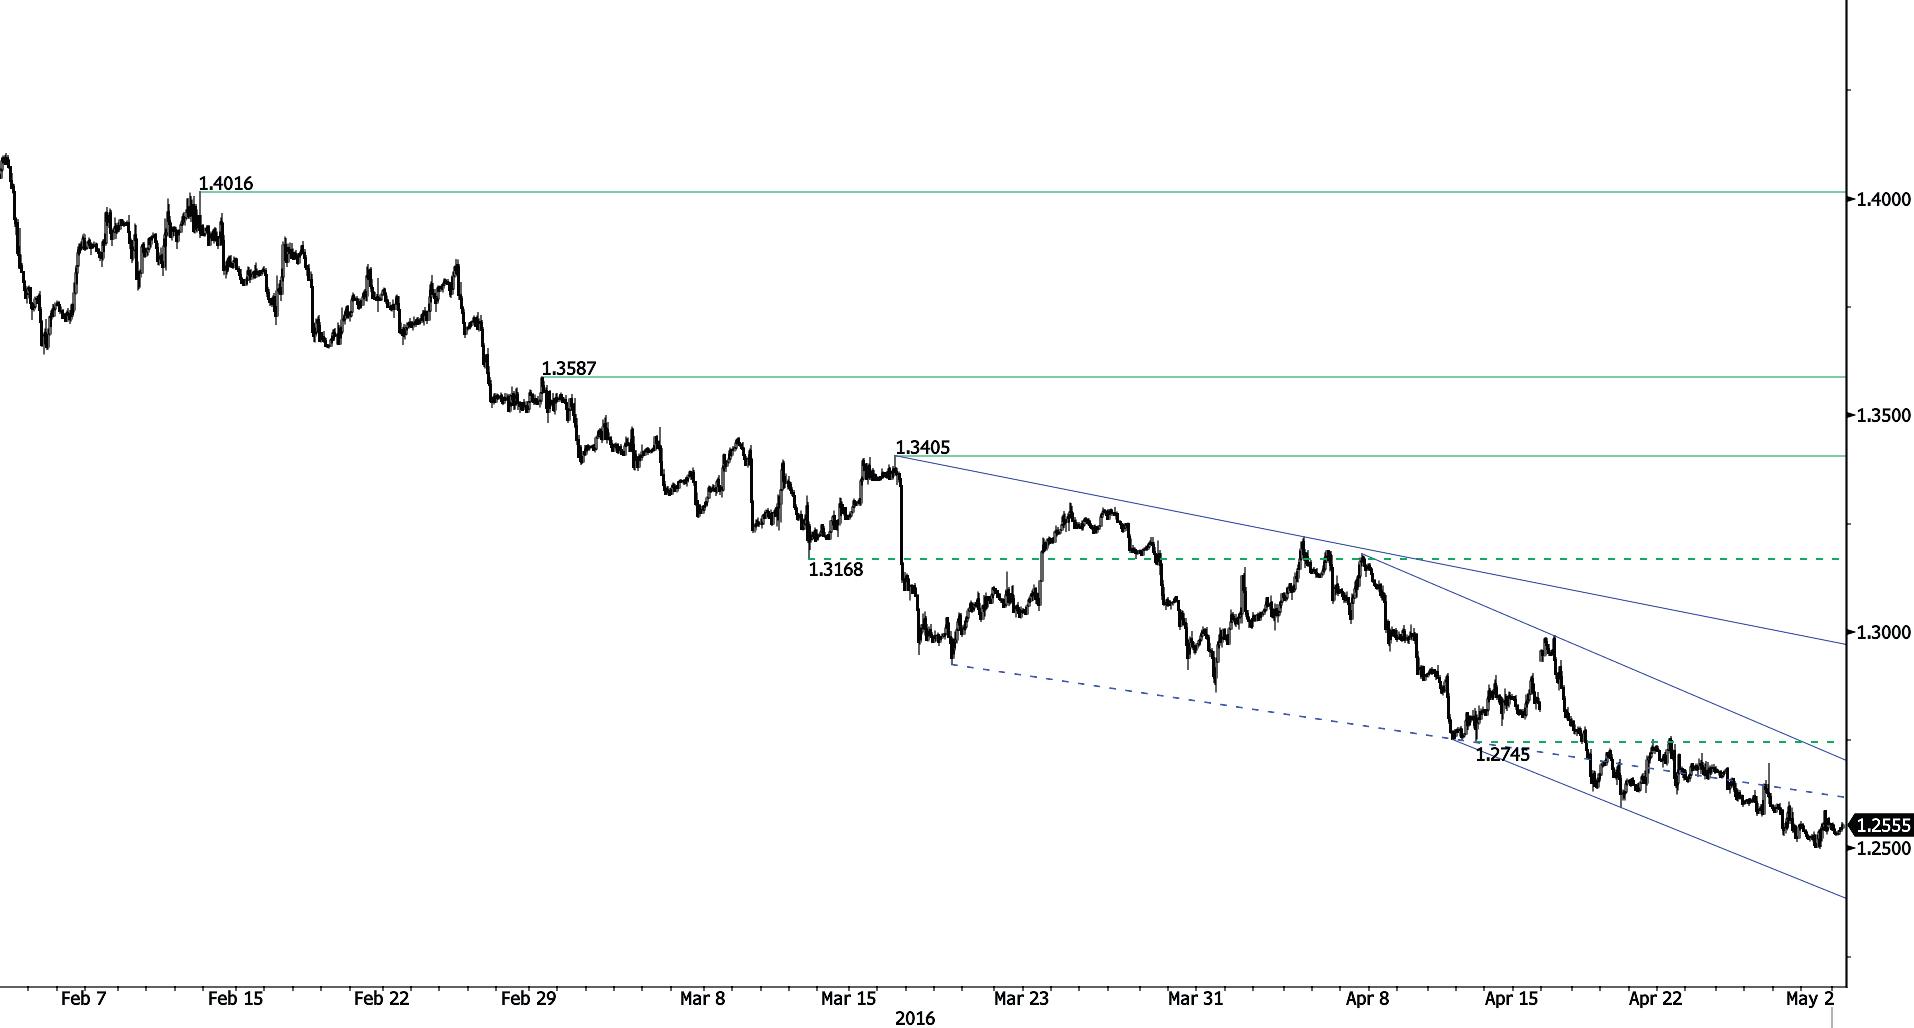
Fading around 1.2500.
-
USD/CAD's bearish momentum is still on. Hourly support is psychological level at 1.2500 (29/04/2016 low) while hourly resistance is given at 1.2587 (29/04/2016 high). Expected to show further monitoring of the support at 1.2500.
-
In the longer term, the pair is now trading well below the 200-day moving average. Strong resistance is given at 1.4948 (21/03/2003 high). Stronger support can be found at 1.1731 (06/01/2015 low).
AUD/USD
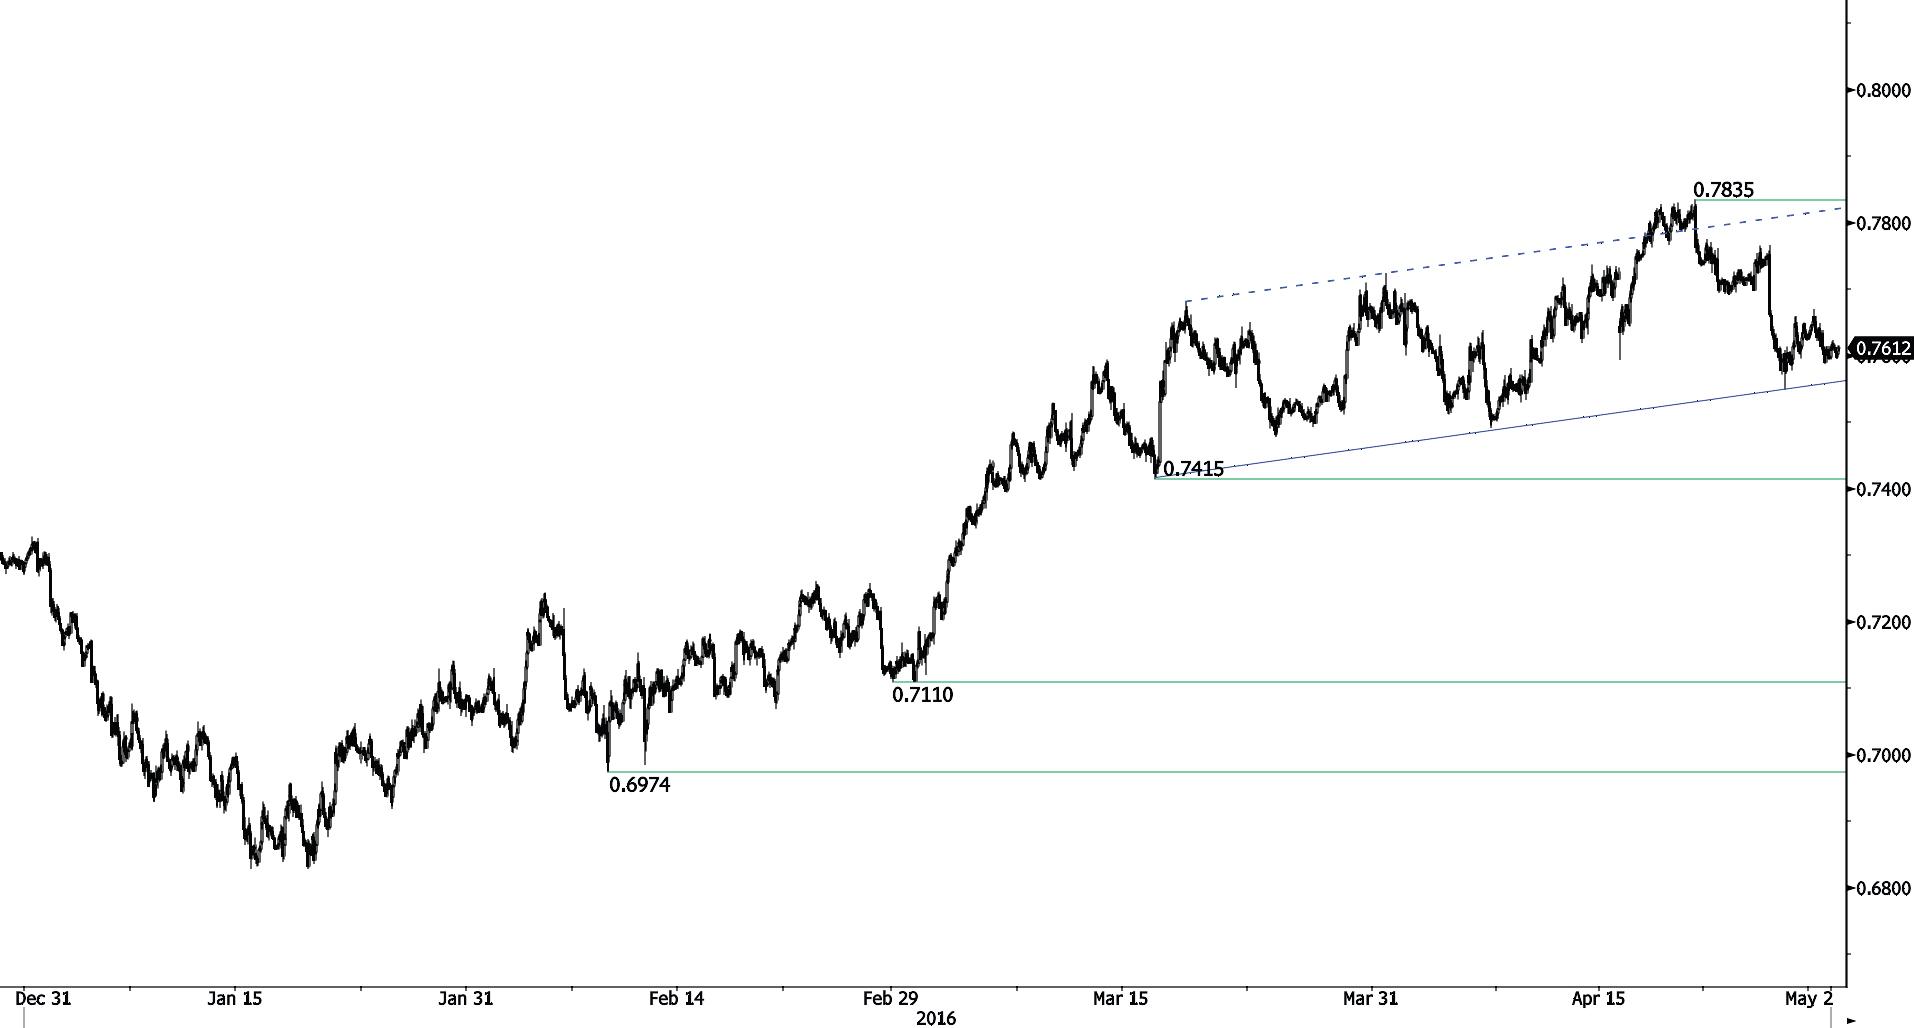
Ready to bounce back.
-
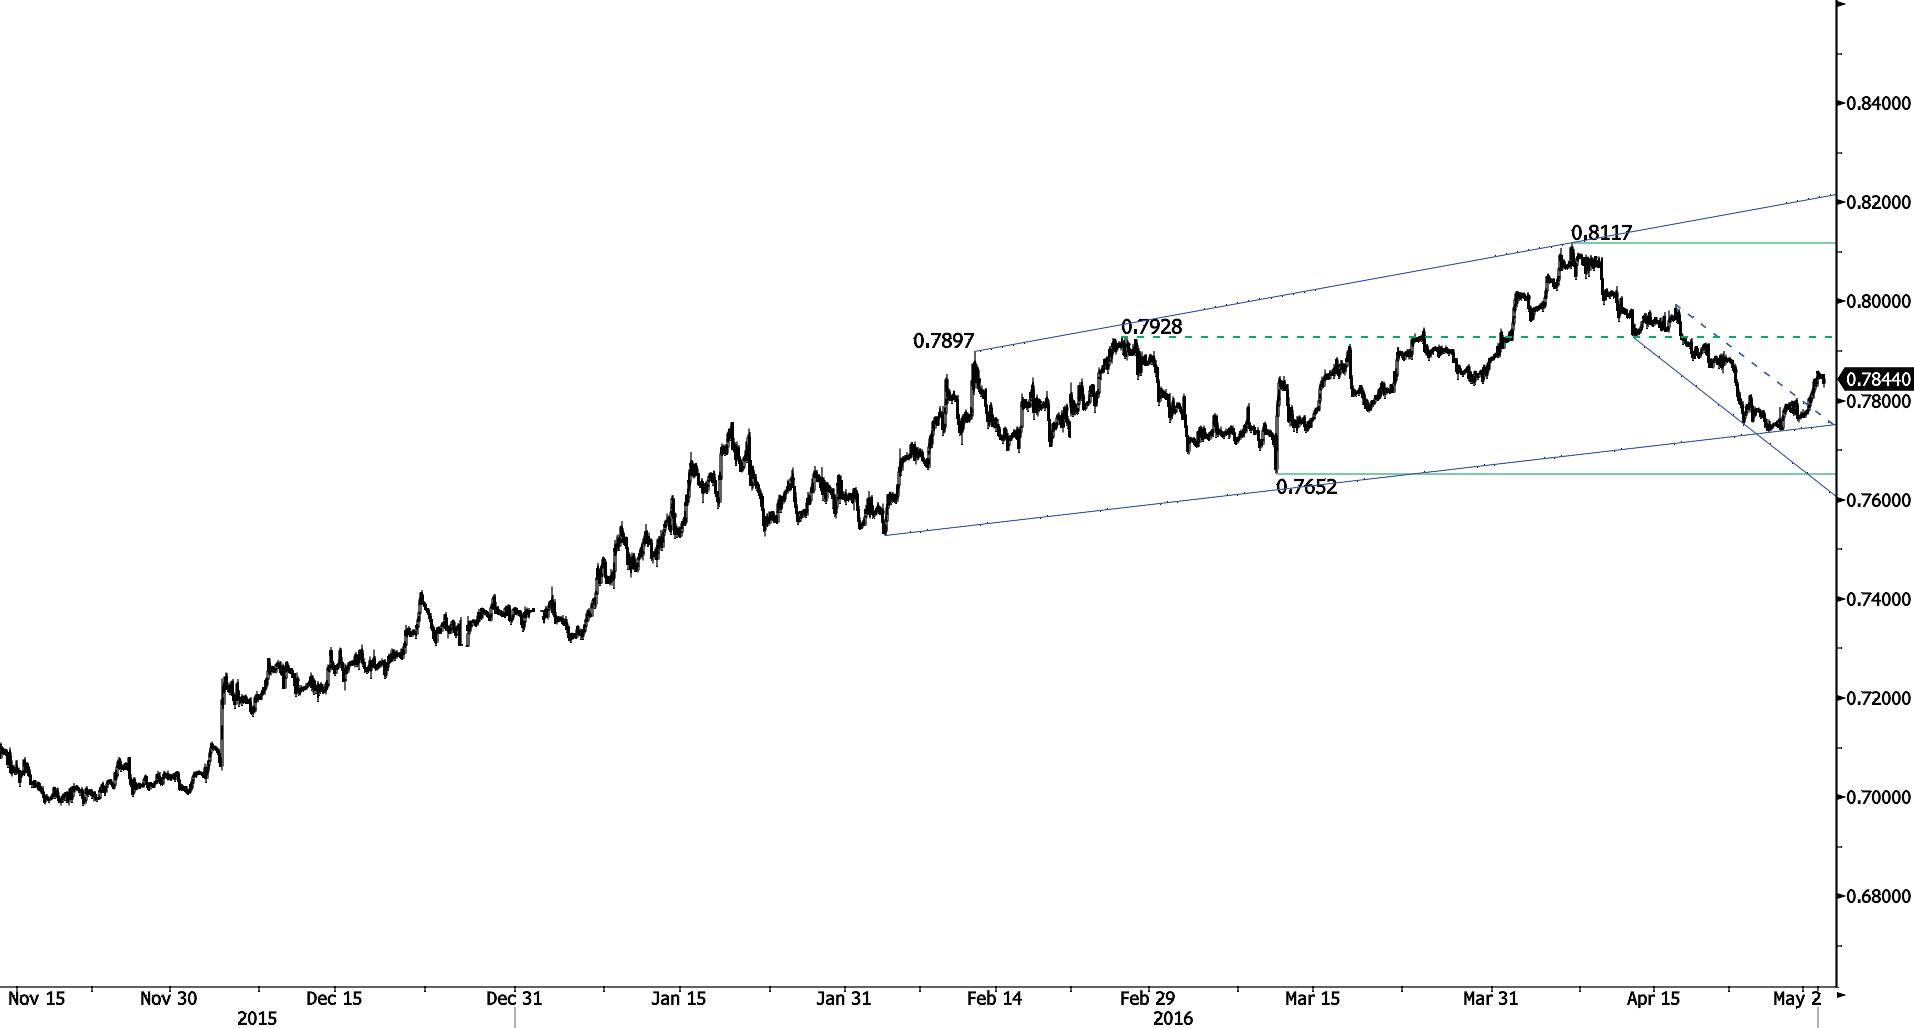
AUD/USD is monitoring again support implied by the lower bound of the uptrend channel. Strong resistance area can be found at 0.7835 (24/04/2016 high). Hourly support is given at 0.7549 (rising trendline) then 0.7415 (16/03/2016 low). Medium-term buying pressures remains important as long as the pair remains above support implied by the uptrend channel and 0.7415. Expected to show further increase.
-
In the long-term, we are waiting for further signs that the current downtrend is ending. Key supports stand at 0.6009 (31/10/2008 low) . A break of the key resistance at 0.8295 (15/01/2015 high) is needed to invalidate our long-term bearish view. In addition, we still note that the pair is now above the 200-dma which confirms our view that buying pressures are increasing.
EUR/CHF
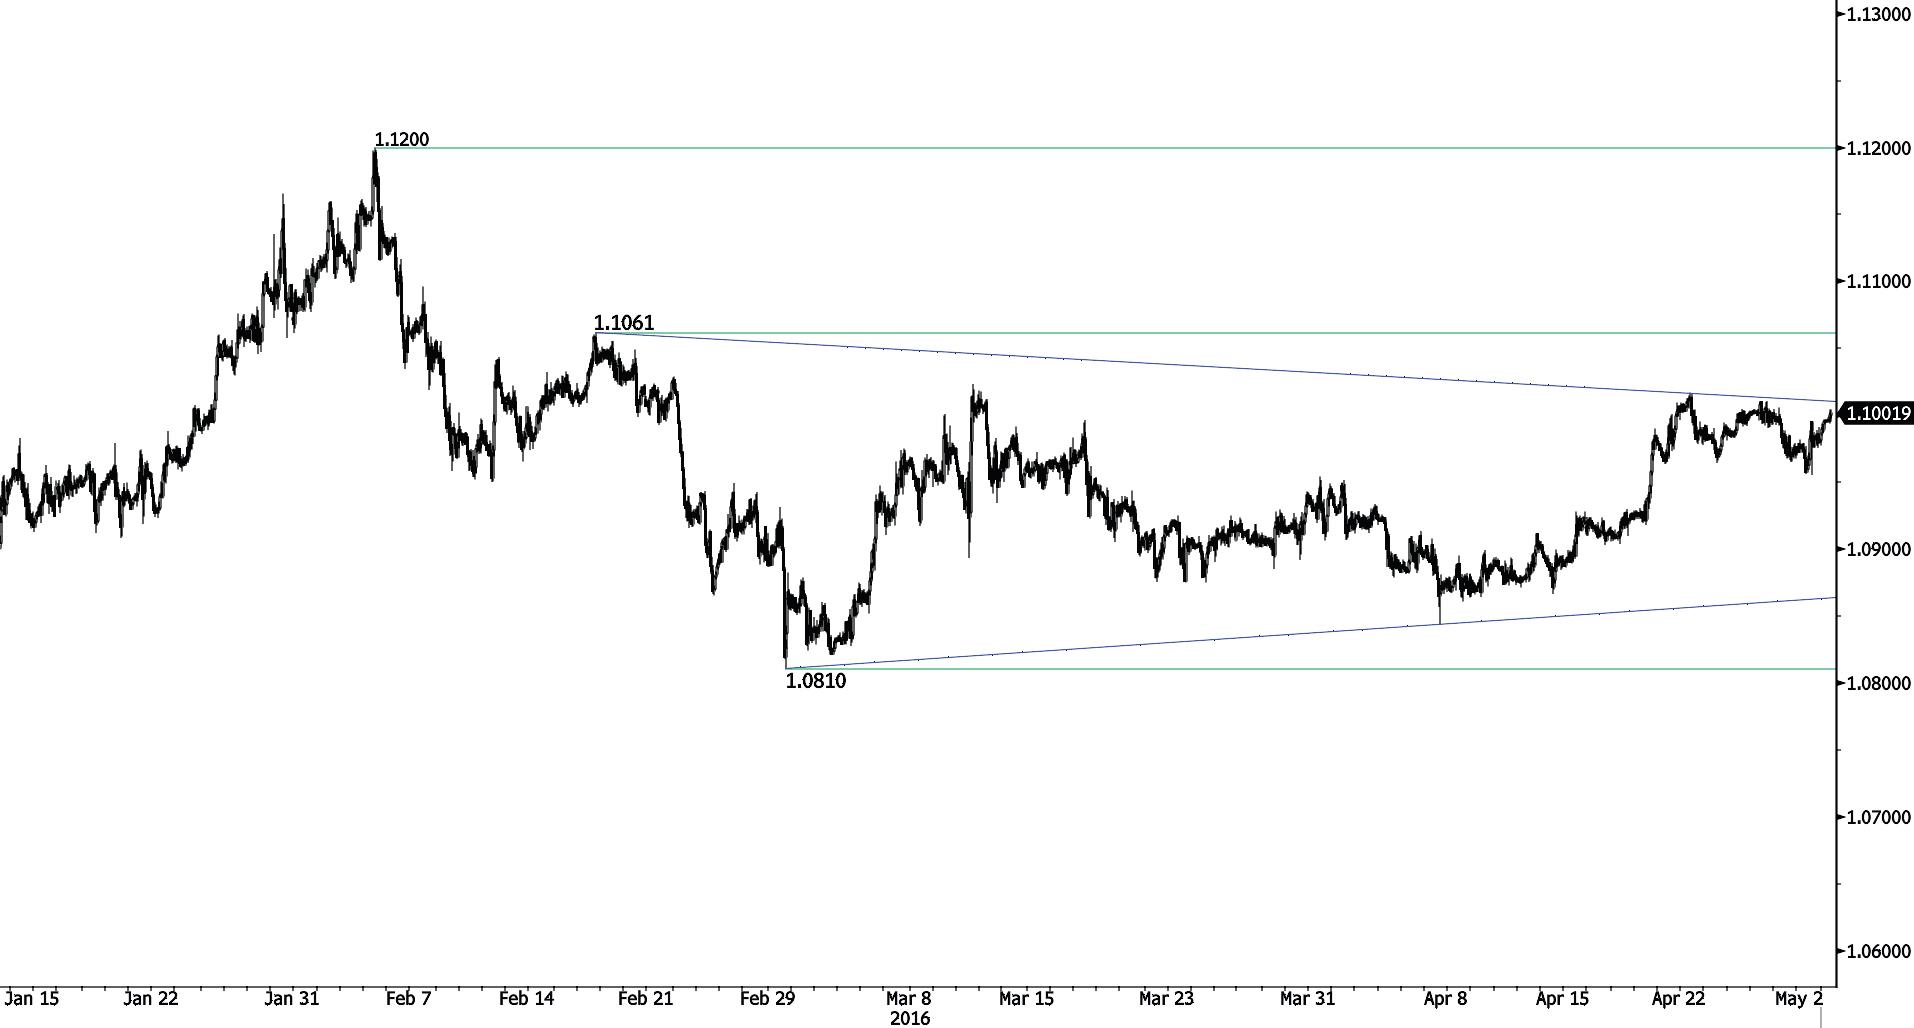
Suffering to stay above 1.1000.
-
EUR/CHF is trading around 1.1000 which is a strong resistance area. Selling pressures seem important at this level. Hourly support can be found at 1.0863 (23/03/2016 low) while hourly resistance is given at 1.1061 (17/02/2016 high). Expected to show continued monitoring of strong resistance area at 1.1000.
-
In the longer term, the technical structure remains positive. Resistance can be found at 1.1200 (04/02/2015 high). Yet,the ECB's QE programme is likely to cause persistent selling pressures on the euro, which should weigh on EUR/CHF. Supports can be found at 1.0184 (28/01/2015 low) and 1.0082 (27/01/2015 low).
EUR/JPY
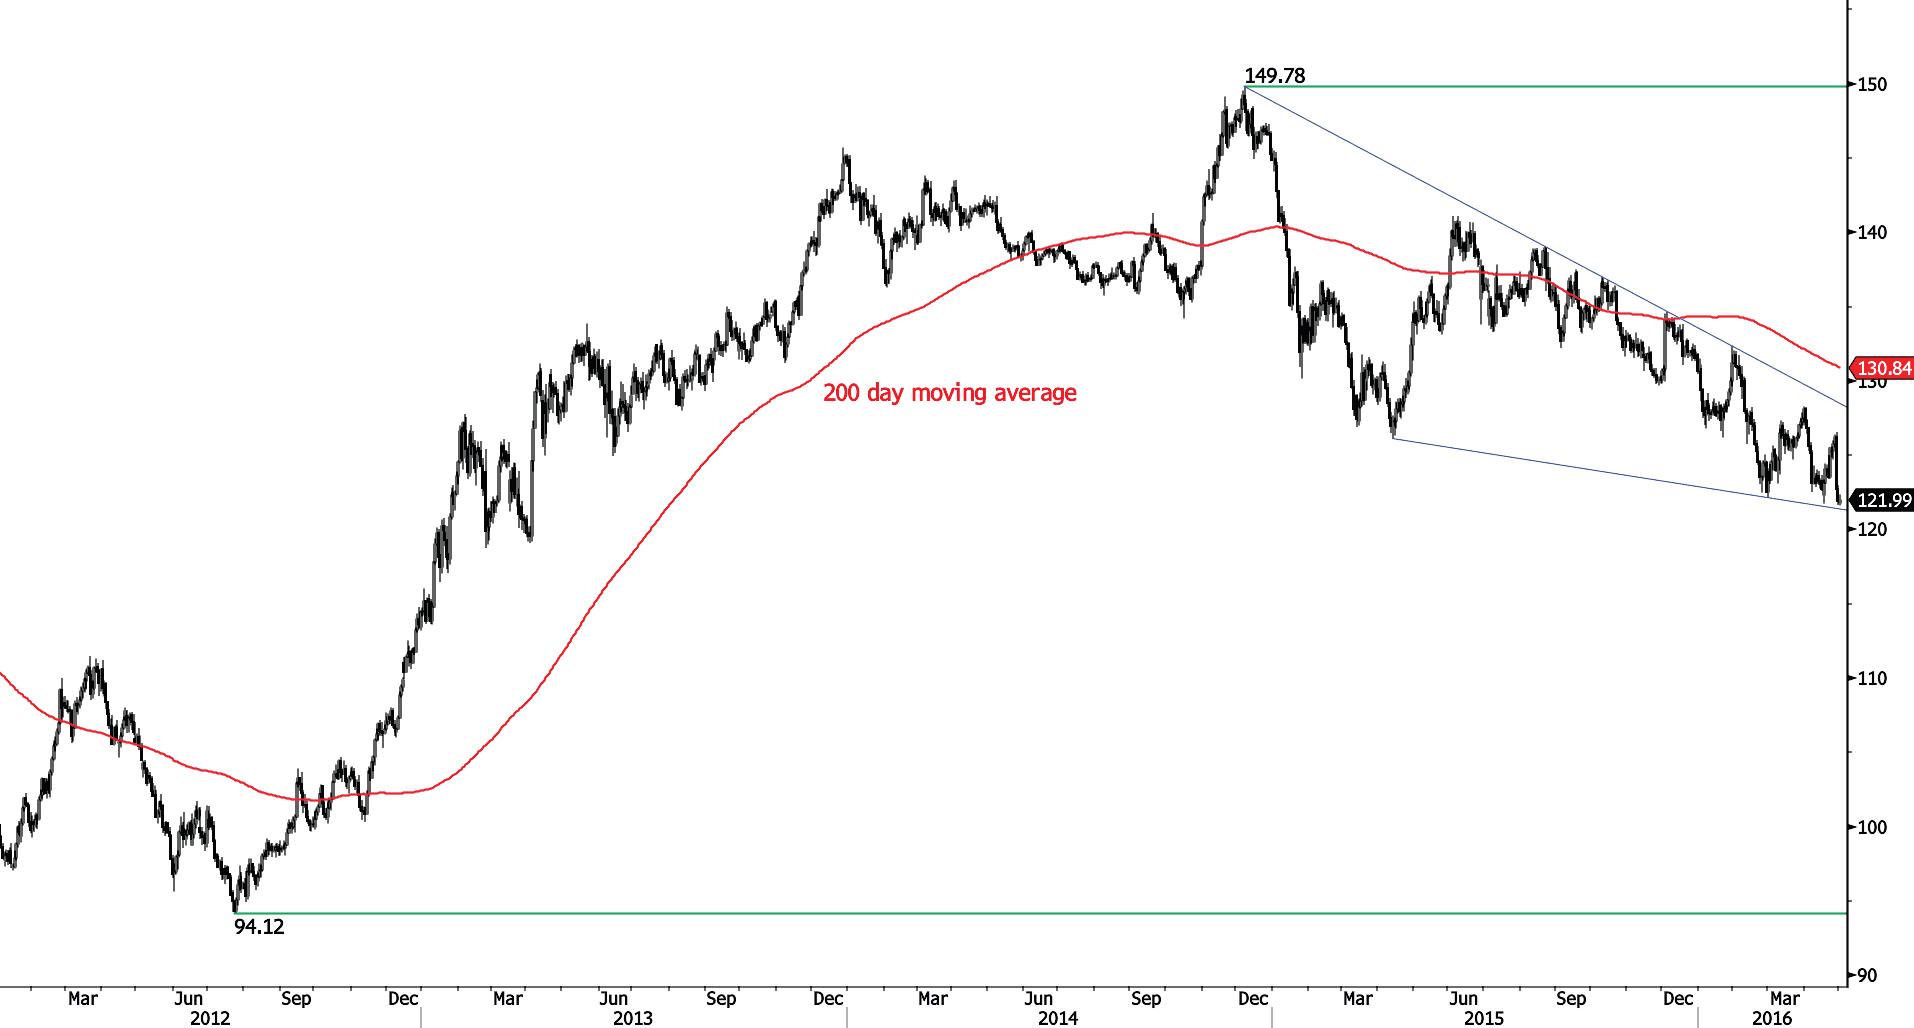
Bearish momentum continues.
-
EUR/JPY is heading further lower after last week's BoJ rate decision. Hourly support can be found at 121.60 (29/04/2016 low). Expected to show continued weakness in the short-term.
-
In the longer term, the technical structure validates a medium-term succession of lower highs and lower lows. As a result, the resistance at 149.78 (08/12/2014 high) has likely marked the end of the rise that started in July 2012. Strong support is given at 118.73 (25/02/2013 low). A key resistance can be found at 141.06 (04/06/2015 high).
EUR/GBP
Drifting higher.
-
EUR/GBP has exited short-term bearish momentum. As expected, medium-term upside momentum has prevailed. Hourly resistance can be found at 0.7860 (intraday high). Hourly support can be found at 0.7736 (26/04/2016 low). Expected to go again towards resistance area at 0.8000 within the next few weeks.
-
In the long-term, the pair is currently recovering from recent lows in 2015. The technical structure suggests a growing upside momentum. The pair is trading well above its 200 DMA. Strong resistance can be found at 0.8815 (25/02/2013 high).
GOLD (in USD)
Approaching 1300.
-
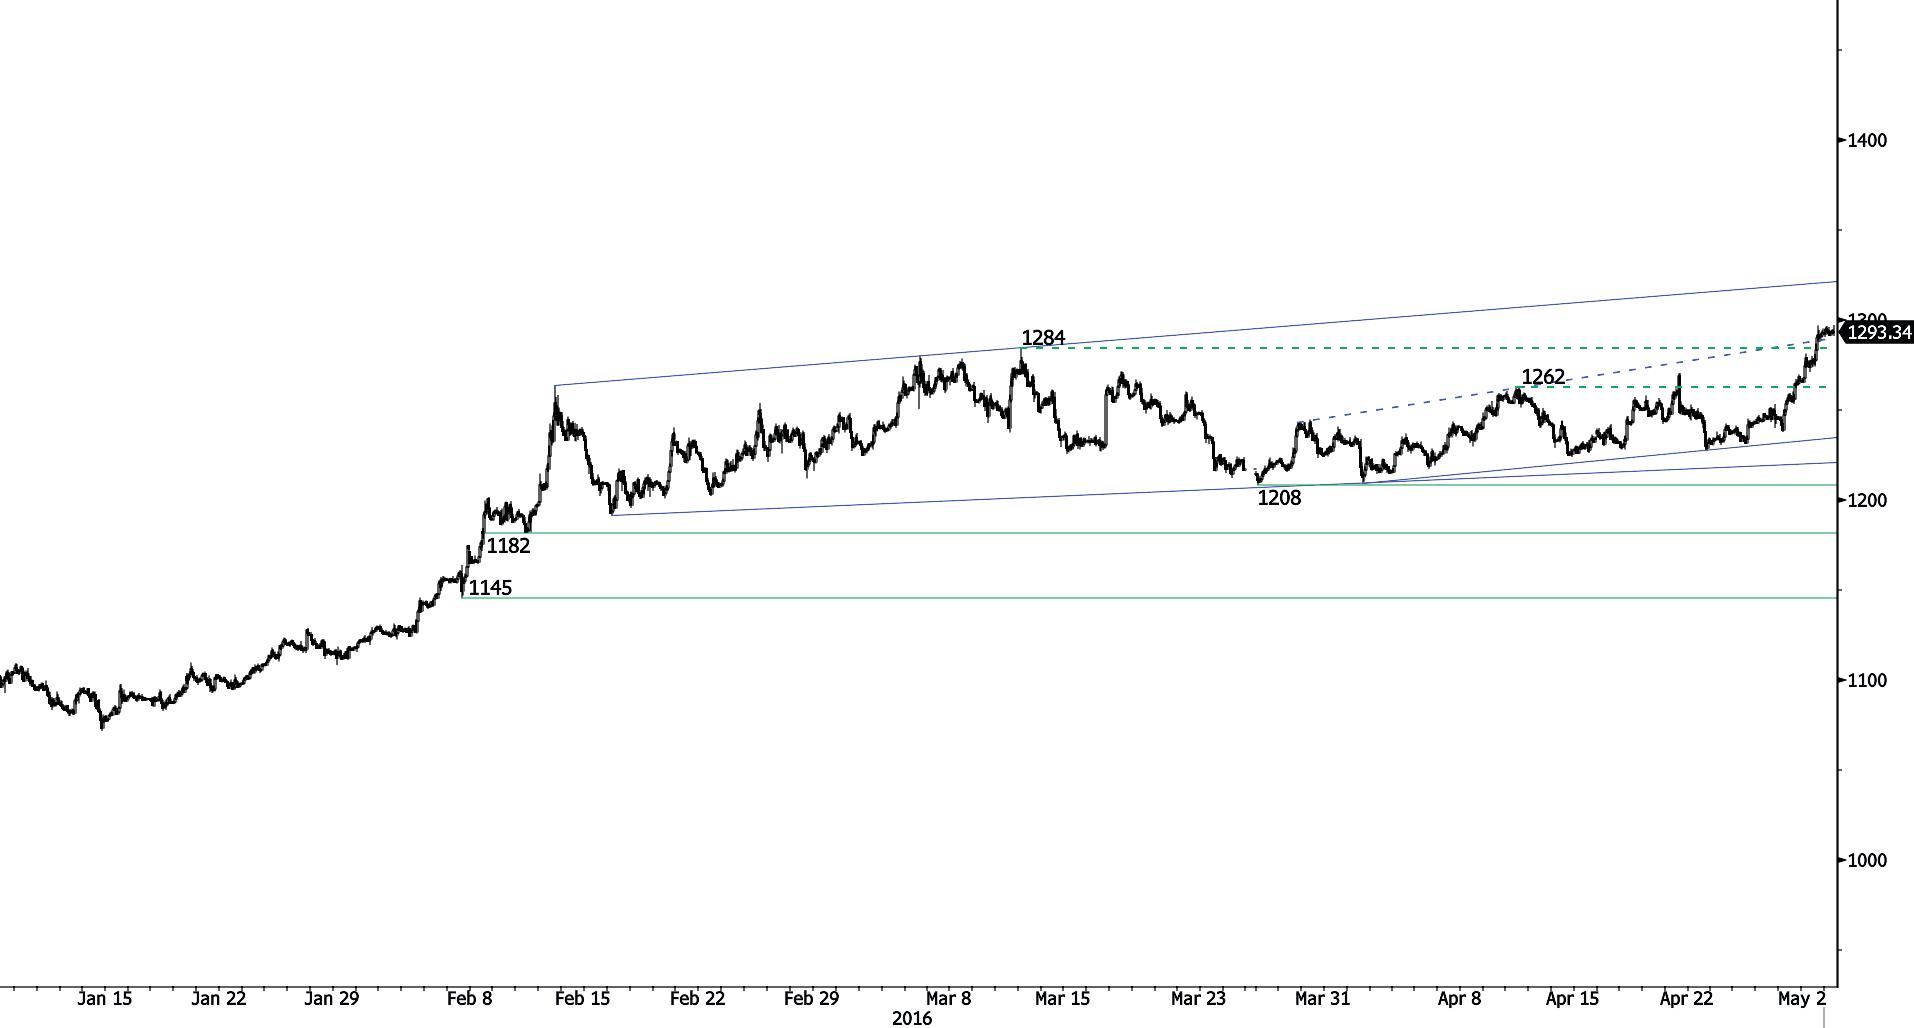
Gold is lying in a short-term uptrend channel. The metal keeps on increasing. Support is given at 1208 (28/03/2016). Resistance at 1284 (11/03/2016 high) has been broken. Expected to reach 1300.
-
In the long-term, the technical structure suggests that there is a growing upside momentum. A break of 1392 (17/03/2014) is necessary ton confirm it, A major support can be found at 1045 (05/02/2010 low).
SILVER (in USD)
Failed to go to 18.00.
-
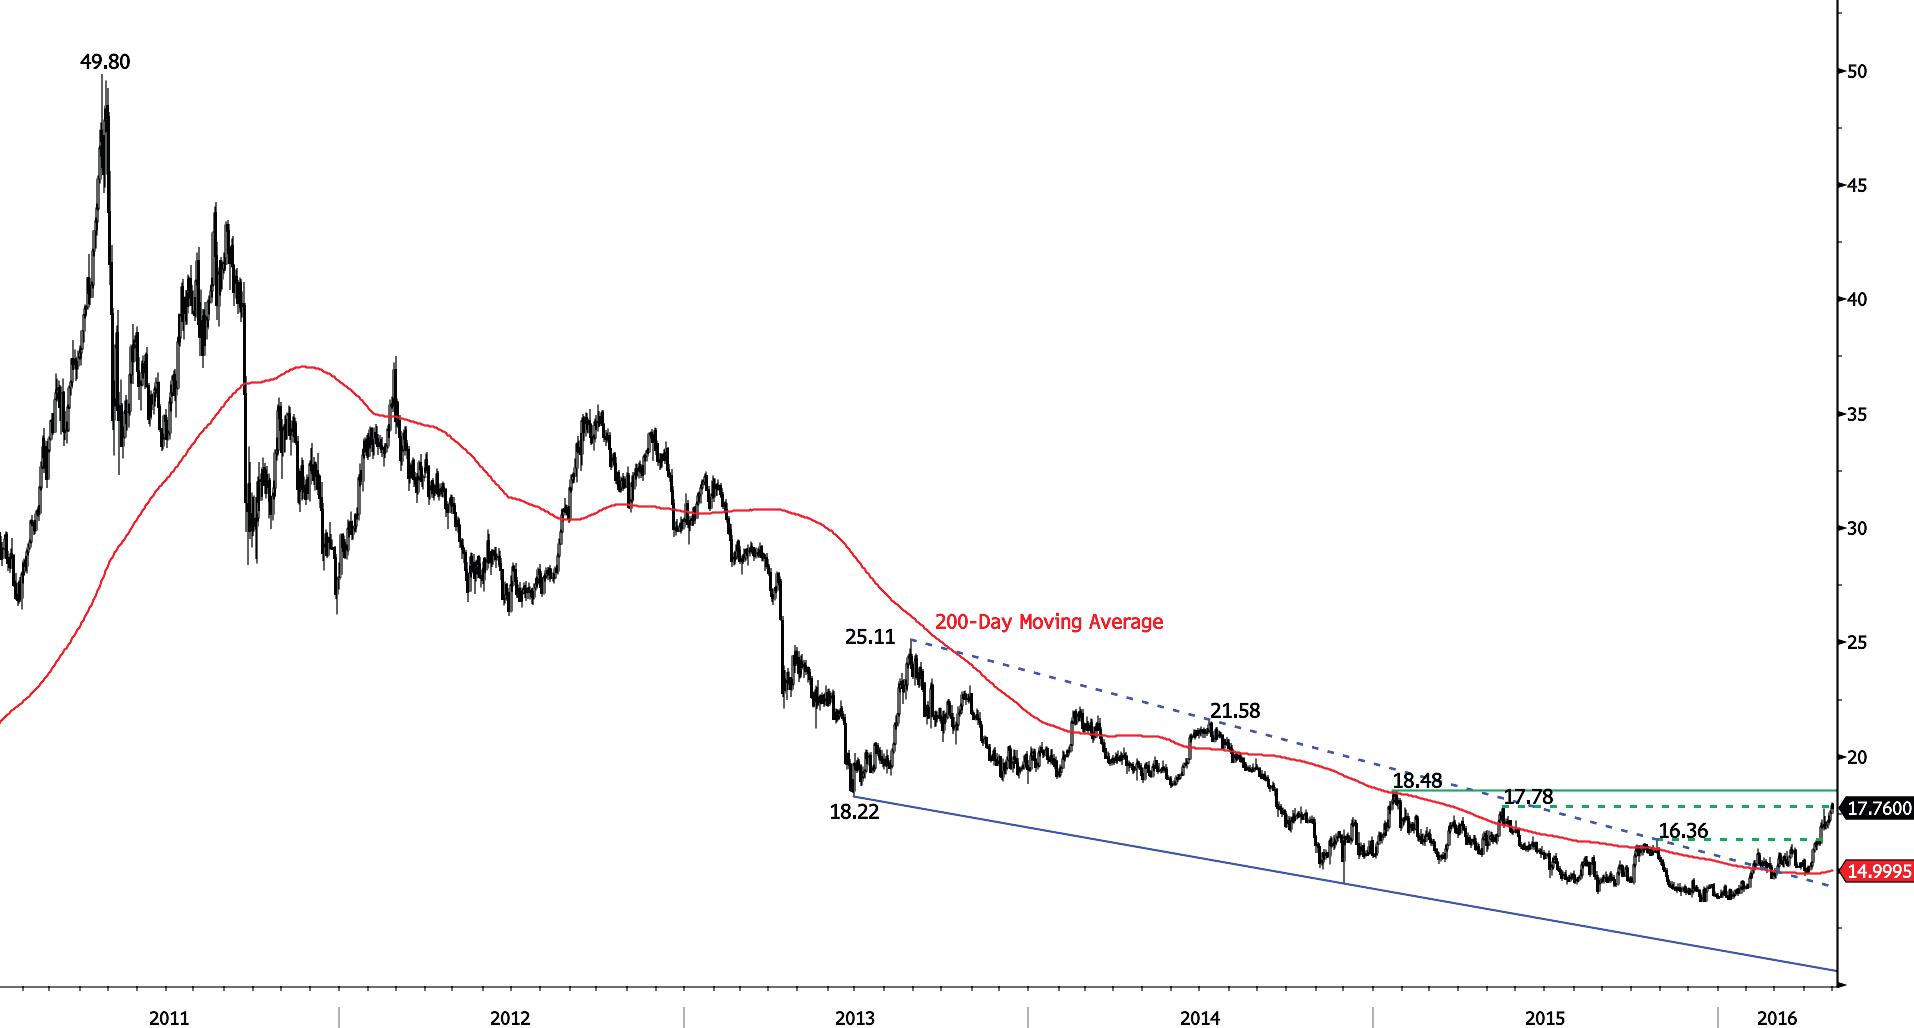
Silver's momentum is clearly positive. Daily resistance at 17.78 (18/05/2015) has been broken while hourly support can be found at 16.74 (21/04/2016 low). Expected to see further monitoring of the resistance at 18.00.
-
In the long-term, the break of the major support area between 18.64 (30/05/2014 low) and 18.22 (28/06/2013 low) confirms an underlying downtrend. Strong support can be found at 11.75 (20/04/2009). A key resistance stands at 18.89 (16/09/2014 high).
Crude Oil (in USD)
Consolidating.
-
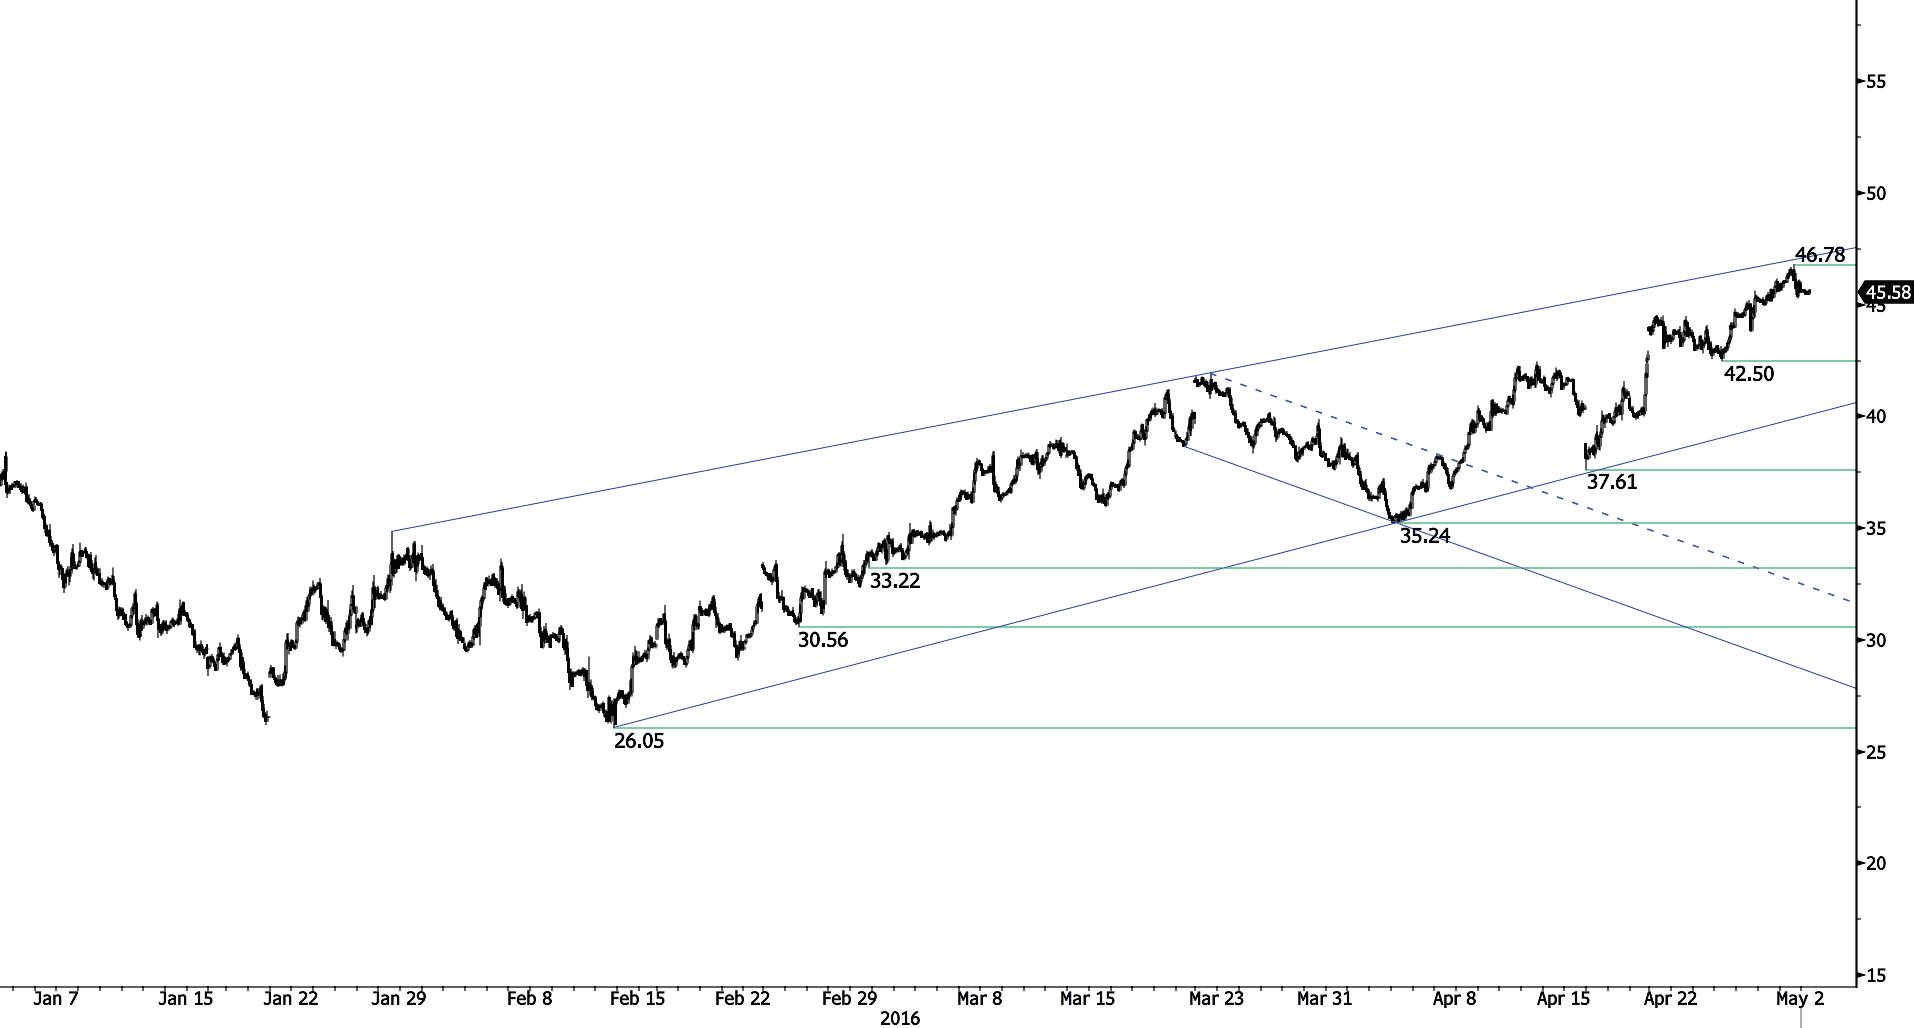
Crude is pushing higher within a medium-term uptrend channel which is clearly bullish. Hourly support can be found at 42.50 (26/04/2016 low) while strong resistance lies at 48.36 (03/11/2016 low). The technical structure suggests a further short-term retracement of the commodity.
-
In the long-term, crude oil is on a sharp decline but is now showing some signs of recovery. Strong support lies at 24.82 (13/11/2002). Crude oil is holding above its 200-Day Moving Average. Crude oil should recover during this year.

This report has been prepared by Swissquote Bank Ltd and is solely been published for informational purposes and is not to be construed as a solicitation or an offer to buy or sell any currency or any other financial instrument. Views expressed in this report may be subject to change without prior notice and may differ or be contrary to opinions expressed by Swissquote Bank Ltd personnel at any given time. Swissquote Bank Ltd is under no obligation to update or keep current the information herein, the report should not be regarded by recipients as a substitute for the exercise of their own judgment.
Recommended Content
Editors’ Picks
AUD/USD remained bid above 0.6500

AUD/USD extended further its bullish performance, advancing for the fourth session in a row on Thursday, although a sustainable breakout of the key 200-day SMA at 0.6526 still remain elusive.
EUR/USD faces a minor resistance near at 1.0750

EUR/USD quickly left behind Wednesday’s small downtick and resumed its uptrend north of 1.0700 the figure, always on the back of the persistent sell-off in the US Dollar ahead of key PCE data on Friday.
Gold holds around $2,330 after dismal US data

Gold fell below $2,320 in the early American session as US yields shot higher after the data showed a significant increase in the US GDP price deflator in Q1. With safe-haven flows dominating the markets, however, XAU/USD reversed its direction and rose above $2,340.
Bitcoin price continues to get rejected from $65K resistance as SEC delays decision on spot BTC ETF options

Bitcoin (BTC) price has markets in disarray, provoking a broader market crash as it slumped to the $62,000 range on Thursday. Meanwhile, reverberations from spot BTC exchange-traded funds (ETFs) continue to influence the market.
US economy: slower growth with stronger inflation

The dollar strengthened, and stocks fell after statistical data from the US. The focus was on the preliminary estimate of GDP for the first quarter. Annualised quarterly growth came in at just 1.6%, down from the 2.5% and 3.4% previously forecast.