EUR/USD
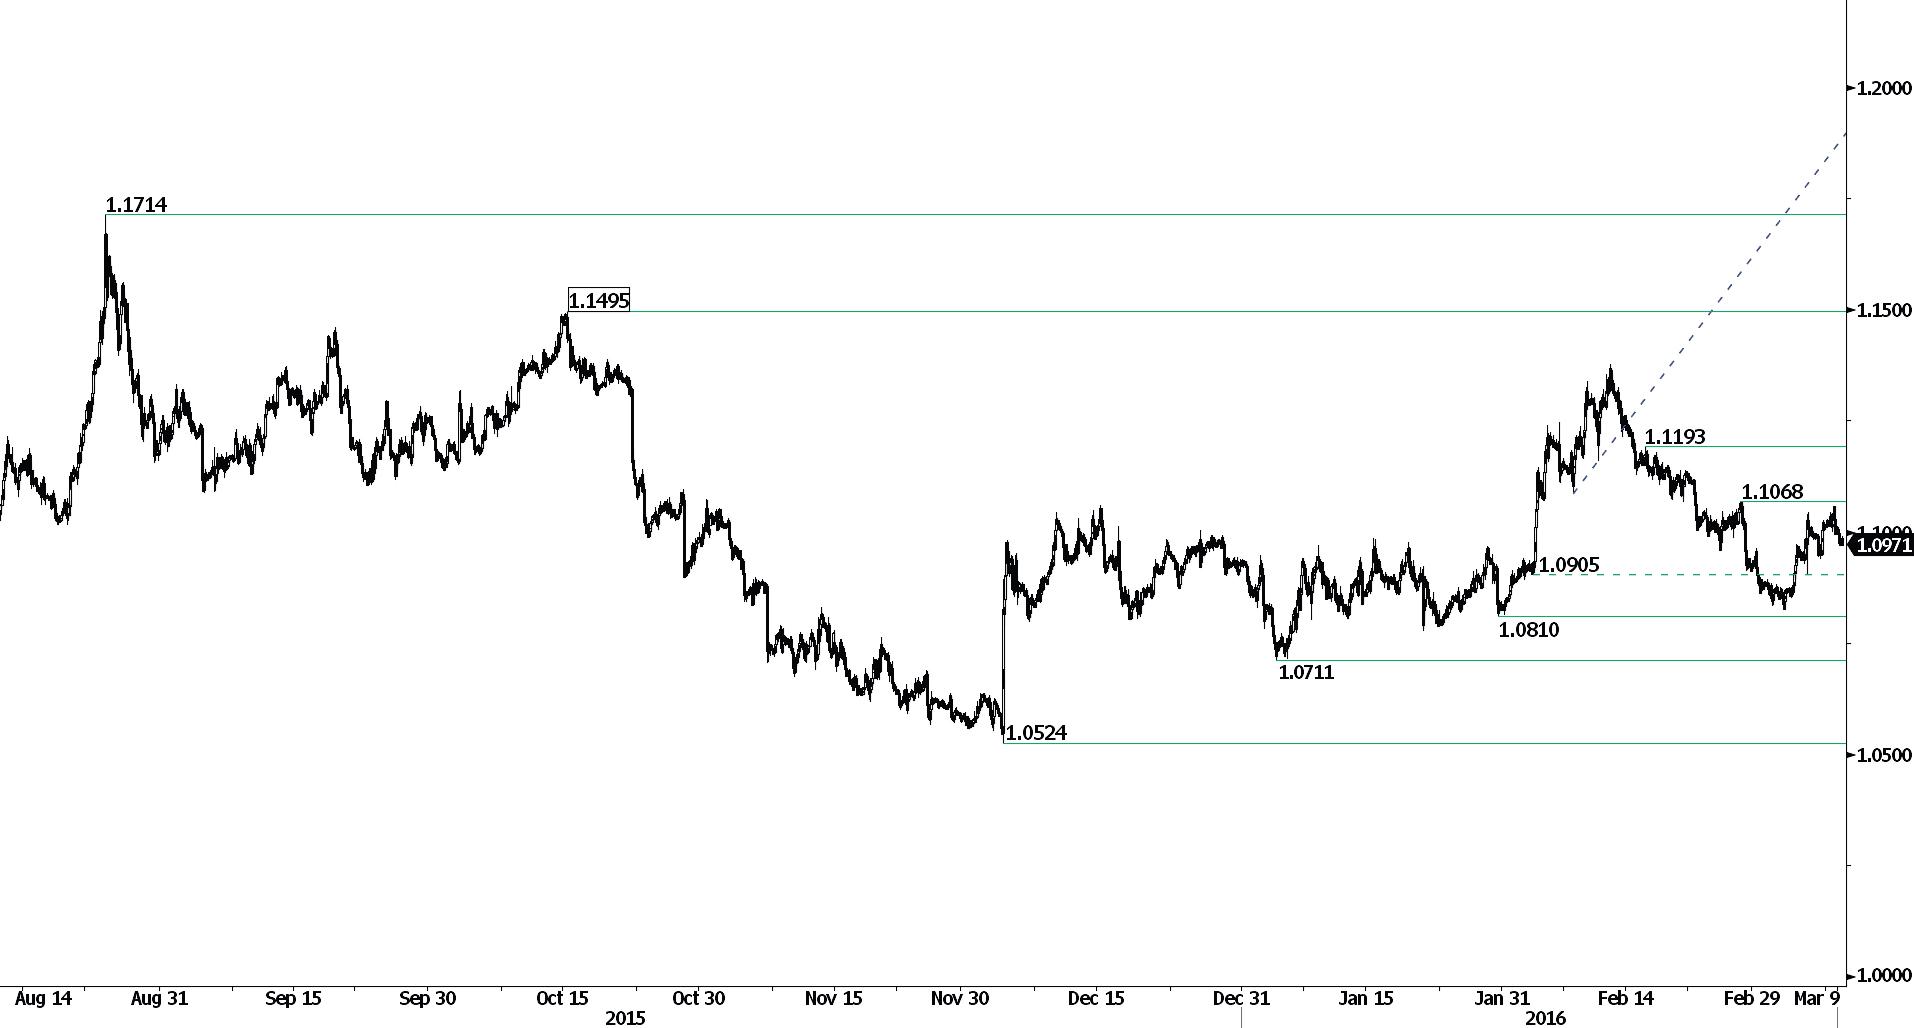
Failed to break resistance at 1.1068.
EUR/USD is bouncing back. Yet, the short-term technical structure still suggests a further bearish move. Hourly resistance lies at 1.1068 (26/02/2016 high). Hourly support can be located a 1.0940 (07/03/2016 low) then 1.0810 (29/01/2016 low). Expected to show continued weakness.
In the longer term, the technical structure favours a bearish bias as long as resistance holds. Key resistance is located region at 1.1453 (range high) and 1.1640 (11/11/2005 low) is likely to cap any price appreciation. The current technical deteriorations favours a gradual decline towards the support at 1.0504 (21/03/2003 low).
GBP/USD
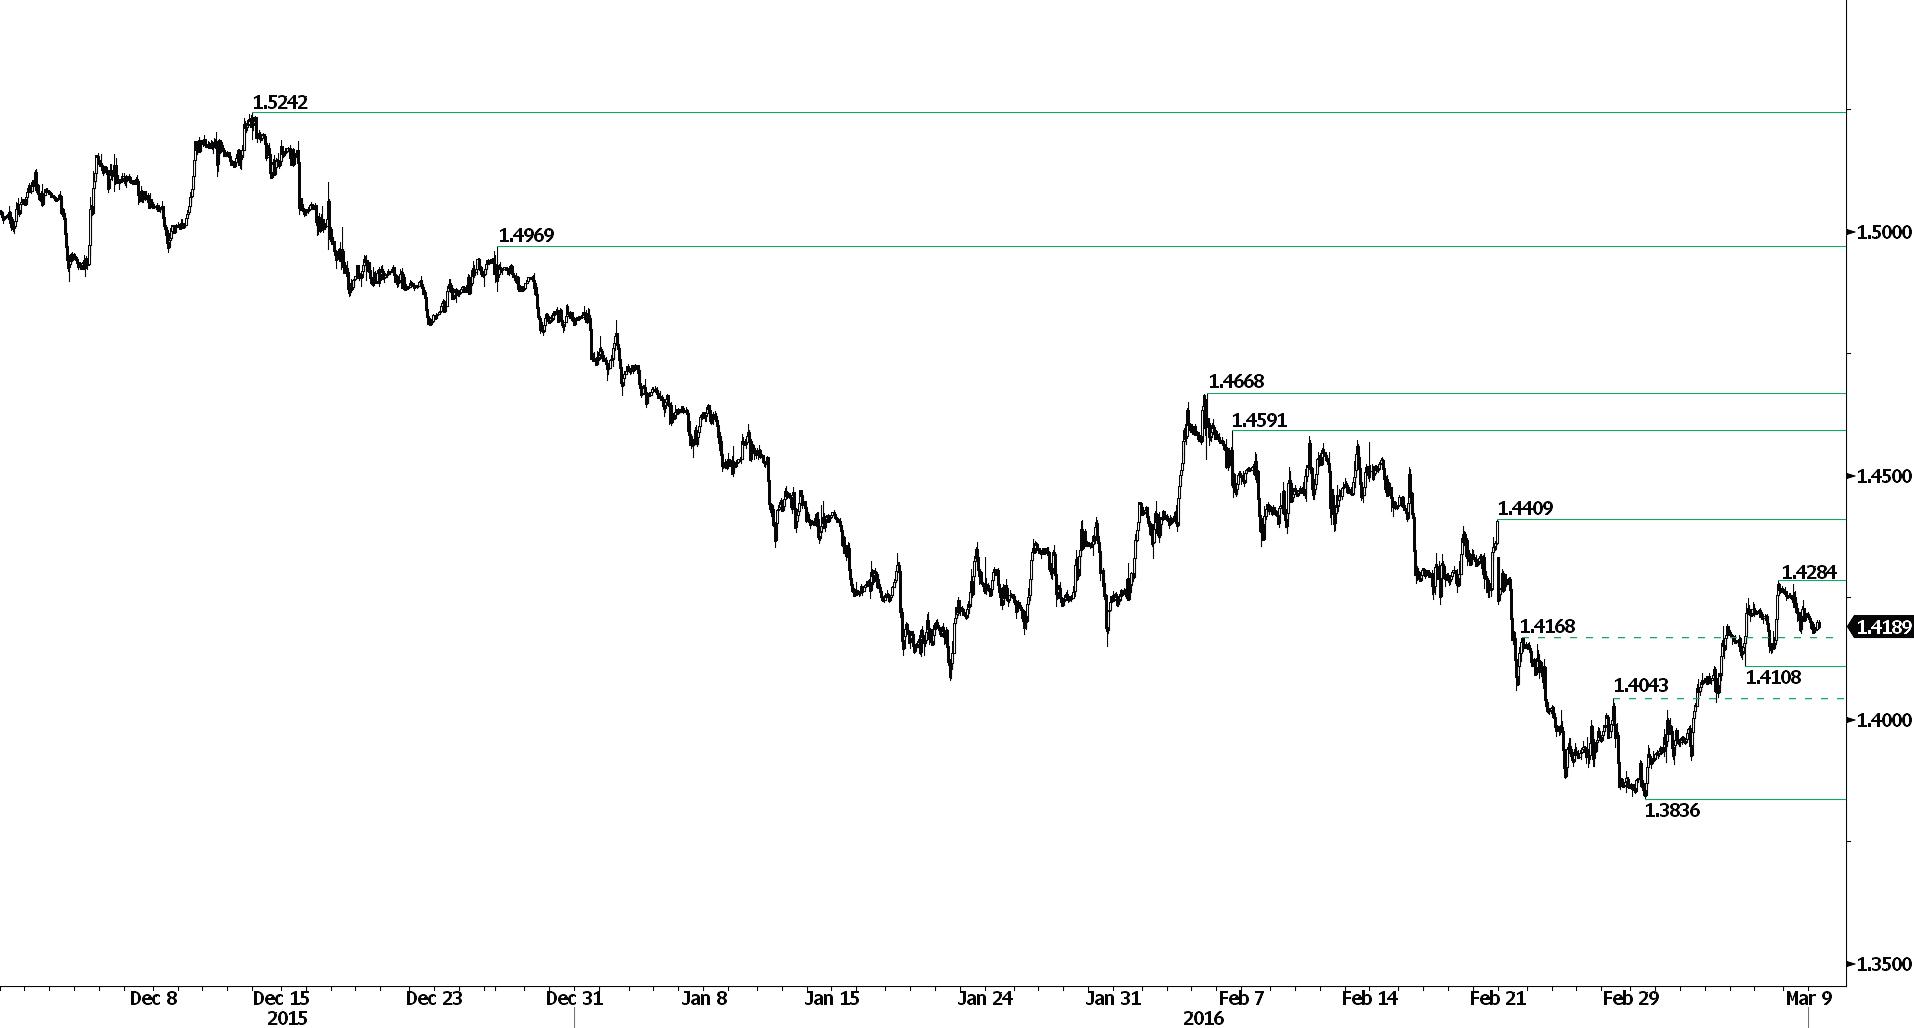
Consolidating.
GBP/USD's short-term bullish momentum continues. Major resistance is given at 1.4409 (19/02/2016 high). Hourly resistance lies at 1.4284 (07/03/2016 high) while hourly support can be found at 1.4108 (04/03/2016 low). The technical structure suggests further increase as buying pressures are still on.
The long-term technical pattern is negative and favours a further decline towards key support at 1.3503 (23/01/2009 low), as long as prices remain below the resistance at 1.5340/64 (04/11/2015 low see also the 200 day moving average). However, the general oversold conditions and the recent pick-up in buying interest pave the way for a rebound.
USD/JPY
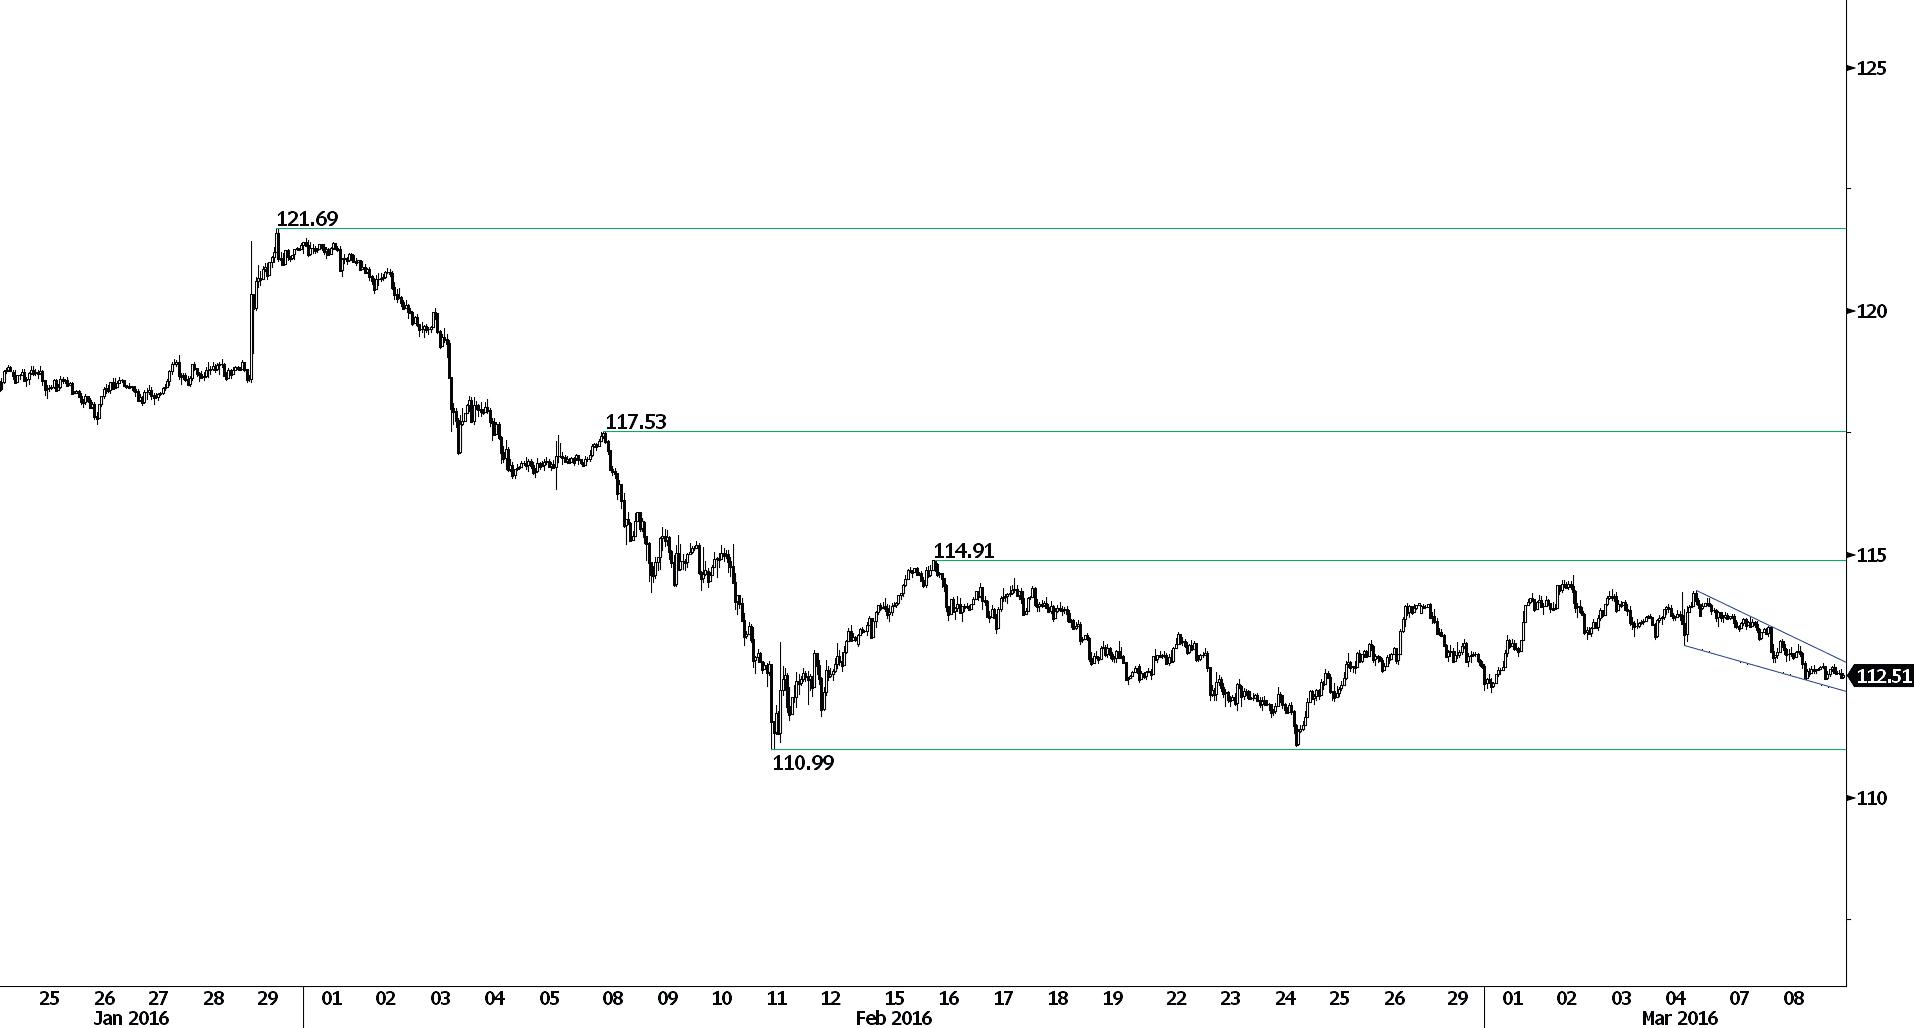
Weakening.
USD/JPY is declining but remains above 112.00. Strong resistance is given at 114.91 (16/02/2016 high). Hourly support lies at 112.41 (intraday low). Next support lies at 110.99 (11/02/2016 low). Expected to show continued weakness.
We favour a long-term bearish bias. Support at 105.23 (15/10/2014 low) is on target. A gradual rise towards the major resistance at 135.15 (01/02/2002 high) seems now less likely. Another key support can be found at 105.23 (15/10/2014 low).
USD/CHF
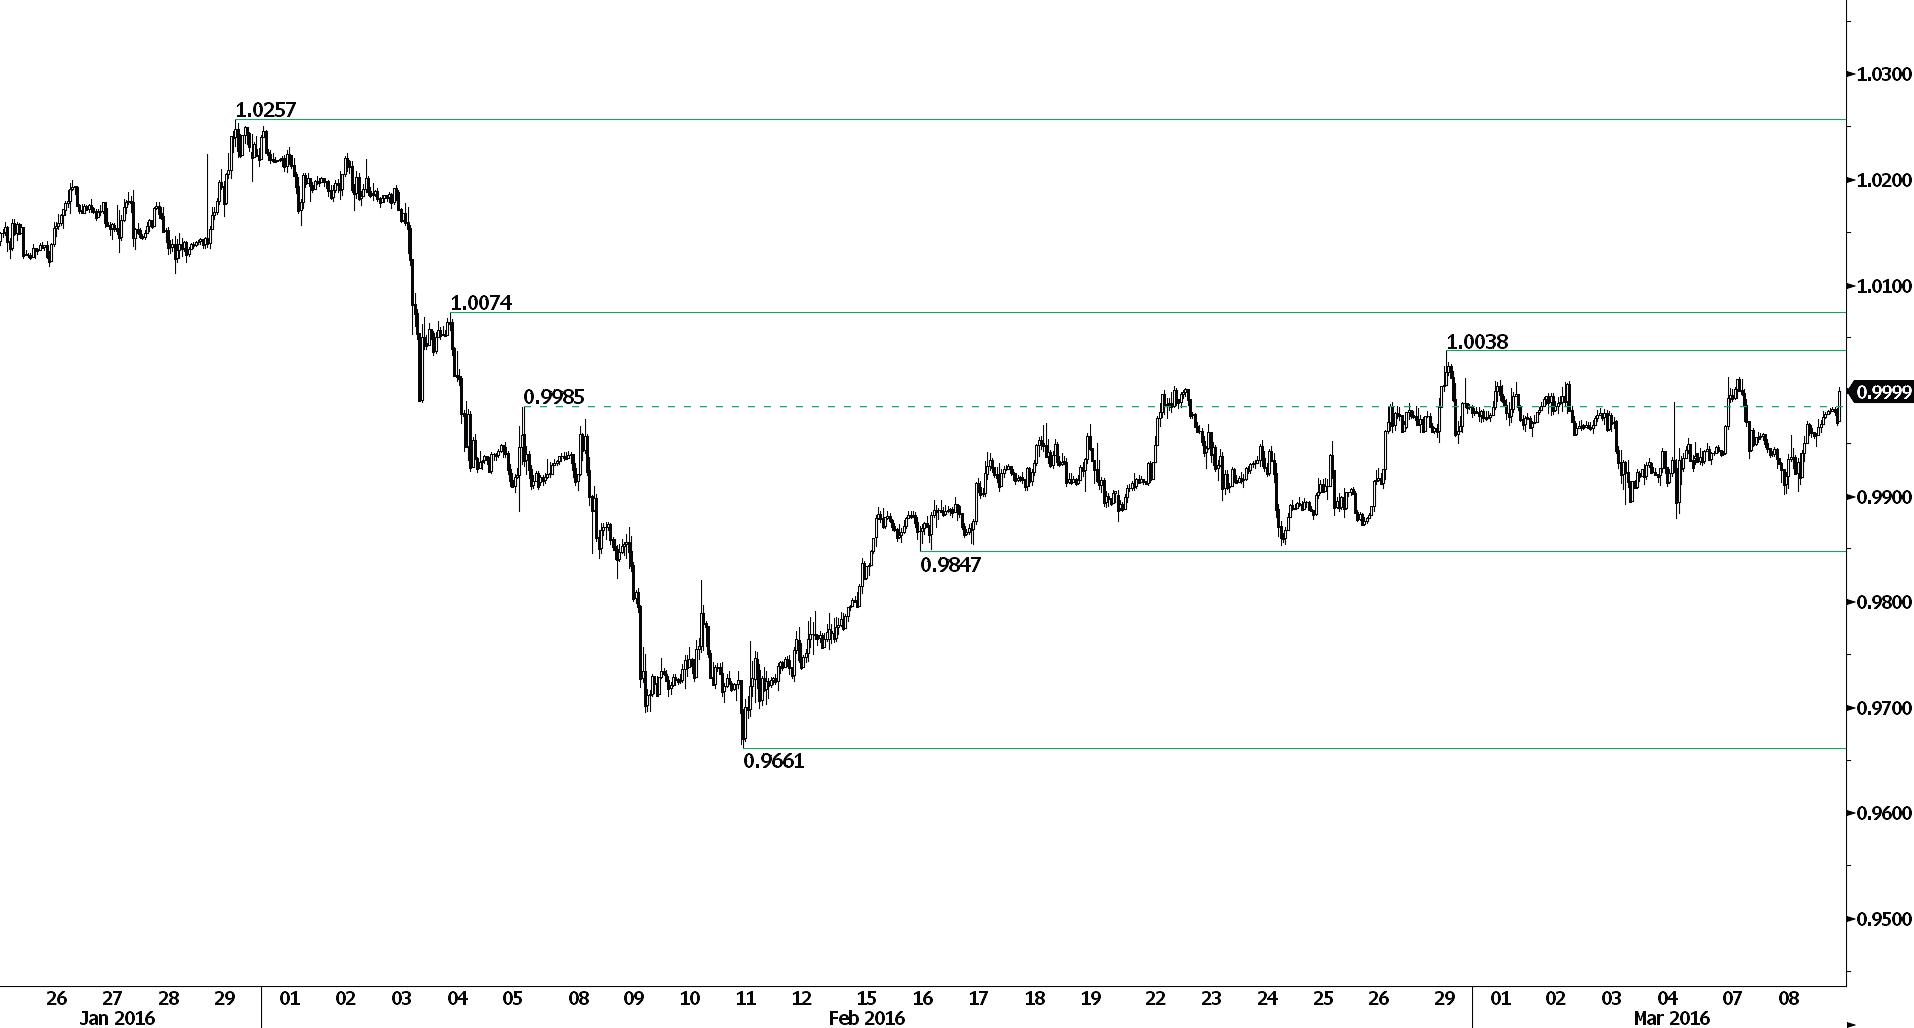
Direction-less.
USD/CHF is definitely trading mixed. An hourly support lies at 0.9879 (04/03/2016 low), while a key support stands at 0.9847 (16/02/2016 low). Hourly resistance is located at 1.0012 (07/03/2016 high). Expected to remain in range around psychological level at 1.0000.
In the long-term, the pair is setting highs since mid-2015. Key support can be found 0.8986 (30/01/2015 low). The technical structure favours a long term bullish bias.
USD/CAD
Bouncing from year-low.
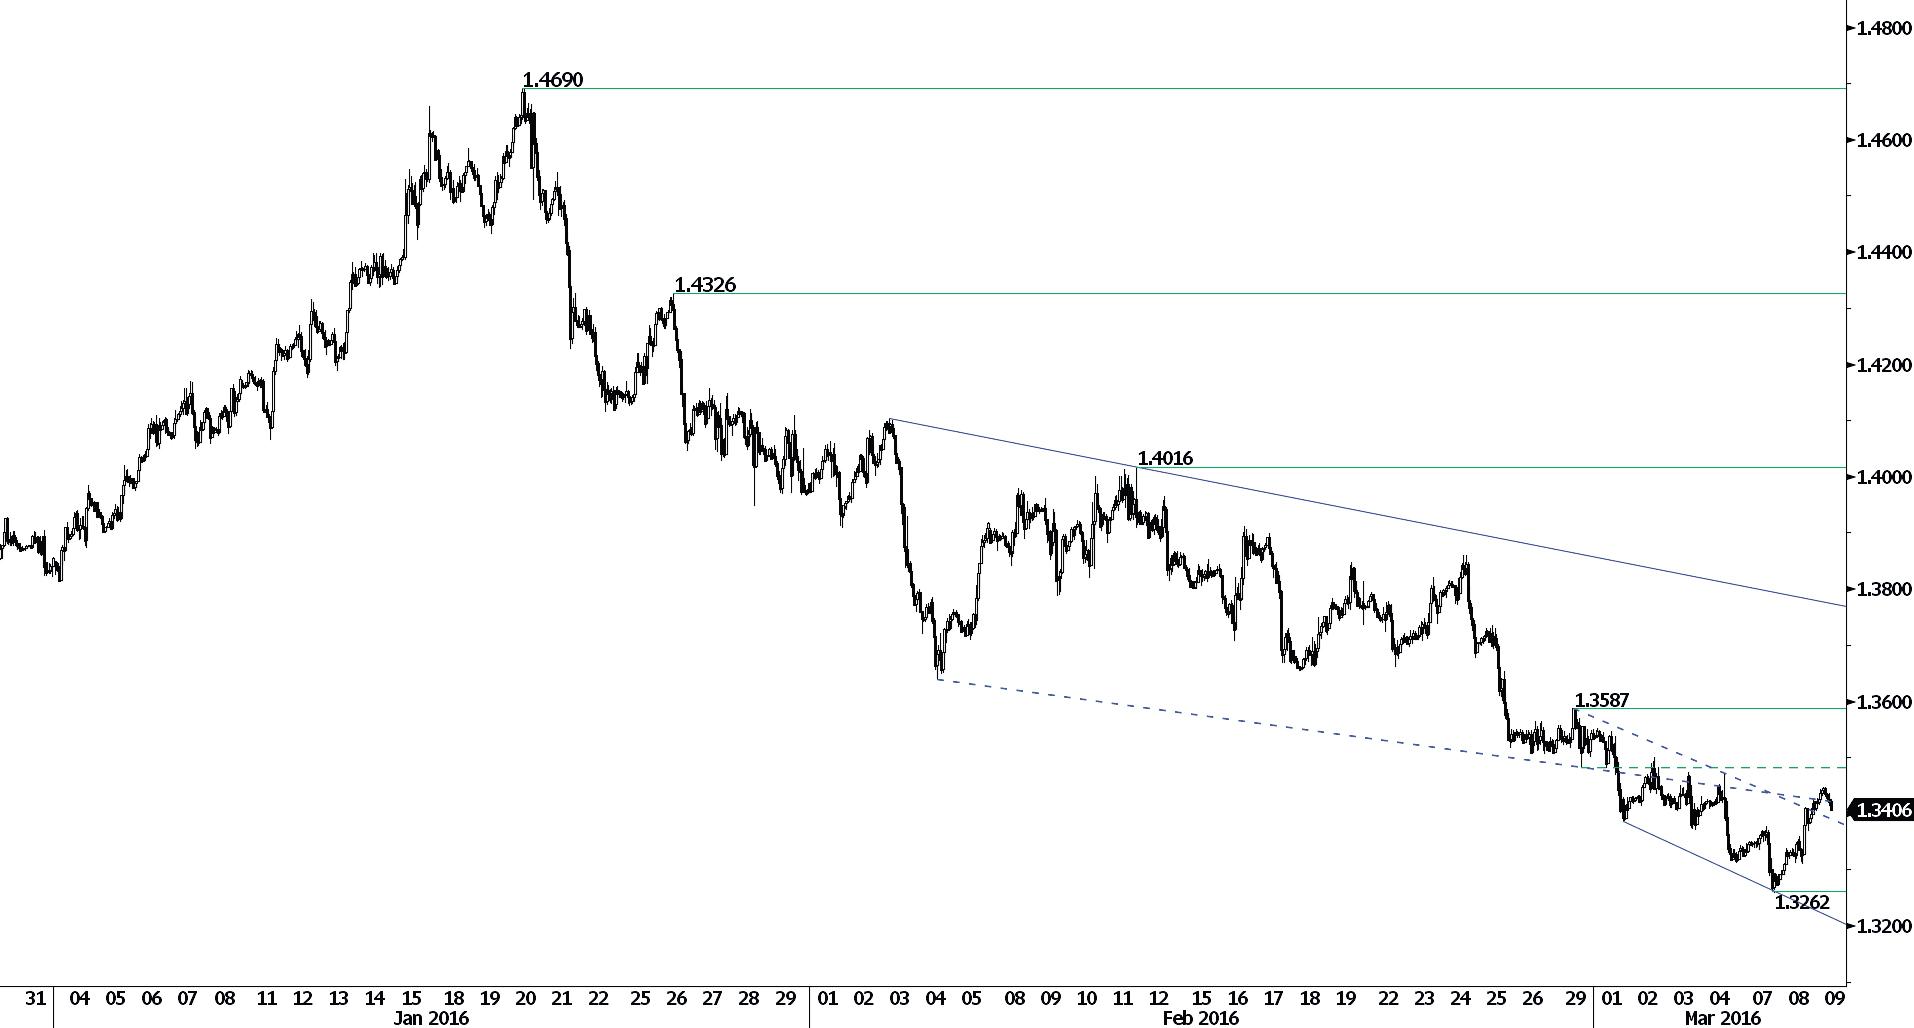
USD/CAD's momentum is bearish. Selling pressures are still important. Yet the pair is bouncing back from support at 1.3262 (year-low). Hourly resistance is given at 1.3377 (07/03/2016 high) while stronger resistance can be found at 1.3587 (29/02/2016 high). Expected to show continued weakness.
In the longer term, the break of the key resistance at 1.3065 (13/03/2009 high) has indicated increasing buying pressures, which favours further medium-term strengthening. Strong resistance is given at 1.4948 (21/03/2003 high). Support can be found at 1.2832 (15/10/2015 low) then 1.1731 (06/01/2015 low).
AUD/USD
Pausing at year-high.
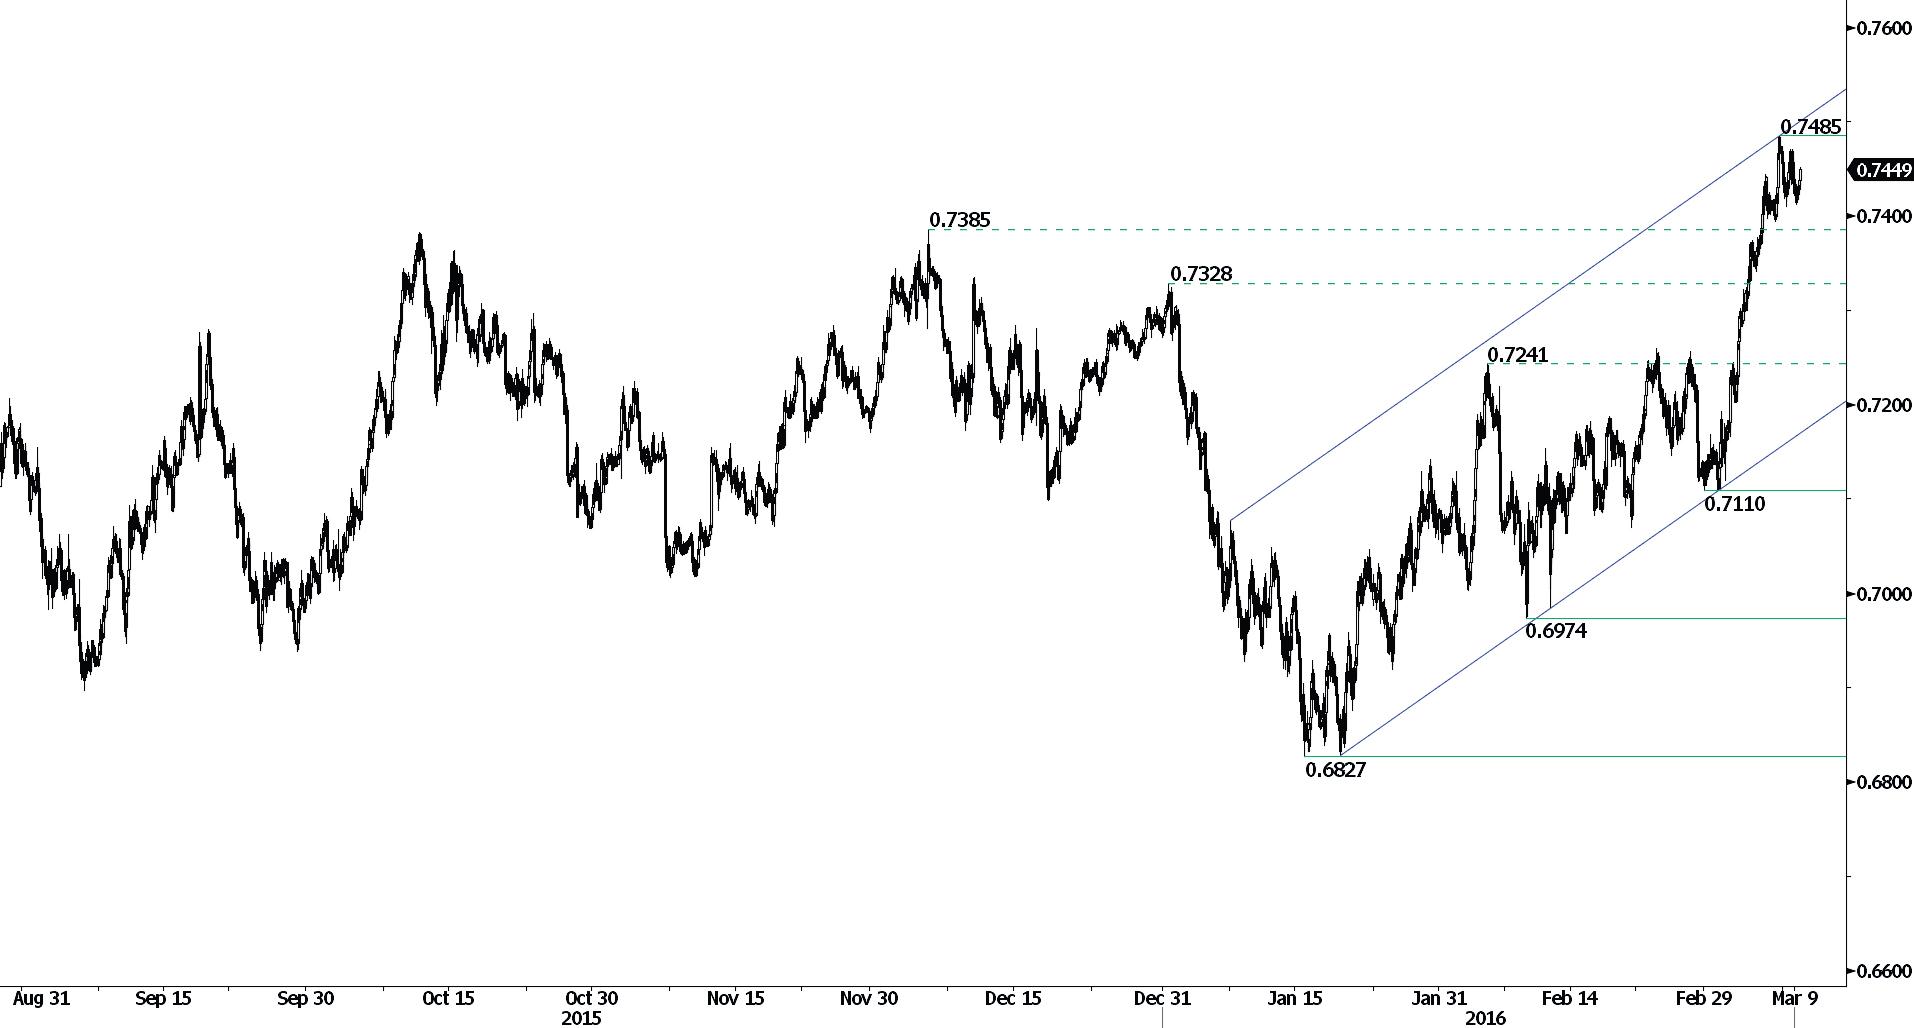
AUD/USD is still consolidating around its highest level of the year. Strong resistance is given at 0.7485 (07/03/2015 high). Hourly support is given at 0.7397 (07/03/2016 low). Expected to show further consolidation before entering into another upside move.
In the long-term, we are waiting for further signs that the current downtrend is ending. Key supports stand at 0.6009 (31/10/2008 low) . A break of the key resistance at 0.8295 (15/01/2015 high) is needed to invalidate our long-term bearish view. In addition, we still note that the pair is approaching the 200-dma which confirms fading selling pressures.
EUR/CHF
Struggling to reach 1.1000.
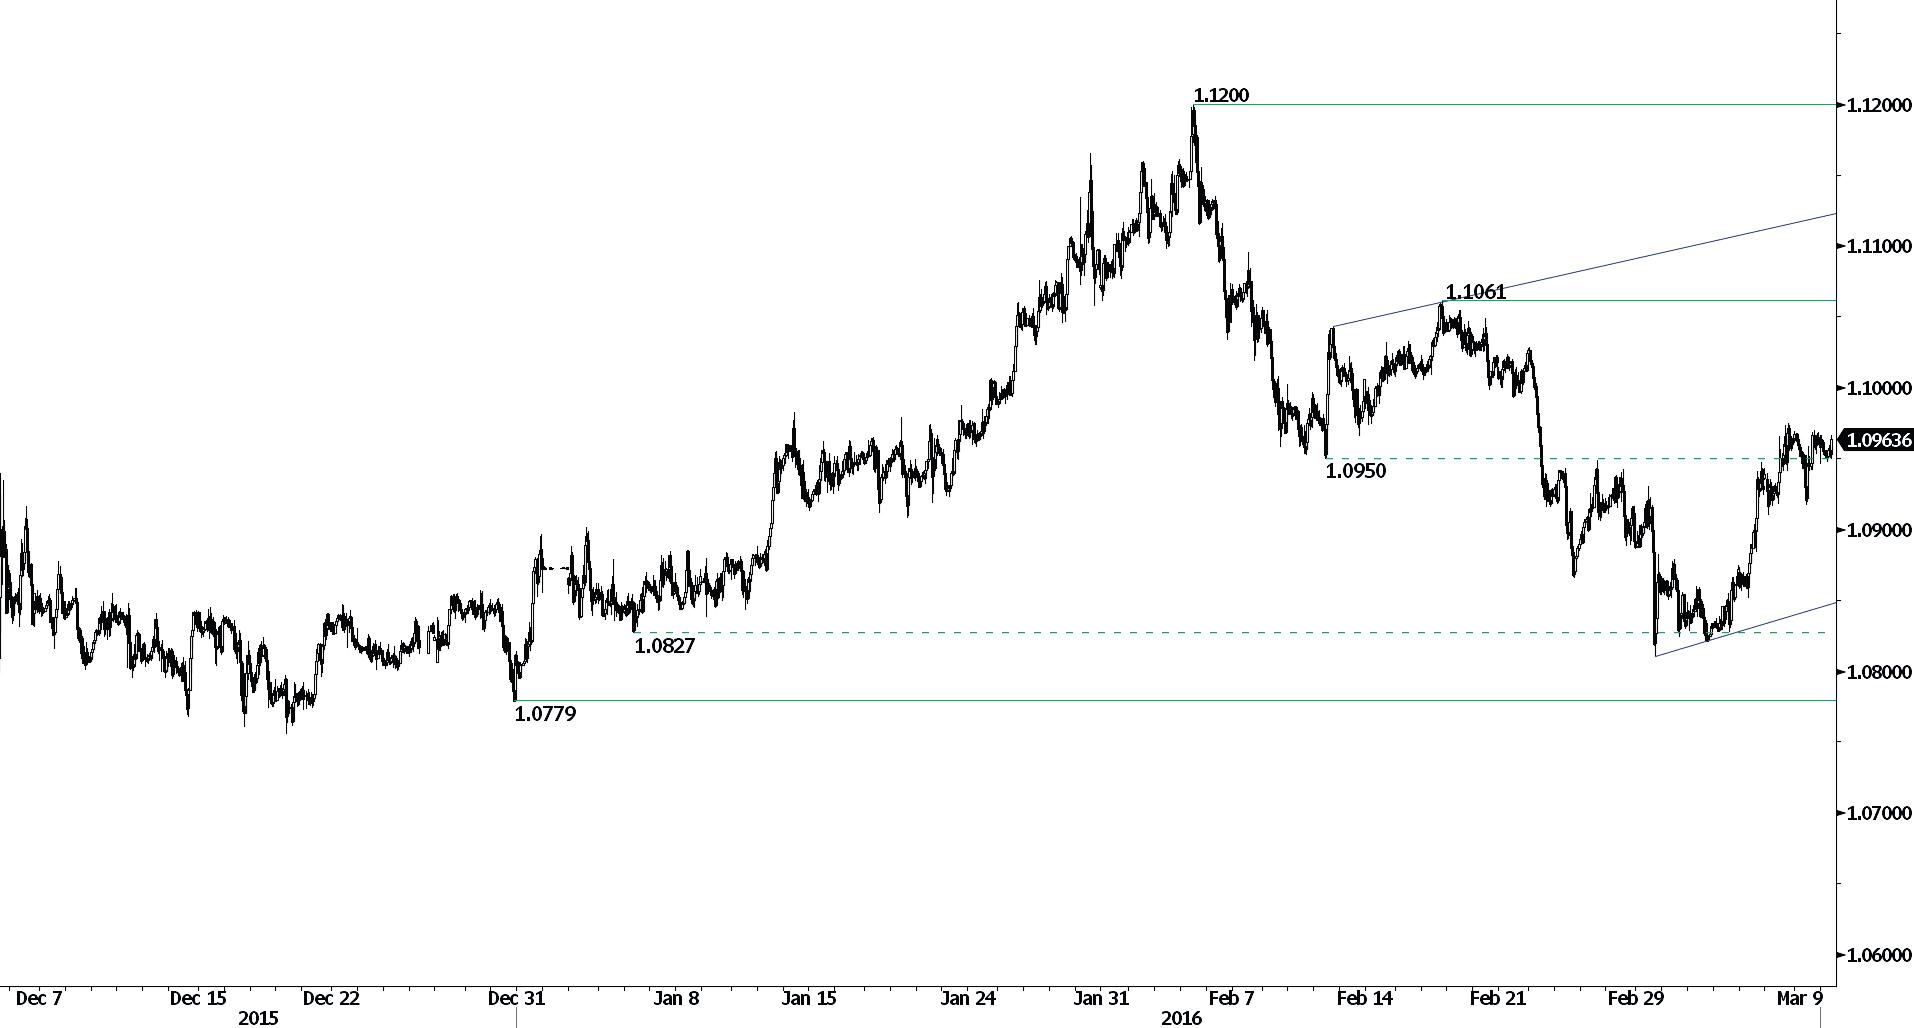
EUR/CHF is fading before reaching 1.1000. Resistance lies at 1.0974 (07/03/2016 high) while hourly support can be found at 1.0810 (29/02/2016 low). Expected to further try to test 1.1000.
In the longer term, the technical structure remains positive. Resistance can be found at 1.1200 (04/02/2015 high). Yet,the ECB's QE programme is likely to cause persistent selling pressures on the euro, which should weigh on EUR/CHF. Supports can be found at 1.0184 (28/01/2015 low) and 1.0082 (27/01/2015 low).
EUR/JPY
Declining.
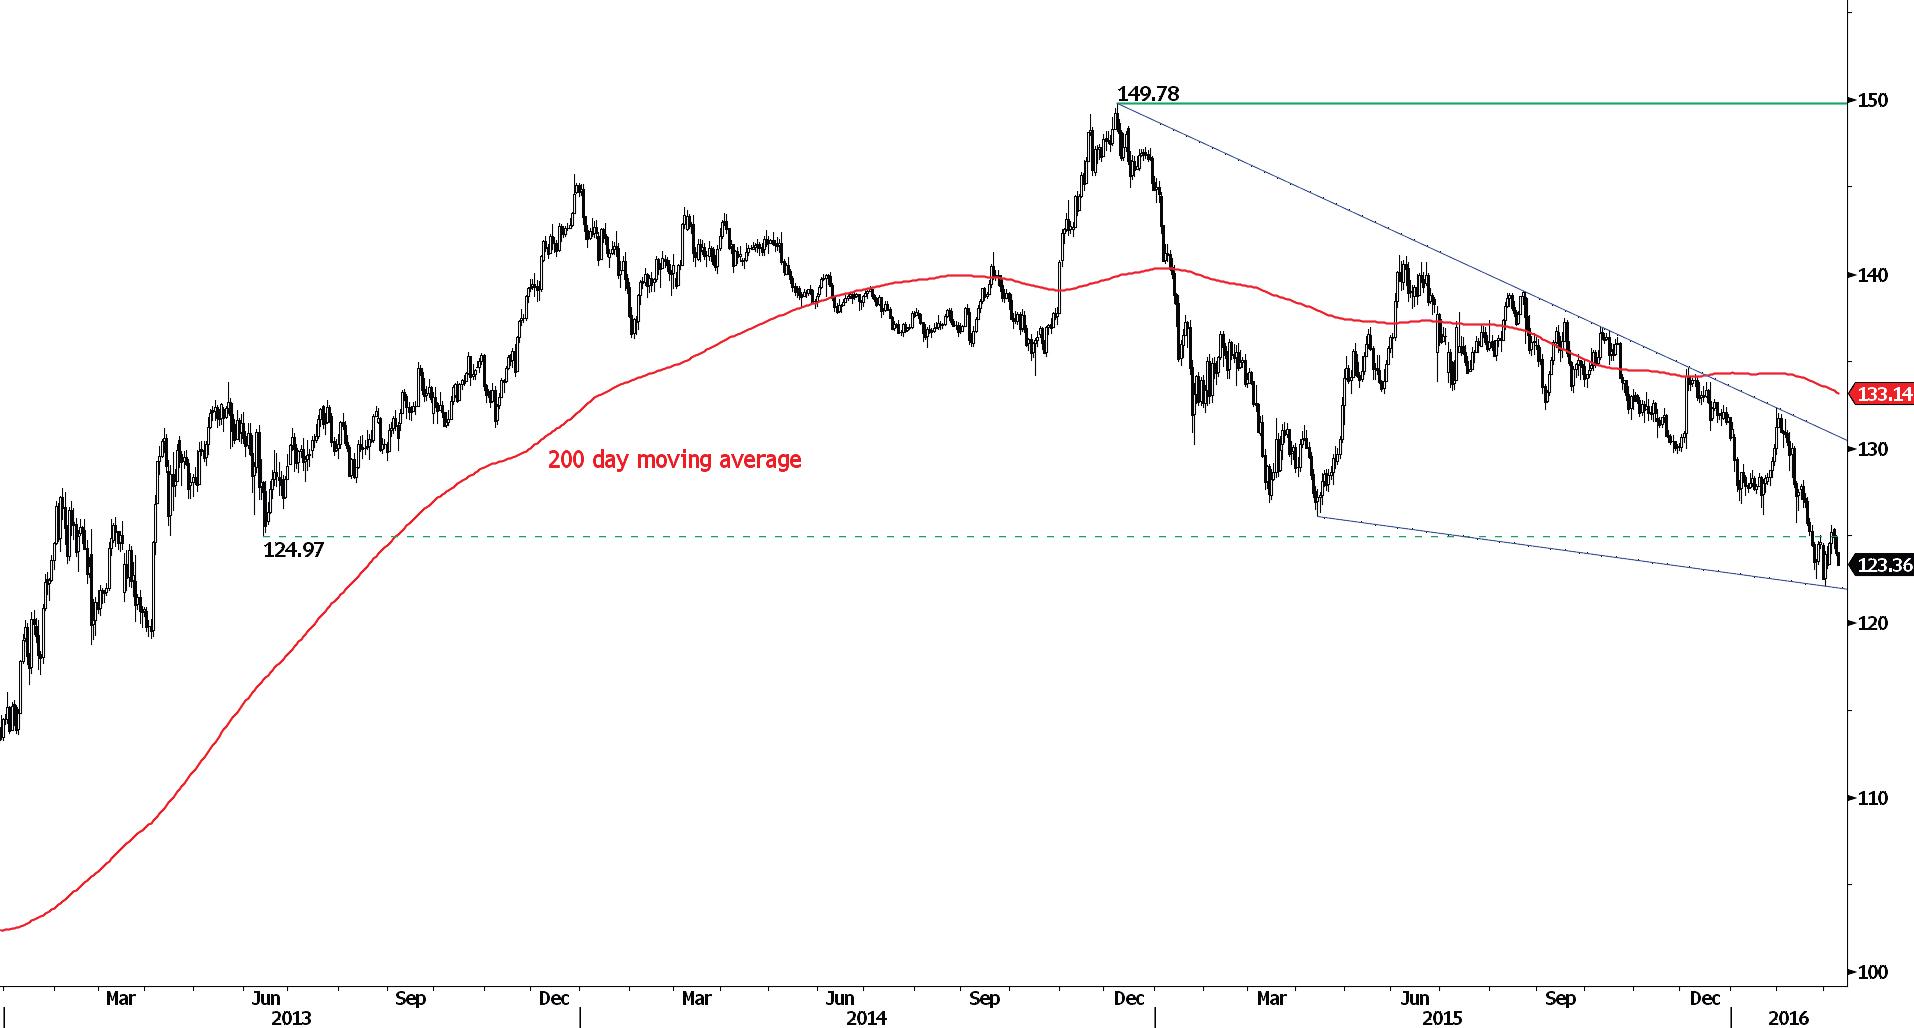
EUR/JPY's momentum is negative. Hourly resistance can be found at 125.59 (04/03/2016 high). Hourly support is given at 122.11 (01/03/2016 low). Expected to further decline.
In the longer term, the technical structure validates a medium-term succession of lower highs and lower lows. As a result, the resistance at 149.78 (08/12/2014 high) has likely marked the end of the rise that started in July 2012. Key support at 124.97 (13/06/2013 low) has been broken. Stronger support is given at 118.73 (25/02/2013 low). A key resistance can be found at 141.06 (04/06/2015 high).
EUR/GBP
Trading sideways
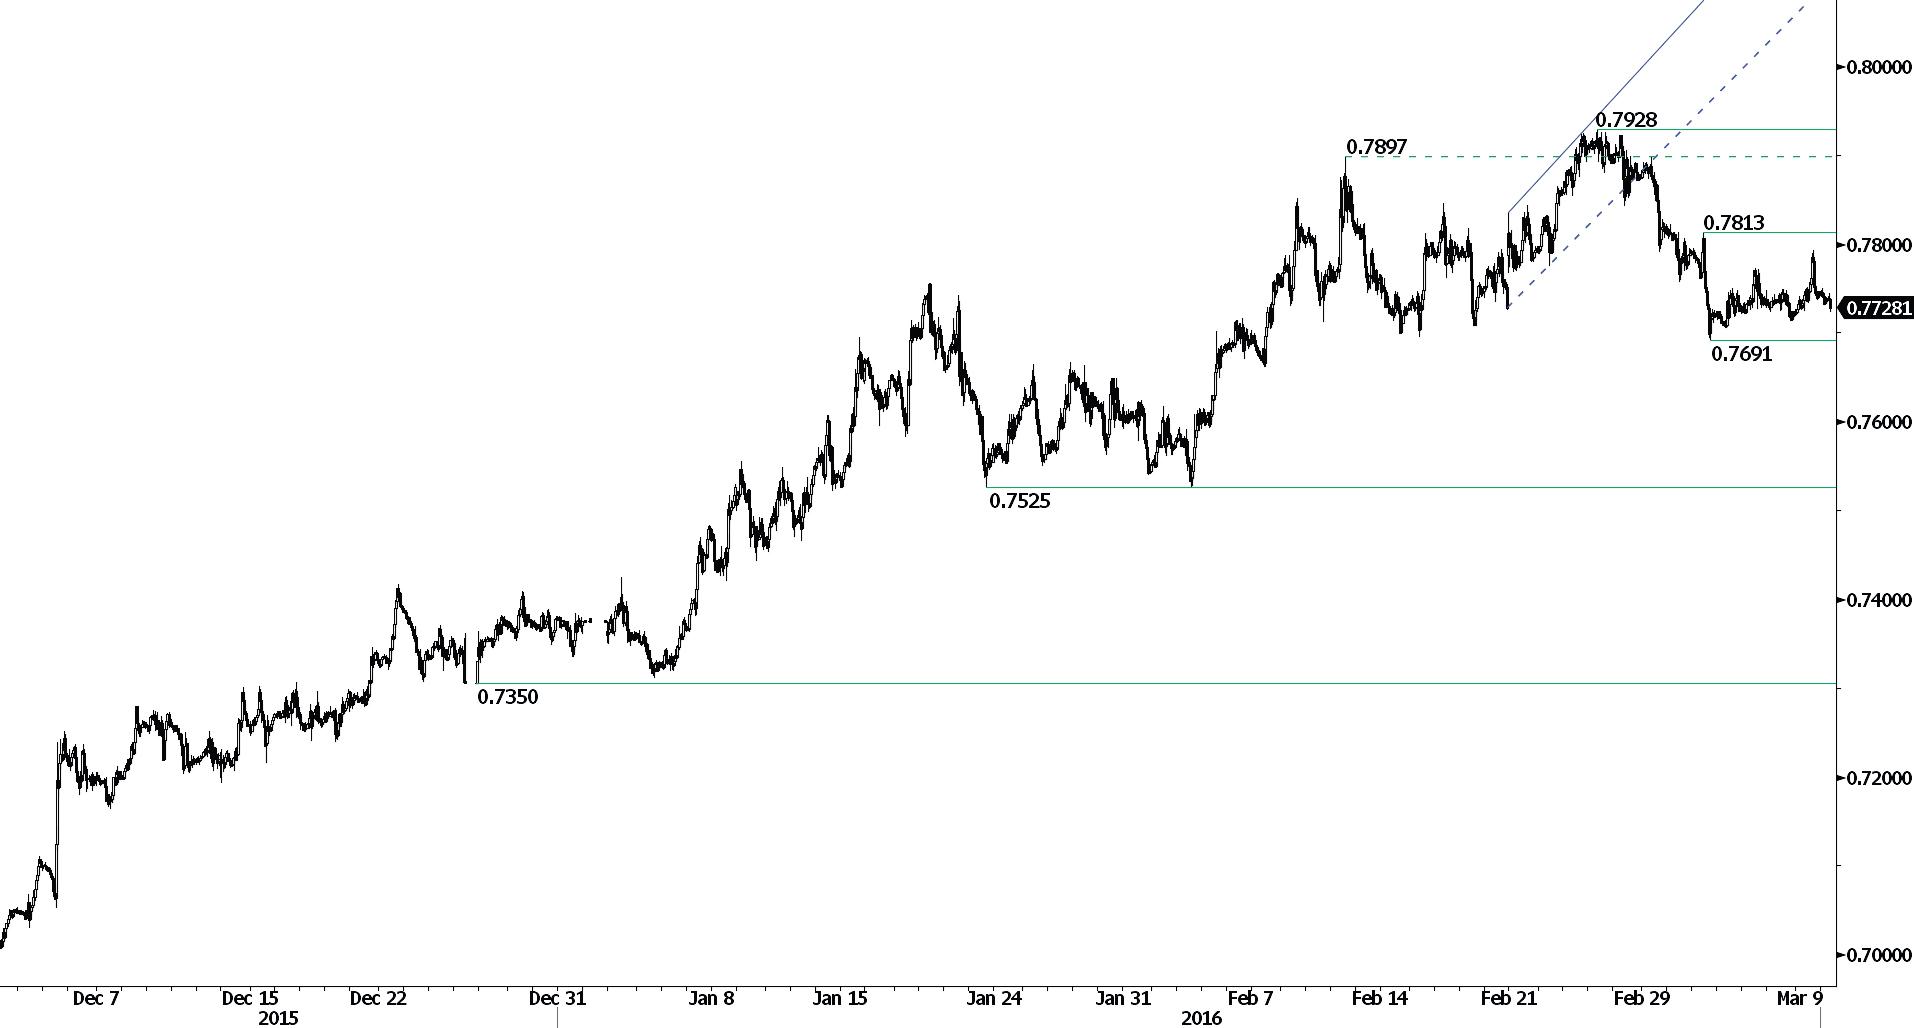
EUR/GBP keeps on trading sideways. The pair remains above hourly support at 0.7691 (02/03/2016 low). Next support lies at 0.7525 (22/01/2016 low). Hourly resistance can be located at 0.7787 (08/03/2016 high). Nonetheless, we think that bullish pressures are still on as long as support at 0.7691 stands
In the long-term, the technical structure suggests a growing upside momentum. The pair is trading well above its 200 DMA. Strong resistance can be found at 0.8066 (10/09/2014 high).
GOLD (in USD)
Bearish consolidation.
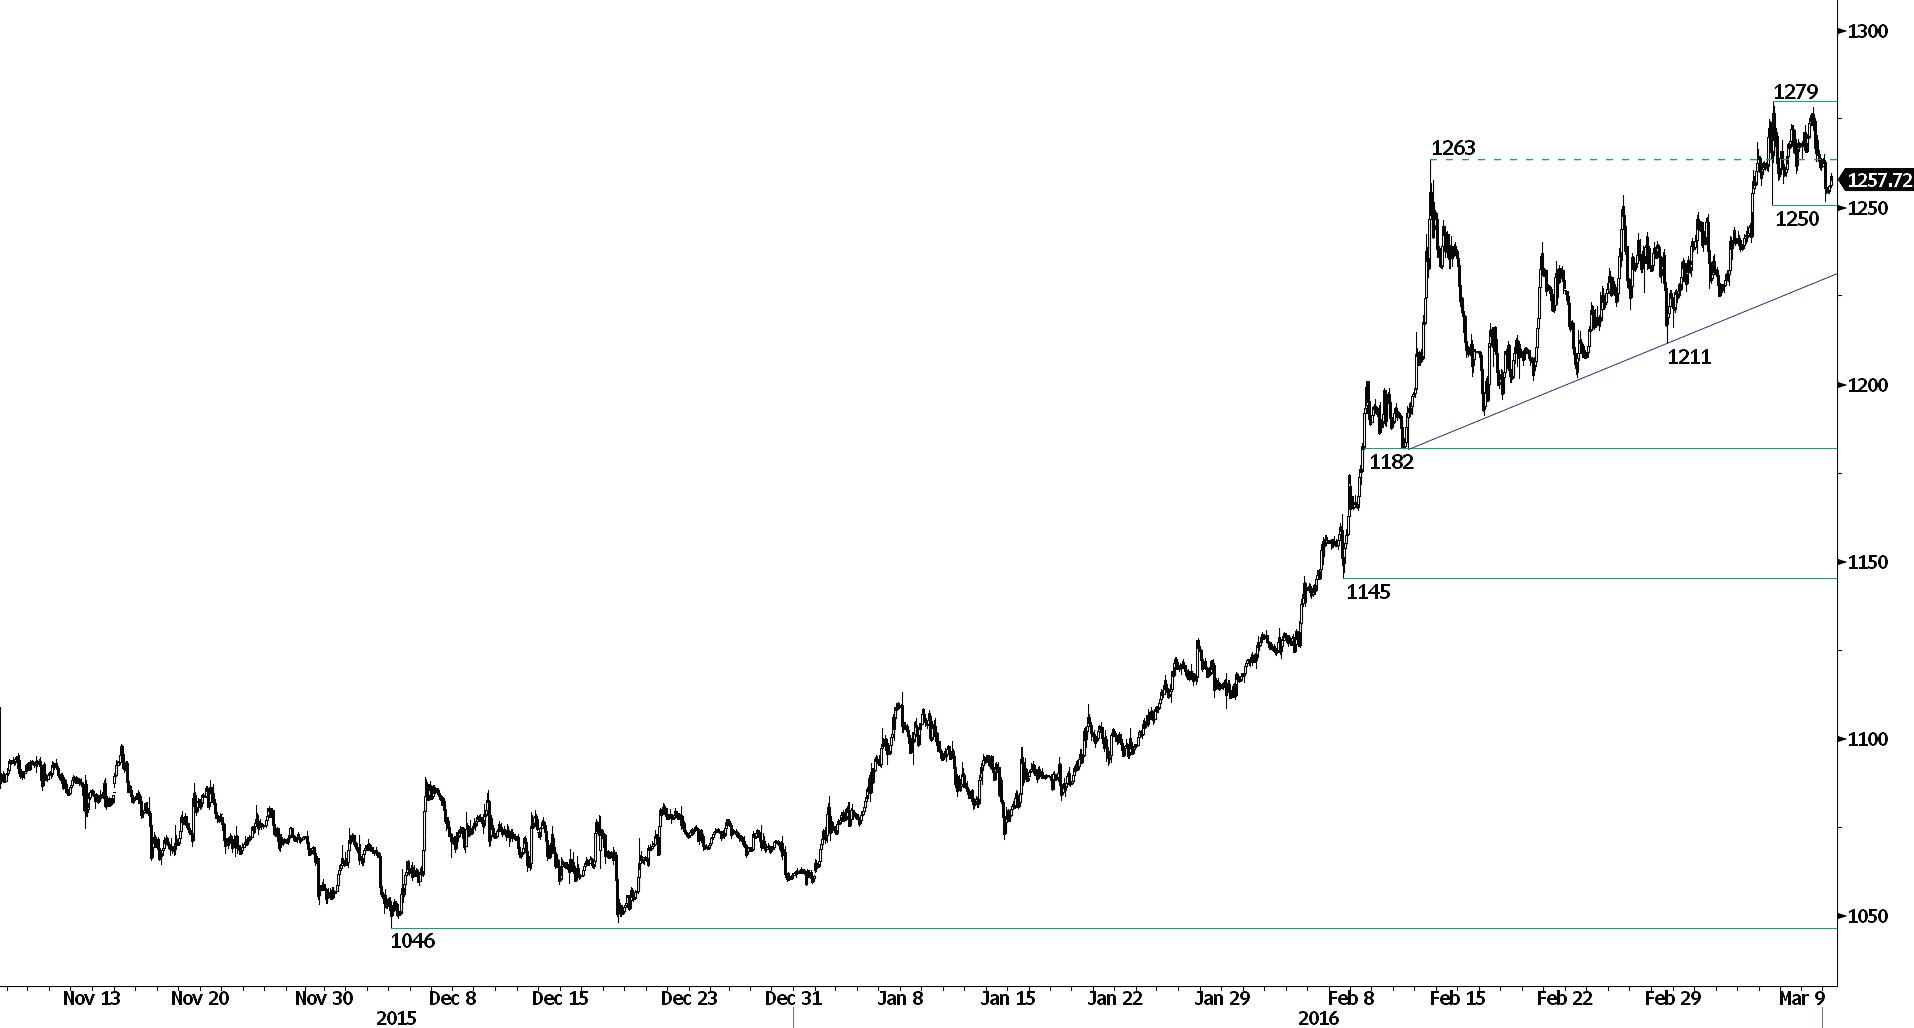
Gold's bullish momentum keeps going despite yesterday's consolidation. Hourly resistance is given at 1279 (04/03/2015 high). Hourly supports lies at 1250 (04/03/2016 low). Expected to show continued strengthening.
In the long-term, the technical structure suggests that there is a growing upside momentum. A break of 1392 (17/03/2014) is necessary ton confirm it, A major support can be found at 1045 (05/02/2010 low).
SILVER (in USD)
Lack of follow-through.
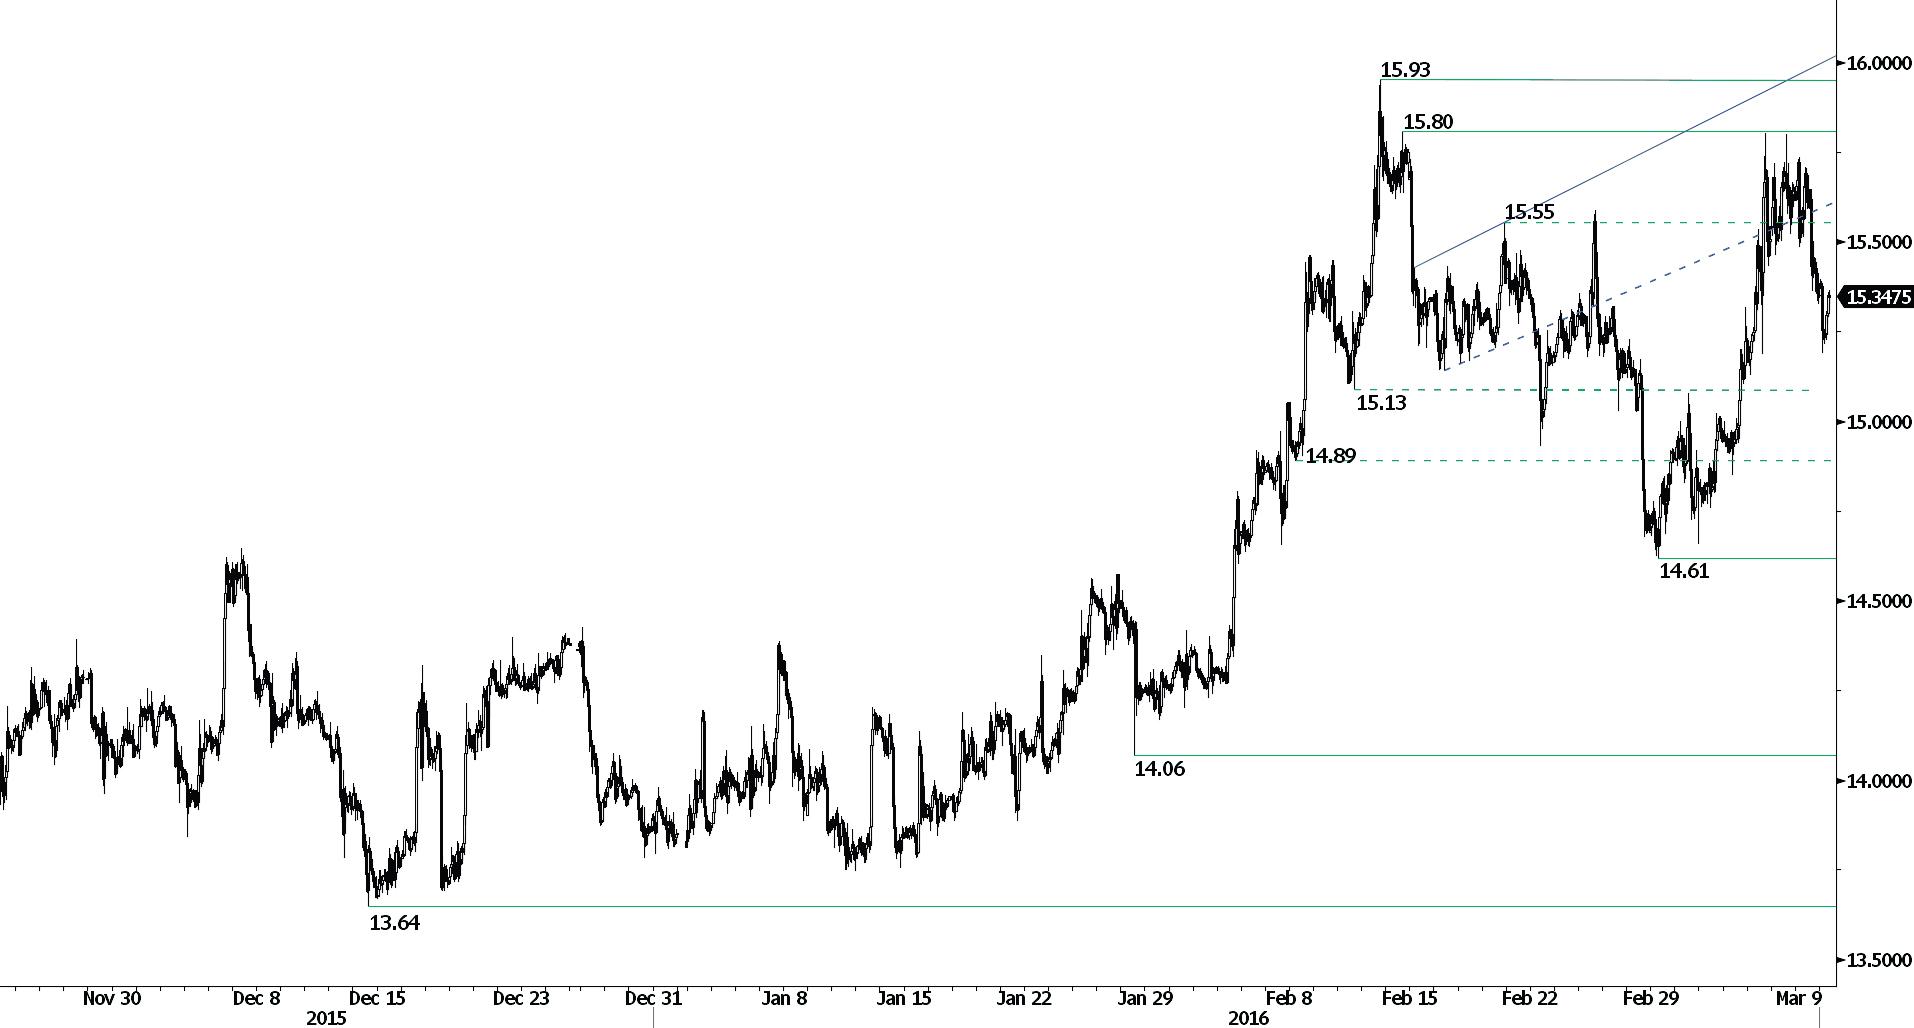
Silver is very volatile, mixing large ups and downs. Hourly resistances are given at 15.80 (12/02/2016 high) & 15.93 (11/02/2016 high). Hourly support can be found at 15.18 (04/03/2016 low).
In the long-term, the break of the major support area between 18.64 (30/05/2014 low) and 18.22 (28/06/2013 low) confirms an underlying downtrend. Strong support can be found at 11.75 (20/04/2009). A key resistance stands at 18.89 (16/09/2014 high).
Crude Oil (in USD)
Recovery continues.
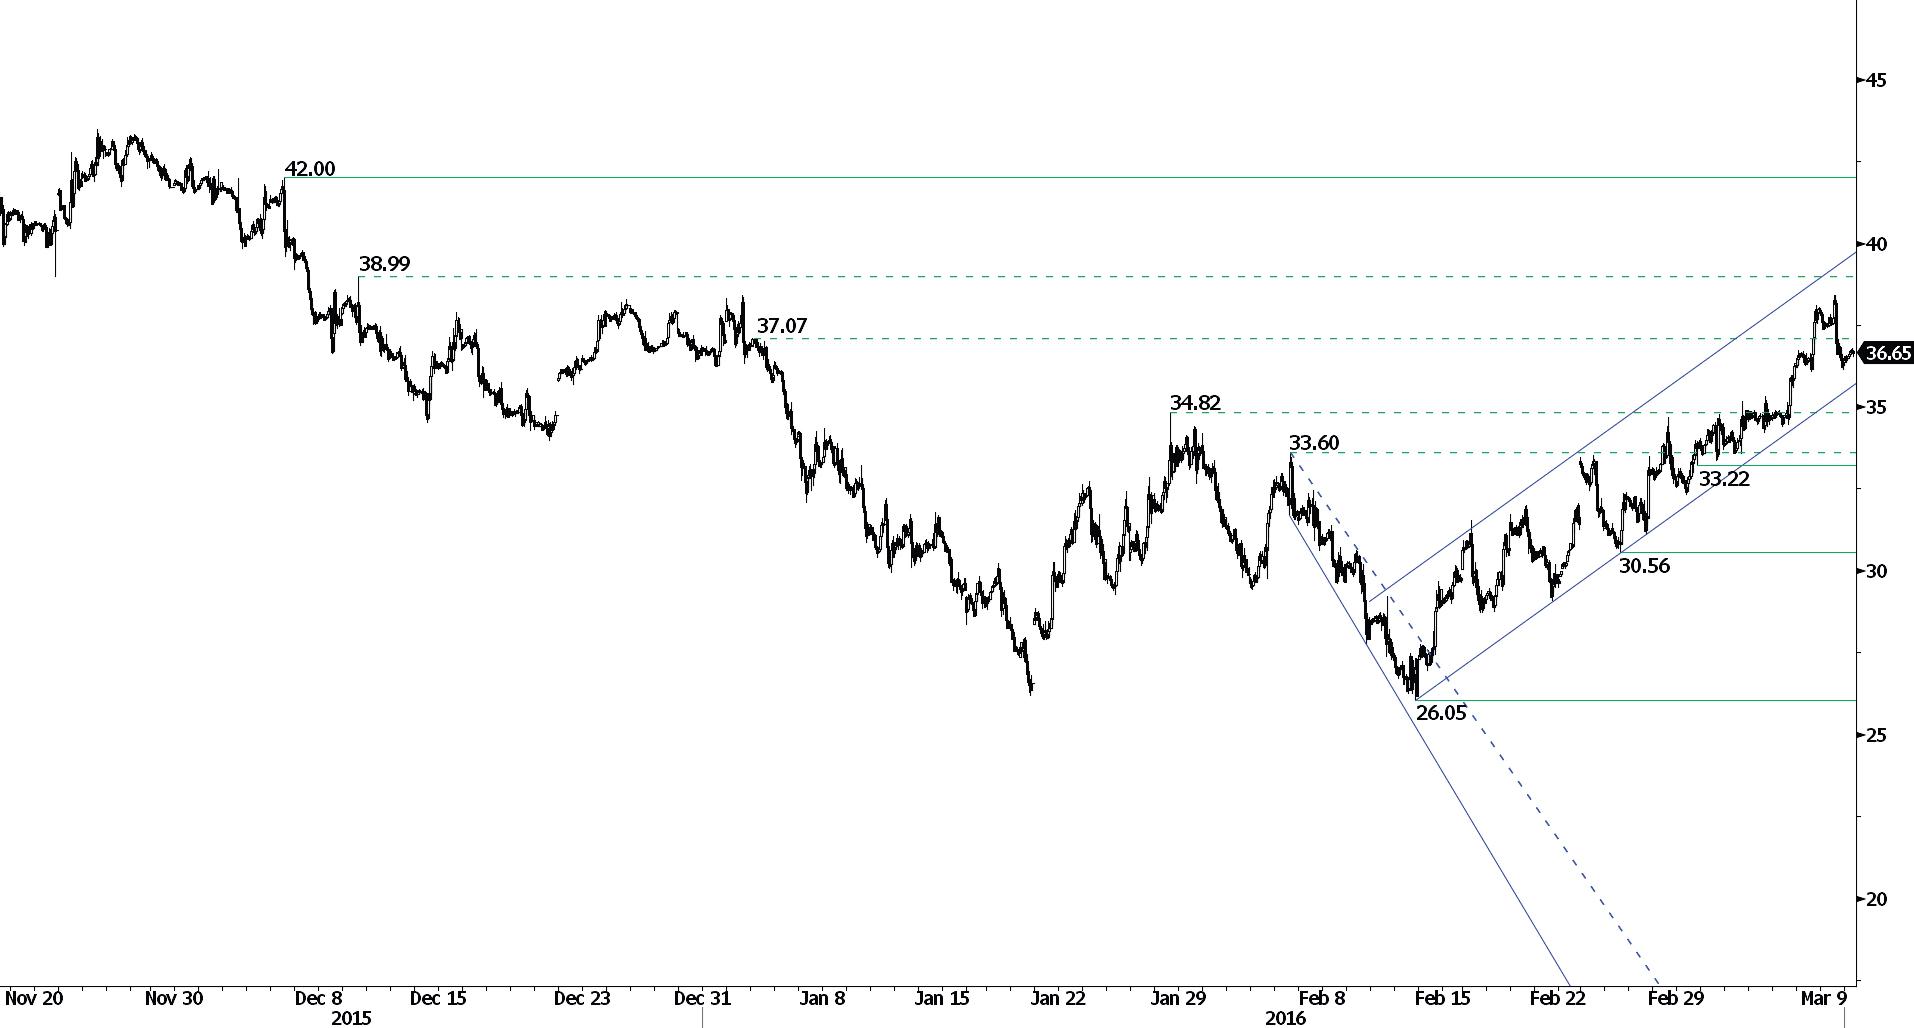
Crude oil continues to move within a rising channel. Hourly resistance is given at 38.99 (09/12/2016 high). Hourly support can be found at 36.09 (07/03/2016 low). A more significant support stands at 35 (rising channel). Expected to see continued strength in the short-term.
In the long-term, crude oil is on a sharp decline and is of course no showing any signs of recovery. Strong support at 24.82 (13/11/2002) is now on target. Crude oil is holding way below its 200-Day Moving Average (setting up at around 47). There are currently no signs that a reverse trend may happen.
This report has been prepared by Swissquote Bank Ltd and is solely been published for informational purposes and is not to be construed as a solicitation or an offer to buy or sell any currency or any other financial instrument. Views expressed in this report may be subject to change without prior notice and may differ or be contrary to opinions expressed by Swissquote Bank Ltd personnel at any given time. Swissquote Bank Ltd is under no obligation to update or keep current the information herein, the report should not be regarded by recipients as a substitute for the exercise of their own judgment.
Recommended Content
Editors’ Picks
AUD/USD hovers around 0.6500 amid light trading, ahead of US GDP

AUD/USD is trading close to 0.6500 in Asian trading on Thursday, lacking a clear directional impetus amid an Anzac Day holiday in Australia. Meanwhile, traders stay cautious due ti risk-aversion and ahead of the key US Q1 GDP release.
USD/JPY finds its highest bids since 1990, near 155.50

USD/JPY keeps breaking into its highest chart territory since June of 1990 early Thursday, testing 155.50 for the first time in 34 years as the Japanese Yen remains vulnerable, despite looming Japanese intervention risks. Focus shifts to Thursday's US GDP report and the BoJ decision on Friday.
Gold price treads water near $2,320, awaits US GDP data

Gold price recovers losses but keeps its range near $2,320 early Thursday. Renewed weakness in the US Dollar and the US Treasury yields allow Gold buyers to breathe a sigh of relief. Gold price stays vulnerable amid Middle East de-escalation, awaiting US Q1 GDP data.
Injective price weakness persists despite over 5.9 million INJ tokens burned

Injective price is trading with a bearish bias, stuck in the lower section of the market range. The bearish outlook abounds despite the network's deflationary efforts to pump the price. Coupled with broader market gloom, INJ token’s doomed days may not be over yet.
Meta Platforms Earnings: META sinks 10% on lower Q2 revenue guidance Premium

This must be "opposites" week. While Doppelganger Tesla rode horrible misses on Tuesday to a double-digit rally, Meta Platforms produced impressive beats above Wall Street consensus after the close on Wednesday, only to watch the share price collapse by nearly 10%.
