The early trading weeks of 2016 have seen the return of brutal punishment in the oil markets with WTI oil being repeatedly crushed and having found itself falling to its lowest level in over a decade below $30.50. The value of the commodity has already extended its decline by around a further 20% this year and although this is another astonishing drop following continual selling throughout last year, which has ultimately led to prices falling nearly 80% from its peaks just eighteen months ago, the dismal outlook is still favored towards additional declines. The overwhelming supply and demand equation that has encouraged dramatic selling is going nowhere anytime soon, with a persistent aggressive oversupply in the markets consistently haunting investor attraction, while weaker forecasts around global growth weighs on demand, and it is likely that more global economic downgrades from major institutions are to follow early this year.
It has not only become incredibly difficult to argue for a case to purchase oil, but also to simply structure a viewpoint from where prices can rebound and maintain themselves without entering yet another round of selling. The economic conditions are quite simply so overwhelmingly and aggressively against the commodity that there is still no visible floor for oil weakness. Another reason why it is difficult to find a floor despite further aggressive declines which are putting us within touching distance of entering the $20 range is because Iran has not yet began to unleash its own production potential, which would even further squash the already aggressive supply and demand equation towards the momentum of sellers. Both equity markets and central banks have still not digested such prolonged weakness in the oil markets, and it wouldn’t surprise me in the slightest if central banks or other policymakers resume to change policy taking into account the prolonged weakness in commodities that are vital to their exports.
Many are wondering how producers can handle such depressed prices and were eagerly awaiting to see if this impacts the United States, but traders are now losing patience with no correlation yet to be seen between declining US oil rigs and the weekly inventory reports released from the United States. Comments late last year from Saudi Arabia that it would be willing to collaborate with others to achieve stability in the markets provided some promise to those hoping for a rebound in sentiment, but there are concerns that the recent escalation in political tensions between Saudi Arabia and Iran will make any combined production cut from major producers difficult. It should also be taken into account how difficult it would be to bring leaders from so many different economies around the globe together to collectively agree on production levels. Although the situations are entirely different, it was only a few months ago that the headlines were focused on the Greece situation and these were collective discussions between very senior figures in the same European Union. You would just have to imagine how difficult it would be to find an agreement on a production ceiling for members of the OPEC committee group, let alone finding producers outside of OPEC to join and cut production also.
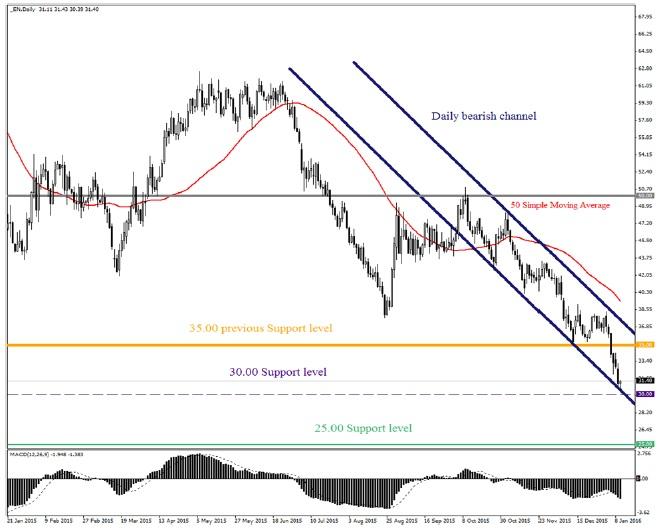
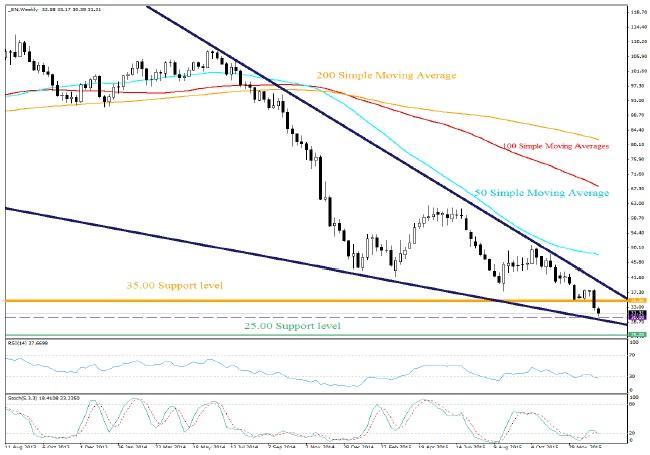
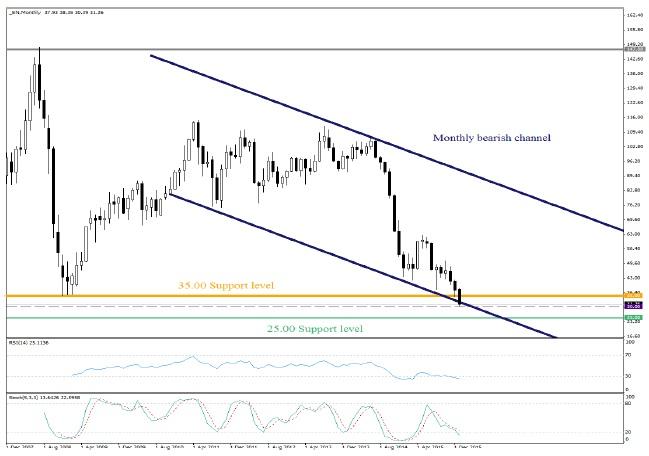
In regards to the technicals, all of the charts paint a depressing picture and showcase how sellers are clearly in control of this market. Starting with the daily timeframe, prices are clearly trading inside a steep bearish channel with $30 acting as a major support level. Bears are clearly in control and as long as prices can continue to trade below $35, a breakdown below $30 invites a further potential selloff towards $25. The monthly timeframe also suggests that $35 is now a heavy resistance level and was previously seen as major support. Previous support at $35 is now going to be seen as major resistance, and any failure to close above this level will likely invite opportunities for investors to enter another sellon rally opportunity. The weekly timeframe also shows that prices are compressing heavily to the downside. Last week’s bearish engulfment combined with the fact that prices are below the weekly 50,100 and 200 SMA should encourage a further selloff towards $30. A weekly close below $30 may suggest another buildup in bearish momentum which can invite sellers to attack prices now seen since April 2003 at $25.
WTI Daily Chart:
WTI Weekly Chart:
WTI Monthly Chart:
Comparebroker is a comparison site and we spend hundreds of hours to keep the information up to date. However, users are advised to do their own due diligence and nothing can be perceived any advise. The content on the website is purely for education purposes only
Recommended Content
Editors’ Picks
AUD/USD failed just ahead of the 200-day SMA

Finally, AUD/USD managed to break above the 0.6500 barrier on Wednesday, extending the weekly recovery, although its advance faltered just ahead of the 0.6530 region, where the key 200-day SMA sits.
EUR/USD met some decent resistance above 1.0700

EUR/USD remained unable to gather extra upside traction and surpass the 1.0700 hurdle in a convincing fashion on Wednesday, instead giving away part of the weekly gains against the backdrop of a decent bounce in the Dollar.
Gold stays firm amid higher US yields as traders await US GDP data

Gold recovers from recent losses, buoyed by market interest despite a stronger US Dollar and higher US Treasury yields. De-escalation of Middle East tensions contributed to increased market stability, denting the appetite for Gold buying.
Ethereum suffers slight pullback, Hong Kong spot ETH ETFs to begin trading on April 30

Ethereum suffered a brief decline on Wednesday afternoon despite increased accumulation from whales. This follows Ethereum restaking protocol Renzo restaked ETH crashing from its 1:1 peg with ETH and increased activities surrounding spot Ethereum ETFs.
Dow Jones Industrial Average hesitates on Wednesday as markets wait for key US data

The DJIA stumbled on Wednesday, falling from recent highs near 38,550.00 as investors ease off of Tuesday’s risk appetite. The index recovered as US data continues to vex financial markets that remain overwhelmingly focused on rate cuts from the US Fed.


