Brent Mar. 16 could extend its rebound from $27.10 to reach $29.83, before residing for trading currently near $29.50, despite US EIA Oil stockpile growing in the week ending on Jan. 15 to 486,537m by gaining 3.979m barrels, while the market was waiting for adding 2.248m, after increasing by only 0.234m in the week ending on Jan. 8 to keep hovering above 480m barrels in the recent 11 weeks.
The oil prices rising contributed in restoring confidence in the equities markets driving SP-Mar.16 to keep most of what it gained following bottoming out from 1804.25 last Wednesday to be trading now near 1860, despite US Initial Jobless Claims rising in the week ending on Jan. 15 to 293k, while the consensus was referring to retreating to 278k from 283k in the week ending on Jan. 8.
While the single currency was depressed by the ECB's president Mario Draghi who managed to send dovish forward guidance like what he did in October meeting, before December meeting deposit rate cutting by 0.1% to -0.3% and decision to extended the ECB bond-buying program until at least March 2017 from September 2016.
Draghi said yesterday that "The ECB may reconsider its policy stance in March amid a deteriorating economic outlook and turmoil in global markets".
Instrument in Focus: EURUSD
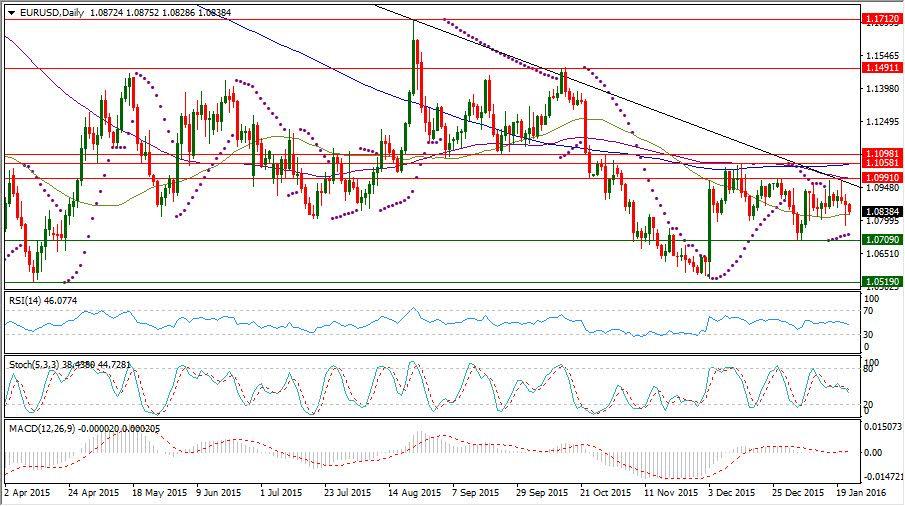
After spending most of last week trading times near 1.088, EURUSD has decided to pull back to be traded near 1.0840 currently.
The pair is still below the trendline resistance extension from 1.3992 to 1.1712, after failing to rise above its daily SMA100.
The pair is now in meeting with its daily SMA50 in its day number 6 of continued existence above its daily Parabolic SAR (step 0.02, maximum 0.2) which is reading today 1.0735.
After having balanced situation by residing for trading near 1.088, the pair parameters are showing now tendency to the downside.
EURUSD daily RSI-14 is in the neutral region reading now 46.077 and also its daily Stochastic Oscillator (5, 3, 3) which is more sensitive to the volatility is having now its main line in the neutral region reading 38.438 leading to the downside its signal line which is reading 44.728.
Important levels: Daily MA50 @ 1.0827, Daily MA100 @ 1.0990 and Daily MA200 @ 1.1051
S&R:
S1: 1.0709
S2: 1.0519
S3: 1.0461
R1: 1.0991
R2: 1.1058
R3: 1.1093
EURUSD Daily Chart:
Commodities: Brent Mar. 16
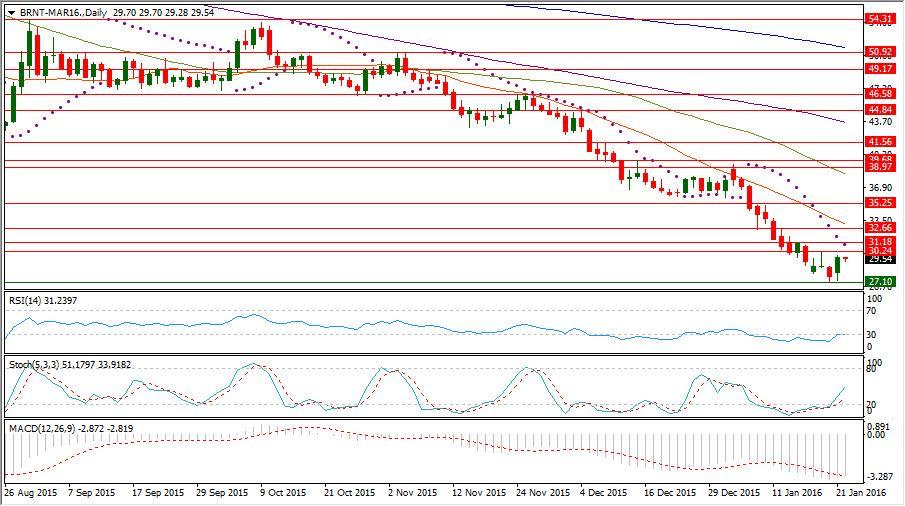
Brent Mar. 16 could shrug off higher than expected rising of US crude inventories containing last Wednesday falling to $27.10 by rising to $29.83.
Brent Mar. 16 has been exposed to increasing downside momentum in the beginning of this week which opened on a downside gap at $28.23, before having extension to $27.10.
The oil prices have been negatively impacted by implying the Iranian nuclear deal which can support the supplies by 0.5m barrels a day initially, while the worries about the demand solidarity were rising still because of the economic slowdown signs from china and the weaker than expected manufacturing performance in US last month.
Brent Mar. 16 daily RSI could barely get out from its oversold area below 30 reading now 31.237 in the neutral region and also its daily Stochastic Oscillator (5, 3, 3) which is more sensitive to the volatility is having now its main line in into the neutral region reading 51.179 leading its signal line to refer now to 33.918, after continued existence in the oversold area below 20 since Jan. 8.
Despite having its biggest daily gains since Oct. 18 yesterday, Brent Mar. 16 is still below its daily Parabolic SAR (step 0.02, maximum 0.2) which is referring today to 31.02 in its day number 13 of continued being above the trading rate.
Important levels: Daily SMA20 @ $33.04, Daily SMA50 @ $38.30, Daily SMA100 @ $43.63 and Daily SMA200 @ $51.36
S&R:
S1: $27.10
S2: $25.51
S3: $25.33
R1: $30.24
R2: $31.18
R3: $32.37
Brent Mar. 16 Daily chart:
Hot instrument: AUDUSD
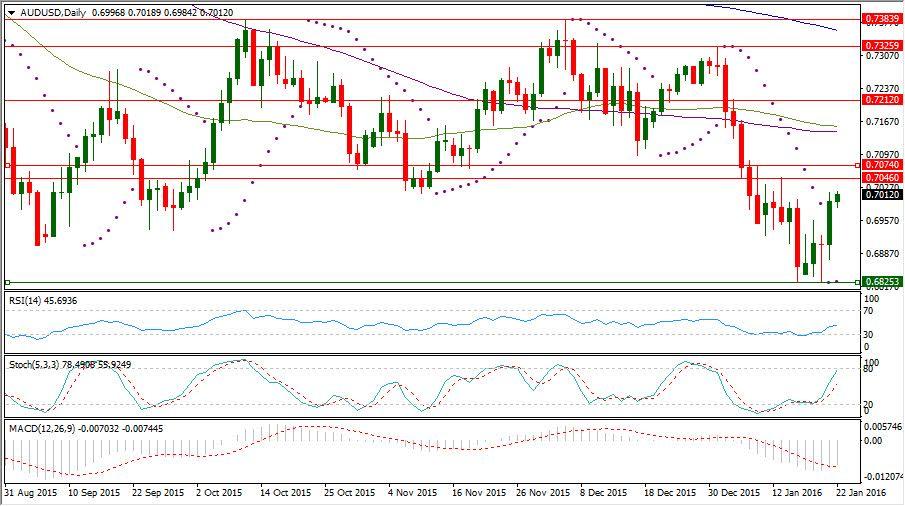
AUDUSD could get use of the Chinese stocks rebound to extend its rebound from 0.6825 to be trading currently above 0.7000 psychological level containing its total falling of last week.
After it had been exposed to increasing downside momentum by breaking 0.6903 supporting level which could prop up the pair on last Sep. 4.
After yesterday rebound, AUDUSD daily Parabolic SAR (step 0.02, maximum 0.2) is now its second day of being below the trading rate reading today 0.6826.
AUDUSD daily Stochastic Oscillator (5, 3, 3) which is sensitive to the volatility is having its main line in neutral region but close to the overbought area above 80 reading now 78.490 dragging the signal line out the oversold area below 20 to read now 55.924.
Important levels: Daily SMA50 @ 0.7155, Daily SMA100 @ 0.7146 and Daily SMA200 @ 0.7360
S&R:
S1: 0.6825
S2: 0.6769
S3: 0.6527
R1: 0.7046
R2: 0.7084
R3: 0.7120
AUDUSD Daily chart:
Recommended Content
Editors’ Picks
AUD/USD risks a deeper drop in the short term

AUD/USD rapidly left behind Wednesday’s decent advance and resumed its downward trend on the back of the intense buying pressure in the greenback, while mixed results from the domestic labour market report failed to lend support to AUD.
EUR/USD leaves the door open to a decline to 1.0600

A decent comeback in the Greenback lured sellers back into the market, motivating EUR/USD to give away the earlier advance to weekly tops around 1.0690 and shift its attention to a potential revisit of the 1.0600 neighbourhood instead.
Gold is closely monitoring geopolitics

Gold trades in positive territory above $2,380 on Thursday. Although the benchmark 10-year US Treasury bond yield holds steady following upbeat US data, XAU/USD continues to stretch higher on growing fears over a deepening conflict in the Middle East.
Bitcoin price shows strength as IMF attests to spread and intensity of BTC transactions ahead of halving

Bitcoin (BTC) price is borderline strong and weak with the brunt of the weakness being felt by altcoins. Regarding strength, it continues to close above the $60,000 threshold for seven weeks in a row.
Is the Biden administration trying to destroy the Dollar?

Confidence in Western financial markets has already been shaken enough by the 20% devaluation of the dollar over the last few years. But now the European Commission wants to hand Ukraine $300 billion seized from Russia.


