The oil benchmarks have watched yesterday shy try to correct to the upside ended to filling the downside gap opening of this week by short lived period above $30, before retreating again.
The equities markets in EU and US have tracked the oil prices to watch retreating by the end of yesterday session, after rebounding in the beginning of it.
Today Asian session has followed US to watch the red color coming back painting the major equities indexes with no snapping of the oil slide even during the Asian session.
While the British pound is still suffering from the first appearance of BOE's chief Mark Carney who lowered the expectations of watching BOE tracking the Fed by raising the interest rate by saying phrases like " The journey to monetary-policy normalization is still young" and like "Now is not yet the time to raise interest rates" or even like " U.S. has stronger cost pressures, while Britain faces a greater drag from fiscal policy and weak global inflation"
Carney did not highlighted the oil slide influences on the inflation outlook in UK only but he has underscored also the global economic downside risks impacts on UK economic expansion.
From another side, Dec UK CPI came yesterday as expected to show the highest yearly rising last year by 0.2% only, after barely increasing by 0.1% in November, while BOE's yearly inflation target is 2%.
Instrument in Focus: GBPUSD
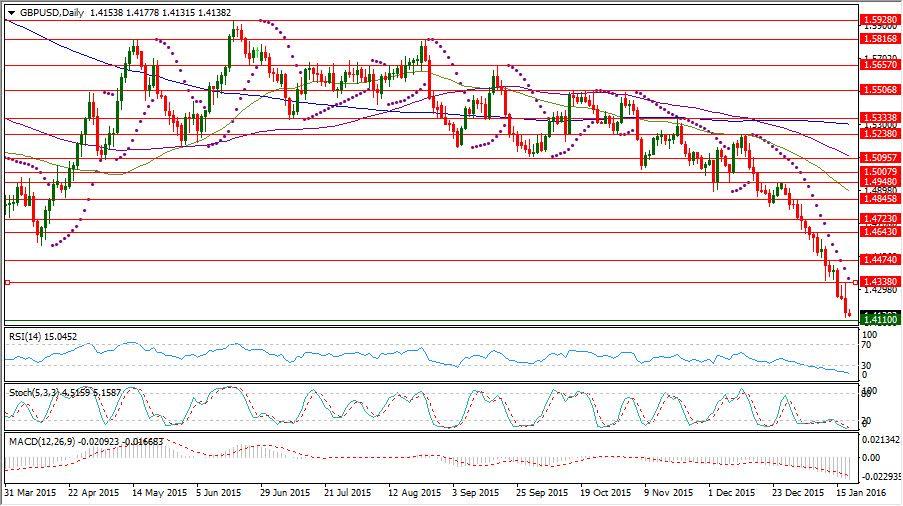
The cable shy try to correct from 1.4235 has been limited by reaching 1.4338 which has been followed by retreating extension to 1.4127, before residing for trading near 1.4150 currently having 1.4110 bottom of March 2009 unbroken yet.
The cable is still maintaining its relatively high falling pace which started following forming a top at 1.5238 on last Dec. 11, after forming a series of lower highs and also lower lows.
The cable daily RSI is into its oversold area below 30 reading now 15.045 and also its daily Stochastic Oscillator (5, 3, 3) which is more sensitive to the volatility is having now its main line in relatively deep place into its oversold area below 20 reading only 4.515 and also its signal line which is reading now 5.158 showing stronger need for finding a room to fix this oversold stance.
The cable daily Parabolic SAR (step 0.02, maximum 0.2) is in its day number 25 of continued being above the trading rate reading today 1.4365.
Important levels: Daily SMA50 @ 1.4892, Daily SMA100 @ 1.5106 and Daily SMA200 @ 1.5299
S&R:
S1: 1.4110
S2: 1.40
S3: 1.3844
R1: 1.4338
R2: 1.4474
R3: 1.4643
GBPUSD Daily Chart:
Commodities: CL Feb. 16
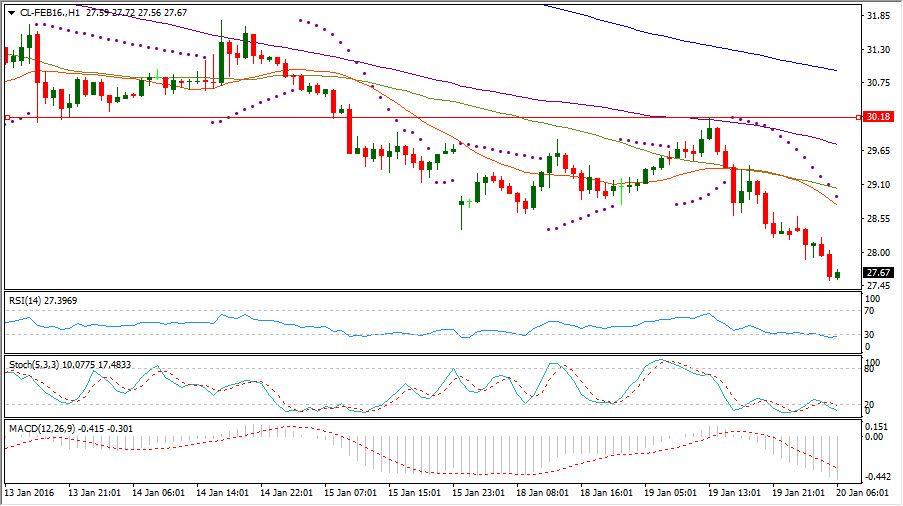
CL FEB 16 could fill the downside opening gap of this week by reaching $30.18 yesterday, before resuming its slide breaking last Monday low at $28.36 causing more stop buying orders triggering to reach $27.54 during today Asian session.
The mixture daily parameters are still showing deep existence in the oversold area waiting for today release of US EIA Oil stockpile of the week ending on Jan. 15 which was hovering above 480m barrels in the recent 10 weeks.
Over the hourly chart, CL FEB 16 RSI is referring also to existence in its oversold area below 30 reading now 27.396 and also its daily Stochastic Oscillator (5, 3, 3) which is more sensitive to the volatility is having its main line in the oversold region below 20 reading now 10.077 with its signal line which is referring to this same area reading 17.483.
Important levels: Daily SMA20 @ $33.57, Daily SMA50 @ $37.45, Daily SMA100 @ $41.70 and Daily SMA200 @ $47.86.
S&R:
S1: $26.93
S2: $25.25
S3: $24.21
R1: $30.18
R2: $32.19
R3: $34.30
CL Feb. 16 Hourly chart:
Hot instrument: SP-MAR16
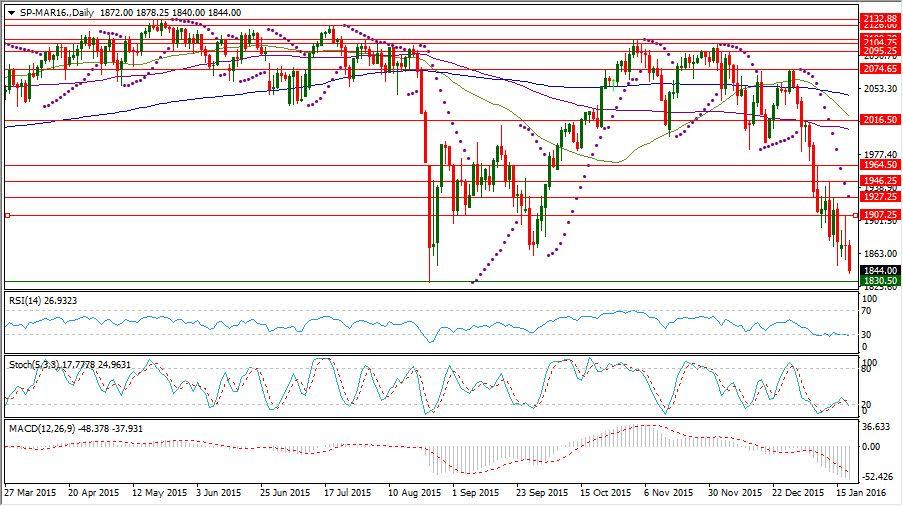
SP-MAR16 could rise to 1907.25 to place another lower high to fall from again breaking 1849.25 which could supporting level by the end of last week.
SP-Mar16 has been exposed to increasing down side momentum following forming a lower high at 2074.65 on Dec. 30, after facing difficulty several times to keep a place above 2100 to be exposed to the current downside extension, after failing to return above its daily SMA100 forming resistance at 2016.50.
SP-Mar16 daily RSI is referring now to existence in its oversold area below 30 reading 26.932 and also its daily Stochastic Oscillator (5, 3, 3) which is more sensitive to the volatility is having now its main line in the oversold region below 20 reading 17.777 leading its signal line which is still in the neutral territory reading now 24.963.
Important levels: Daily SMA50 @ 2021.34, Daily SMA100 @ 2005.82 and Daily SMA200 @ 2044.55
S&R:
S1: 1830.50
S2: 1812.38
S3: 1802.63
R1: 1907.25
R2: 1927.25
R3: 1946.25
SP-MAR16 Daily chart:
Recommended Content
Editors’ Picks
EUR/USD hovers around 1.0700 ahead of German IFO survey

EUR/USD is consolidating recovery gains at around 1.0700 in the European morning on Wednesday. The pair stays afloat amid strong Eurozone business activity data against cooling US manufacturing and services sectors. Germany's IFO survey is next in focus.
GBP/USD steadies near 1.2450, awaits mid-tier US data

GBP/USD is keeping its range at around 1.2450 in European trading on Wednesday. A broadly muted US Dollar combined with a risk-on market mood lend support to the pair, as traders await the mid-tier US Durable Goods data for further trading directives.
Gold: Defending $2,318 support is critical for XAU/USD

Gold price is nursing losses while holding above $2,300 early Wednesday, stalling its two-day decline, as traders look forward to the mid-tier US economic data for fresh cues on the US Federal Reserve interest rates outlook.
Crypto community reacts as BRICS considers launching stablecoin for international trade settlement

BRICS is intensifying efforts to reduce its reliance on the US dollar after plans for its stablecoin effort surfaced online on Tuesday.
Three fundamentals for the week: US GDP, BoJ and the Fed's favorite inflation gauge stand out Premium

While it is hard to predict when geopolitical news erupts, the level of tension is lower – allowing for key data to have its say. This week's US figures are set to shape the Federal Reserve's decision next week – and the Bank of Japan may struggle to halt the Yen's deterioration.


