The Asian equities markets could watch finally today serious try to recover their losses sending the US equities future indexes up, driving the gold and Japanese yen down with lower demand for safer assets, while the demand for reloading risky assets could send the US Treasuries prices down to have higher yields.
The return of some lost confidence could help the oil prices also to have a chance to rebound to watch WTI now close to $34 per barrel, after massive selling sent it to new 12 years low reaching $32.10 earlier yesterday.
The Loonie tracked the oil prices rebound to see now USDCAD setting back to 1.4080, after reaching yesterday 1.4167 which has been its highest reached level since August 2003.
While the markets are getting ready to receive Dec US labor report which is expected to show gaining of 200k jobs out of the farming sector with unchanged unemployment rate at 5%, after Dec US ADP Employment change has shown earlier this week soaring by 157k, while the consensus was referring to increasing by 192k, after adding 211k in November.
Instrument in Focus: USDJPY
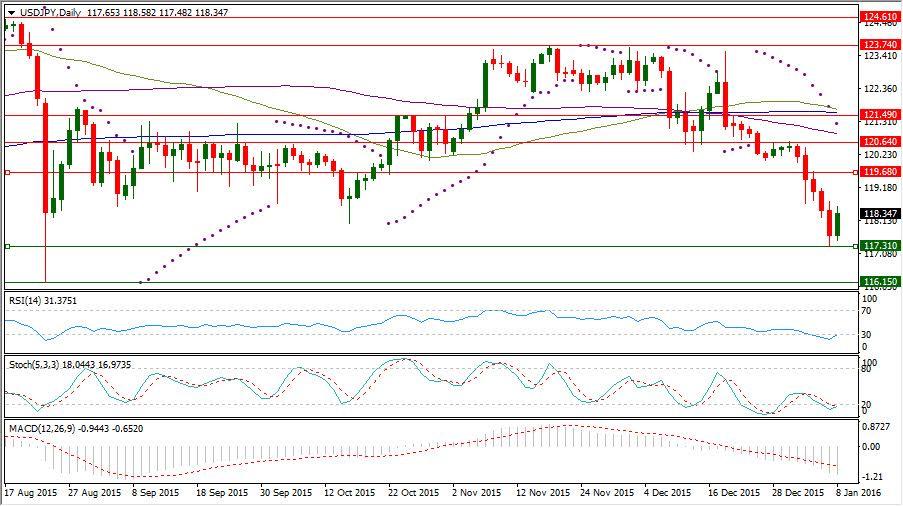
The equities recovery which has been obvious during the Asian session could help USDJPY to rebound for trading near 118.30, after falling extension to 117.31.
USDJPY has been already depressed by ending side way of trading between 121.21 and 123.74 by breaking its lower band at 121.21 and after failing to re-enter this trading barrier, it formed last week another lower high at 120.64 to fall further.
This pair faced increasing downside momentum following breaking of 120 psychological level this week with the Japanese yen ability to gain benefits from the Chinese Yuan suffering, as an Asian competitive reserve currency, while there is no signal yet from BOJ to take further easing steps.
Despite the rebound from 117.31, USDJPY daily Stochastic Oscillator (5, 3, 3) which is sensitive to the volatility is having now its main line in the oversold area below 20 reading now 18.044 and also its signal line which is reading now 16.973.
The pair daily Parabolic SAR (step 0.02, maximum 0.2) is reading now 121.23 in its day number 11 of consecutive being above the trading rate to reflect accumulating downside pressure on this pair.
Important levels: Daily SMA50 @ 121.68, Daily SMA100 @ 120.90 and Daily SMA200 @ 121.59
S&R:
S1: 117.31
S2: 116.15
S3: 115.55
R1: 119.68
R2: 120.64
R3: 121.49
USDJPY daily Chart:
Commodities: Gold
The worries about the Chinese manufacturing performance in the beginning of the week could trigger this risk aversion sentiment which has been fed by similar worries about the US manufacturing activities.
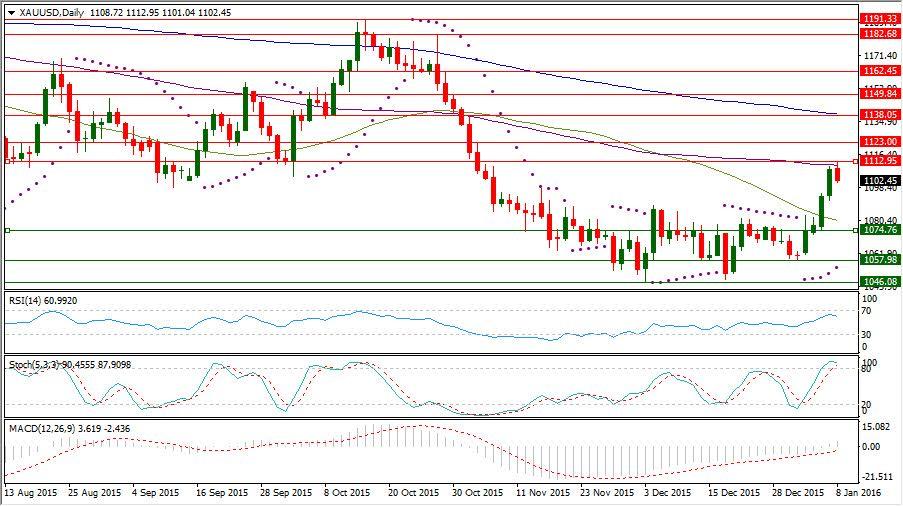
The demand for safe haven could send gold up to $1112.75 which is its highest reached level since last Nov. 4 breaking its resisting levels at $1089.70, $1097.86 and also $1110.94, as it could aggregate demand, after having a bottom at $1057.98 following flooring at $1046.08.
XAUUSD daily Parabolic SAR (step 0.02, maximum 0.2) is now below its trading rate for the fifth day in a row reading $1054.27.
XAUUSD daily Stochastic Oscillator (5, 3, 3) which is sensitive to the volatility is still having now its main line in the overbought region above 80 reading 90.455 and also its signal line which is reading now 87.909.
Important levels: Daily MA50 @ $1080.41, Daily MA100 @ $1110.68 and Daily MA200 @ $1139.07
S&R:
S1: $1074.76
S2: $1057.98
S3: $1046.08
R1: $1112.95
R2: $1123
R3: $1138.05
XAUUSD Daily chart:
Hot instrument: AUDUSD
The Aussie which is sensitive to the Chinese development, could recover for trading near 0.7050, after falling extension to 0.6978 to express about rising back confidence in China.
The Aussie has been exposed to increasing downside pressure, after the release of Dec Chinese NBS Manufacturing PMI in the beginning of this week, as the Australian economy depends mainly on exporting the raw materials especially to China.
While the economic slowdown in China can keep the door opened for further stimulating measurements to be taken by RBA which is holding the interest rate unchanged at 2% since last May. 5.
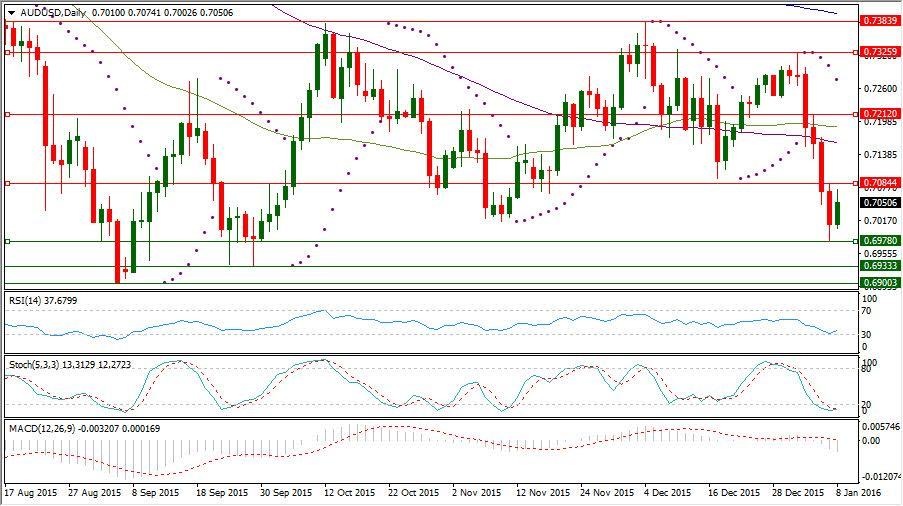
AUDUSD contained its rebound from 0.7095, after forming a new lower high at 0.7325 below 0.7383 resisting level.
AUDUSD daily Parabolic SAR (step 0.02, maximum 0.2) is now its fifth consecutive day of being above the trading rate reading today 0.7276.
Despite the rebound from 0.6978, AUDUSD daily Stochastic Oscillator (5, 3, 3) which is sensitive to the volatility is still having its main line in the oversold area below 20 reading 13.312 and also its signal line which is reading 12.272.
Important levels: MA50 @ 0.7189, MA100 @ 0.7160 and MA200 @ 0.7397
S&R:
S1: 0.6978
S2: 0.6933
S3: 0.6900
R1: 0.7084
R2: 0.7120
R3: 0.7325
AUDUSD Daily chart:
Recommended Content
Editors’ Picks
AUD/USD risks a deeper drop in the short term

AUD/USD rapidly left behind Wednesday’s decent advance and resumed its downward trend on the back of the intense buying pressure in the greenback, while mixed results from the domestic labour market report failed to lend support to AUD.
EUR/USD leaves the door open to a decline to 1.0600

A decent comeback in the Greenback lured sellers back into the market, motivating EUR/USD to give away the earlier advance to weekly tops around 1.0690 and shift its attention to a potential revisit of the 1.0600 neighbourhood instead.
Gold is closely monitoring geopolitics

Gold trades in positive territory above $2,380 on Thursday. Although the benchmark 10-year US Treasury bond yield holds steady following upbeat US data, XAU/USD continues to stretch higher on growing fears over a deepening conflict in the Middle East.
Bitcoin price shows strength as IMF attests to spread and intensity of BTC transactions ahead of halving

Bitcoin (BTC) price is borderline strong and weak with the brunt of the weakness being felt by altcoins. Regarding strength, it continues to close above the $60,000 threshold for seven weeks in a row.
Is the Biden administration trying to destroy the Dollar?

Confidence in Western financial markets has already been shaken enough by the 20% devaluation of the dollar over the last few years. But now the European Commission wants to hand Ukraine $300 billion seized from Russia.


