While Dec Caixin China Services PMI came today to underscore the economic slowdown in China by falling to 50.2 which is the weakest pace of expansion since July 2014, after 51.2 in November.
The Chinese Yuan has suffered also by the odds of watching economic slowdown in China and the Japanese yen could gain benefits from this suffering to replace the Yuan as a an Asian reserve currency, while there is no signal from BOJ yet to take further easing steps.
Nikkei 225 has been negatively impacted by the Japanese yen appreciation this year which hurts the Japanese exporting activity.
While the common currency was facing increasing selling pressure because of the tame inflation pressure in EU which can lead to further stimulating measurements to be taken by the ECB which shocked the markets by lowering the deposit rate by only 0.1% to -0.3% last meeting on last Dec. 3 with no change of its QE.
Dec Germany preliminary CPI came last Monday to show rising by only 0.3% y/y, while the market was waiting for 0.6% increasing, after 0.4% in November and also EU CPI flash reading has shown yesterday rising by only 0.2% as the same as November, while the consensus was referring to increasing by 0.3%.
The market will be closely watching next the coming data from the US labor market this week which will start today with the release of US ADP Employment change.
Instrument in Focus: EURUSD
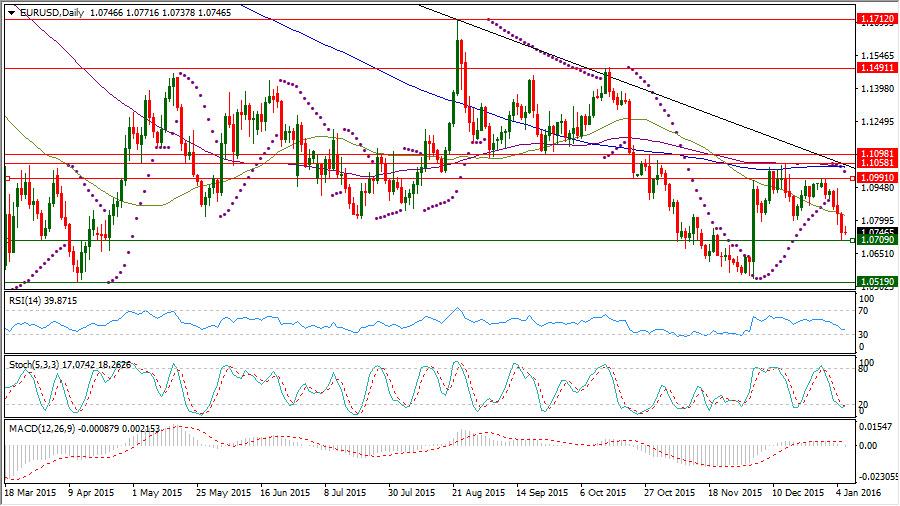
EURUSD slide below 1.0793 supporting level which could prop it up on last Dec. 7 caused increasing of the downside momentum drove the pair down to 1.0709, before re-stabilizing near 1.0750 during today Asian session.EURUSD daily Stochastic Oscillator (5, 3, 3) which is sensitive to the volatility is having now its main line in the oversold region below 20 reading 17.074 and also its signal line which is reading 18.262, despite the rebounding from 1.0709.
EURUSD dived again below its Daily SMA50 with continued existence below its daily SMA100 and daily MA200 and today is the fourth consecutive day of being below its daily Parabolic SAR (step 0.02, maximum 0.2) is reading now 1.1023, after 3 dark days.
Important levels: Daily MA50 @ 1.0823, Daily MA100 @ 1.0039 and Daily MA200 @ 1.0044
S&R:
S1: 1.0709
S2: 1.0519
S3: 1.0461
R1: 1.0991
R2: 1.1058
R3: 1.1093
EURUSD daily Chart:

Commodities: Brent Feb. 16
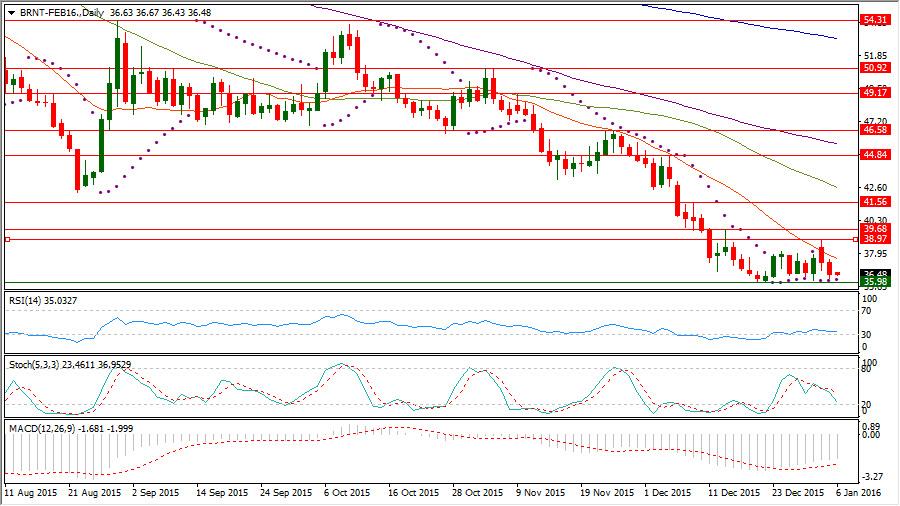
Brent Feb. 16 has come again under pressure with continued worries about the demand solidarity, after the economic slowdown signs from china and the weaker than expected manufacturing performance in US last month.Brent Feb. 16 which could capitalize on the Iranian Saudi rising tension because of Saudi Arabia’s execution of Saudi Shiite Cleric to reach $38.97 retreated again to be trading near $36.50 ahead of today release of US EIA Oil stockpile of the week ending on Jan. 1, after rising of US EIA Oil stockpile of the week ending on Dec. 25 by 2.629m to 487.409m weighed down on the oil prices, as the market was waiting for decreasing by 2.5m barrels.
Brent Feb. 16 could hardly form a base at $35.98, after increasing of the downside momentum following forming lower high at $39.68 on Dec. 15.
The slide from $39.68 could not be contained yet, as its rebound from $35.98 ended until now to forming another lower high at $38.97 to come down again for trading below its daily SMA20 with continued existence below its daily SMA50, SMA100 and SMA200.
Important levels: Daily SMA20 @ $37.61, Daily SMA50 @ $42.61, Daily SMA100 @ $45.65 and Daily SMA200 @ $52.99S&R:
S1: $35.98
S2: $35
S3: $34.19
R1: $38.97
R2: $39.68
R3: $41.56
Brent Feb. 16 Daily chart
Hot instrument: EURJPY
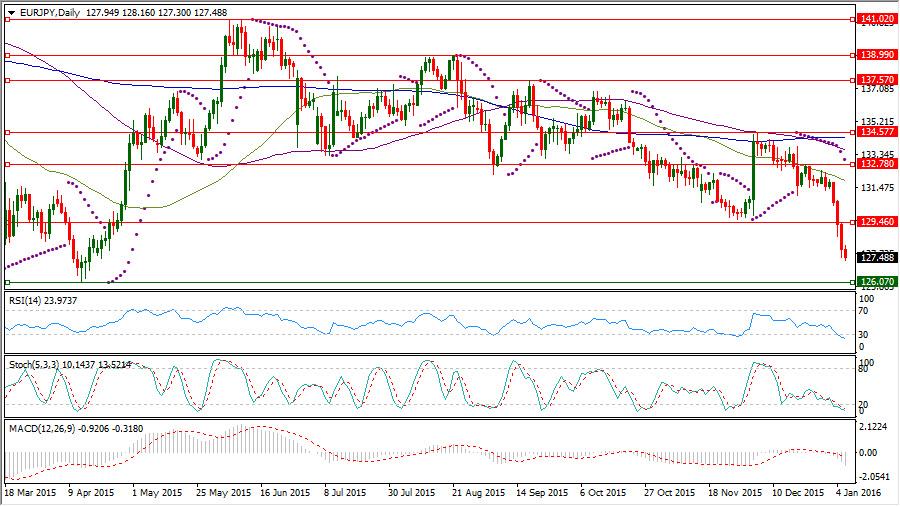
After forming a lower top at 134.57 on last Dec. 4, EURJPY started to set back again, before watching increasing of the downside momentum significantly this week by breaking of 130 psychological level which opened the door for breaking 129.65 supporting level which could prop up this pair on last Nov. 27, before residing now for trading near 127.50EURJPY sever slide leaded its daily Stochastic Oscillator (5, 3, 3) which is sensitive to the volatility to have now its main line in the oversold region below 20 reading 10.143 and also its signal line which is reading 13.521.
Important levels: Daily MA50 @ 131.84, Daily MA100 @ 133.57 and Daily MA200 @ 134.30
S&R:
S1: 126.07
S2: 124.89
S3: 119.09
R1: 129.46
R2: 132.78
R3: 134.57
EURJPY Daily chart

Recommended Content
Editors’ Picks
EUR/USD regains traction, recovers above 1.0700

EUR/USD regained its traction and turned positive on the day above 1.0700 in the American session. The US Dollar struggles to preserve its strength after the data from the US showed that the economy grew at a softer pace than expected in Q1.
GBP/USD returns to 1.2500 area in volatile session

GBP/USD reversed its direction and recovered to 1.2500 after falling to the 1.2450 area earlier in the day. Although markets remain risk-averse, the US Dollar struggles to find demand following the disappointing GDP data.
Gold climbs above $2,340 following earlier drop

Gold fell below $2,320 in the early American session as US yields shot higher after the data showed a significant increase in the US GDP price deflator in Q1. With safe-haven flows dominating the markets, however, XAU/USD reversed its direction and rose above $2,340.
XRP extends its decline, crypto experts comment on Ripple stablecoin and benefits for XRP Ledger

Ripple extends decline to $0.52 on Thursday, wipes out weekly gains. Crypto expert asks Ripple CTO how the stablecoin will benefit the XRP Ledger and native token XRP.
After the US close, it’s the Tokyo CPI

After the US close, it’s the Tokyo CPI, a reliable indicator of the national number and then the BoJ policy announcement. Tokyo CPI ex food and energy in Japan was a rise to 2.90% in March from 2.50%.
