EUR/USD
Moving lower.
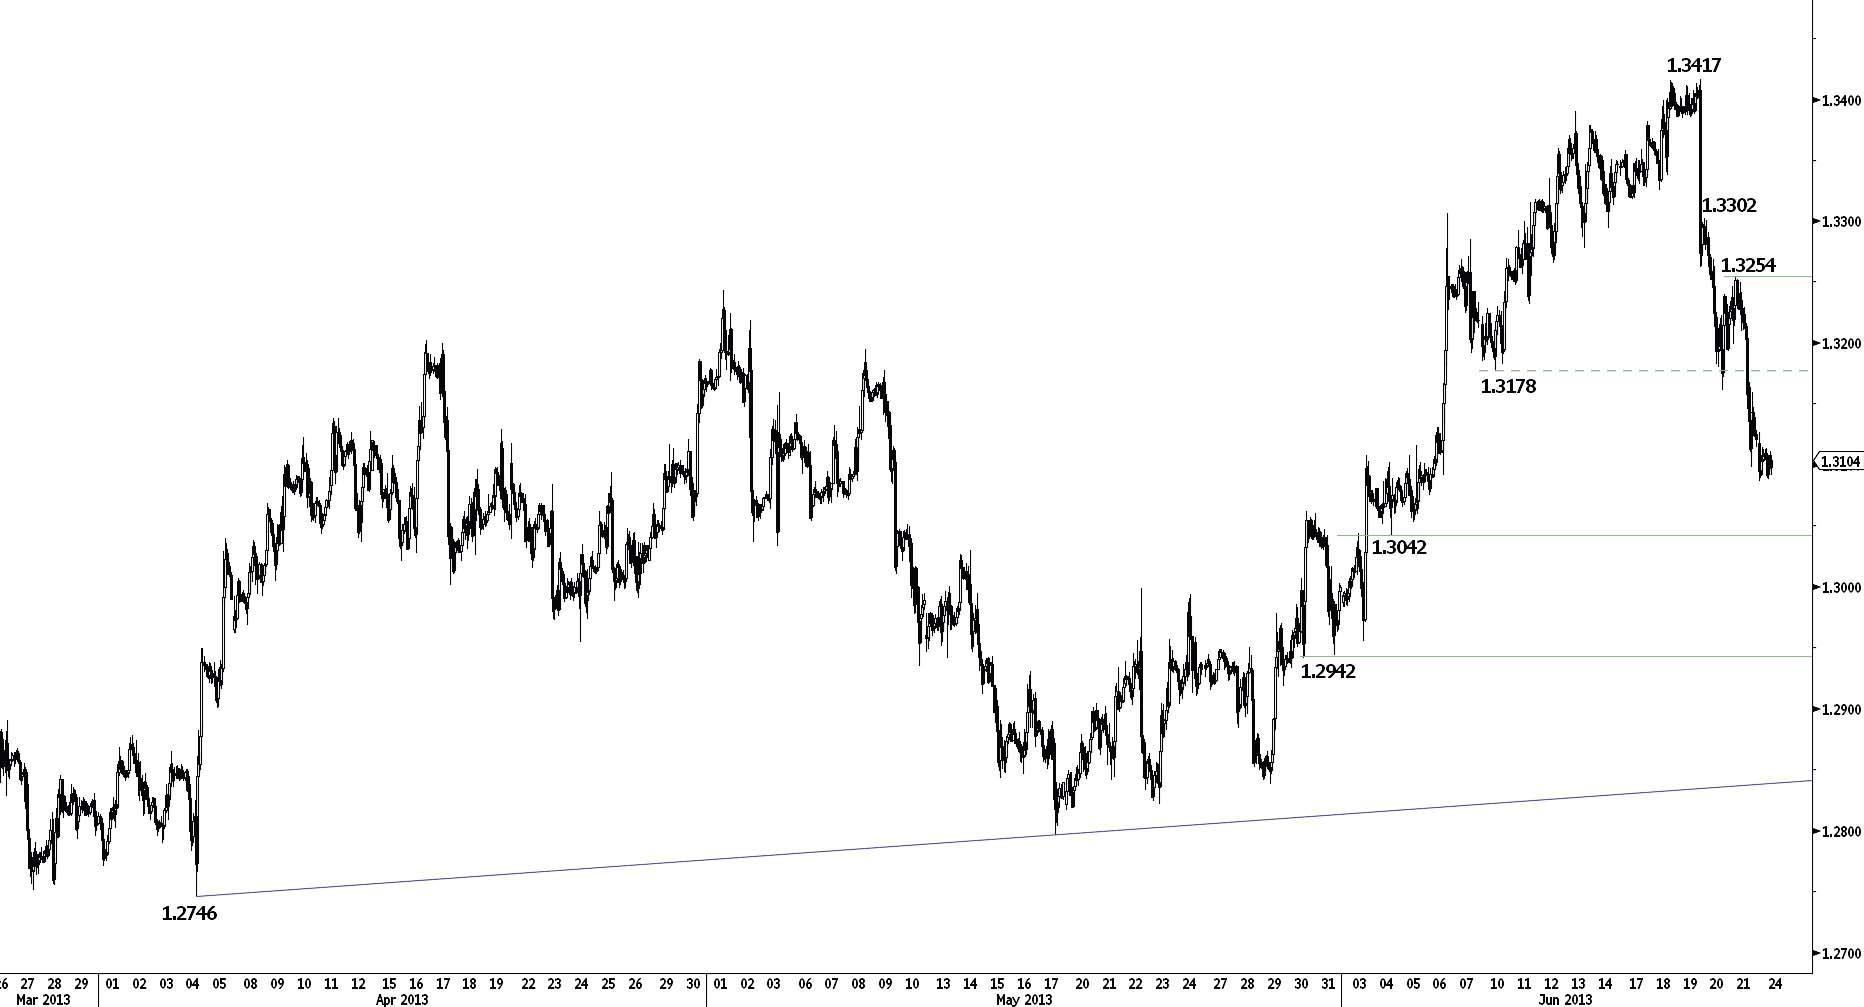
EUR/USD continues to decline from its high at 1.3417. An hourly resistance is at 1.3159 (intraday high). Another resistance can be found at 1.3254. Supports lie at 1.3042 and 1.2942.
In the medium-term, the recent price action from 1.2746 (04/04/2013 low) is viewed as a corrective phase within a larger downtrend. The high at 1.3417 (19/06/2013 high) following Bernanke's comments is a significant top. Coupled with the short-term overbought conditions, a new bearish phase is likely underway. A minimum move towards the support at 1.2797 (17/05/2013 low) is expected.
Await fresh signal.
GBP/USD
Pushing lower.
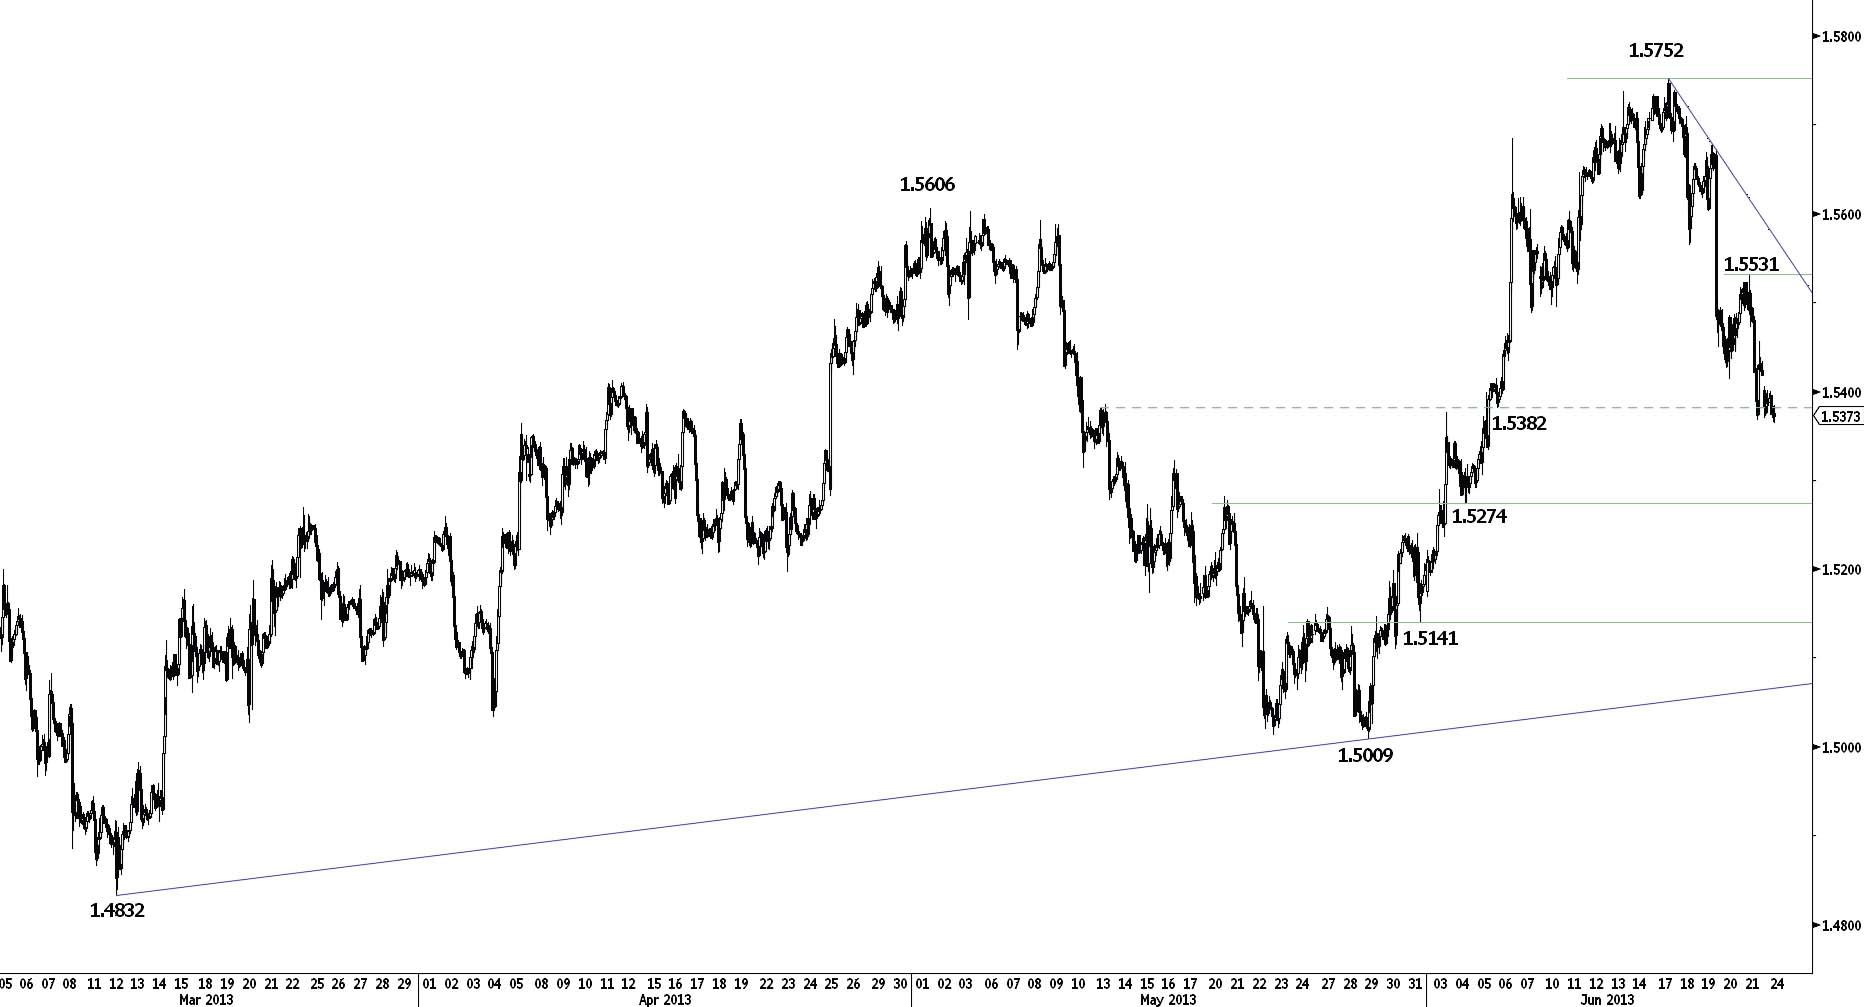
GBP/USD is making new lows. Supports are now at 1.5274 and 1.5141. An hourly resistance can be found at 1.5456 (intraday high). Another resistance lies at 1.5531 (see also the declining trendline).
We are removing our short strategy, as it is not consistent anymore with the current price configuration.
In the longer-term, the break of the horizontal range defined by the strong support at 1.5235 (13/01/2012 low) and the strong resistance at 1.6302 (30/04/2012 high) calls for a further medium-term decline. The weakness from the top at 1.5752, coupled with short-term overbought conditions, call for a new phase of weakness. A test of the support at 1.5009 (29/05/2013 low) is expected at the very least.
Await fresh signal.
USD/JPY
Approaching a key resistance at 99.28.
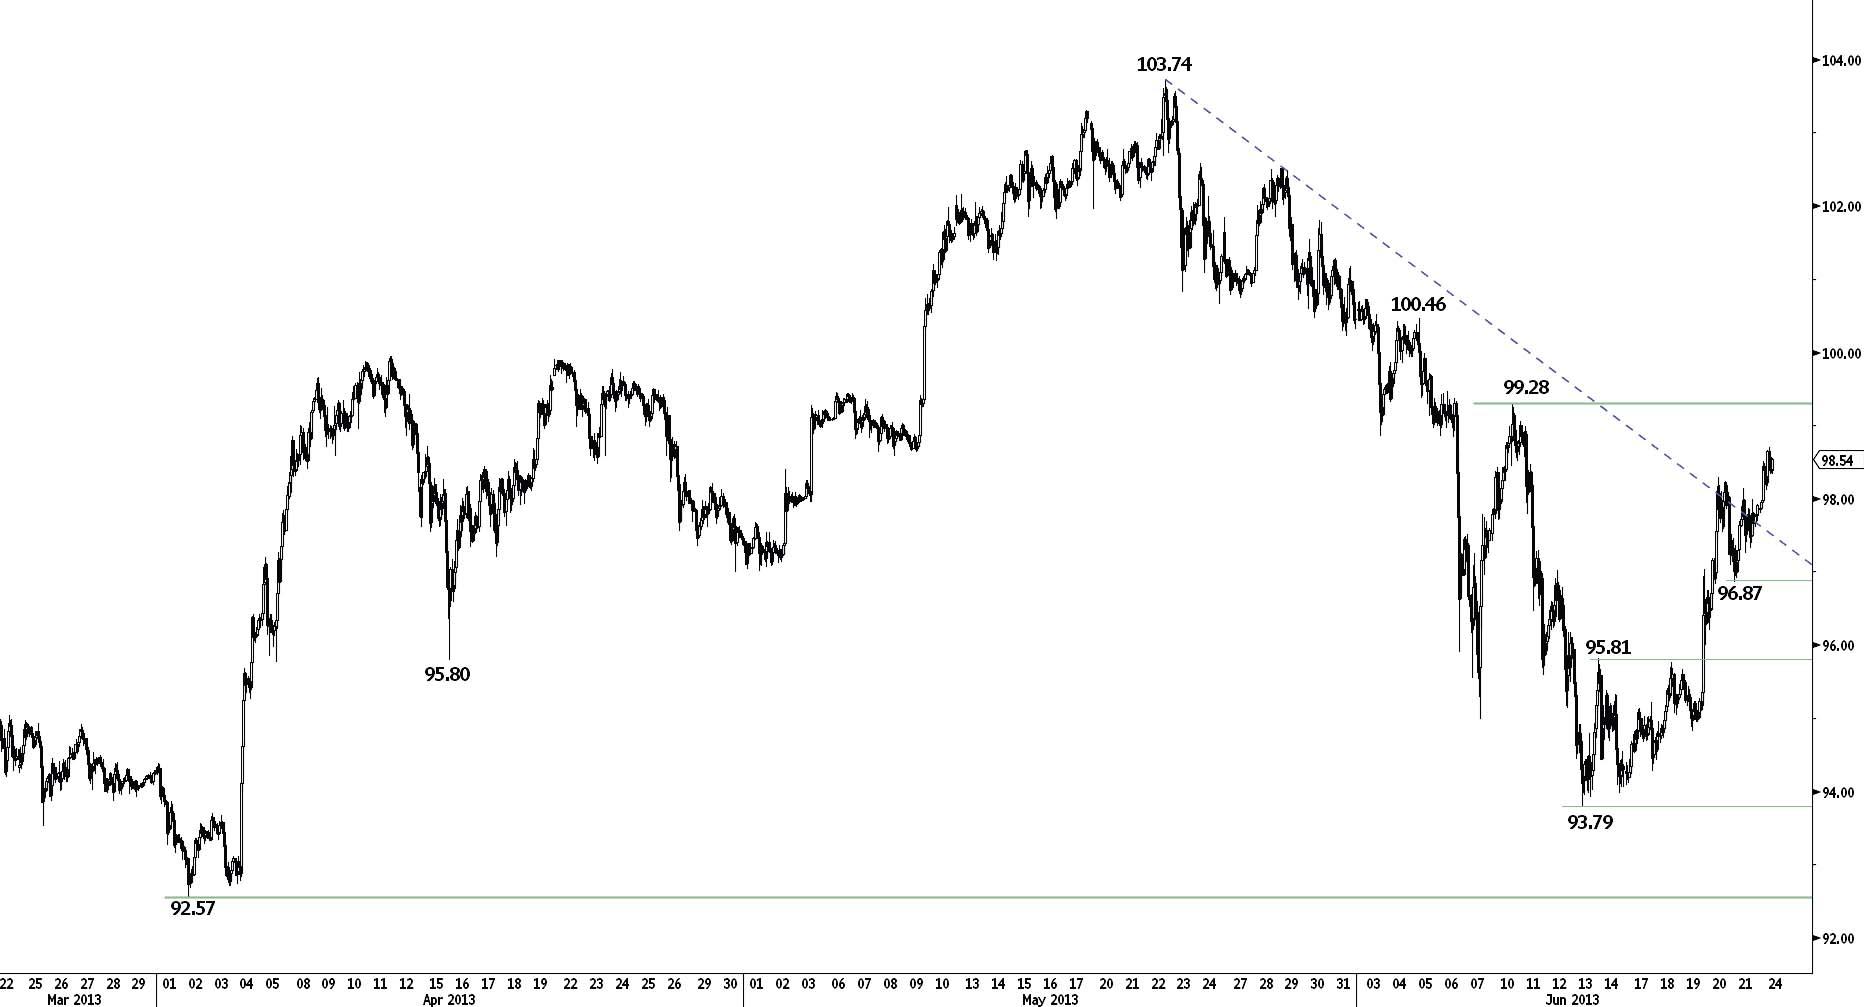
USD/JPY has broken the resistance implied by the declining trendline. A key resistance lies at 99.28. Hourly supports can be found at 97.99 (intraday high) and 96.87.
The medium-term overextended nature of this market calls for some caution. However, the recent buying interest from the low at 93.79 suggests a limited downside risk. Monitor the resistances at 99.28 and 100.46.
Await fresh signal.
USD/CHF
Approaching the resistance at 0.9419.
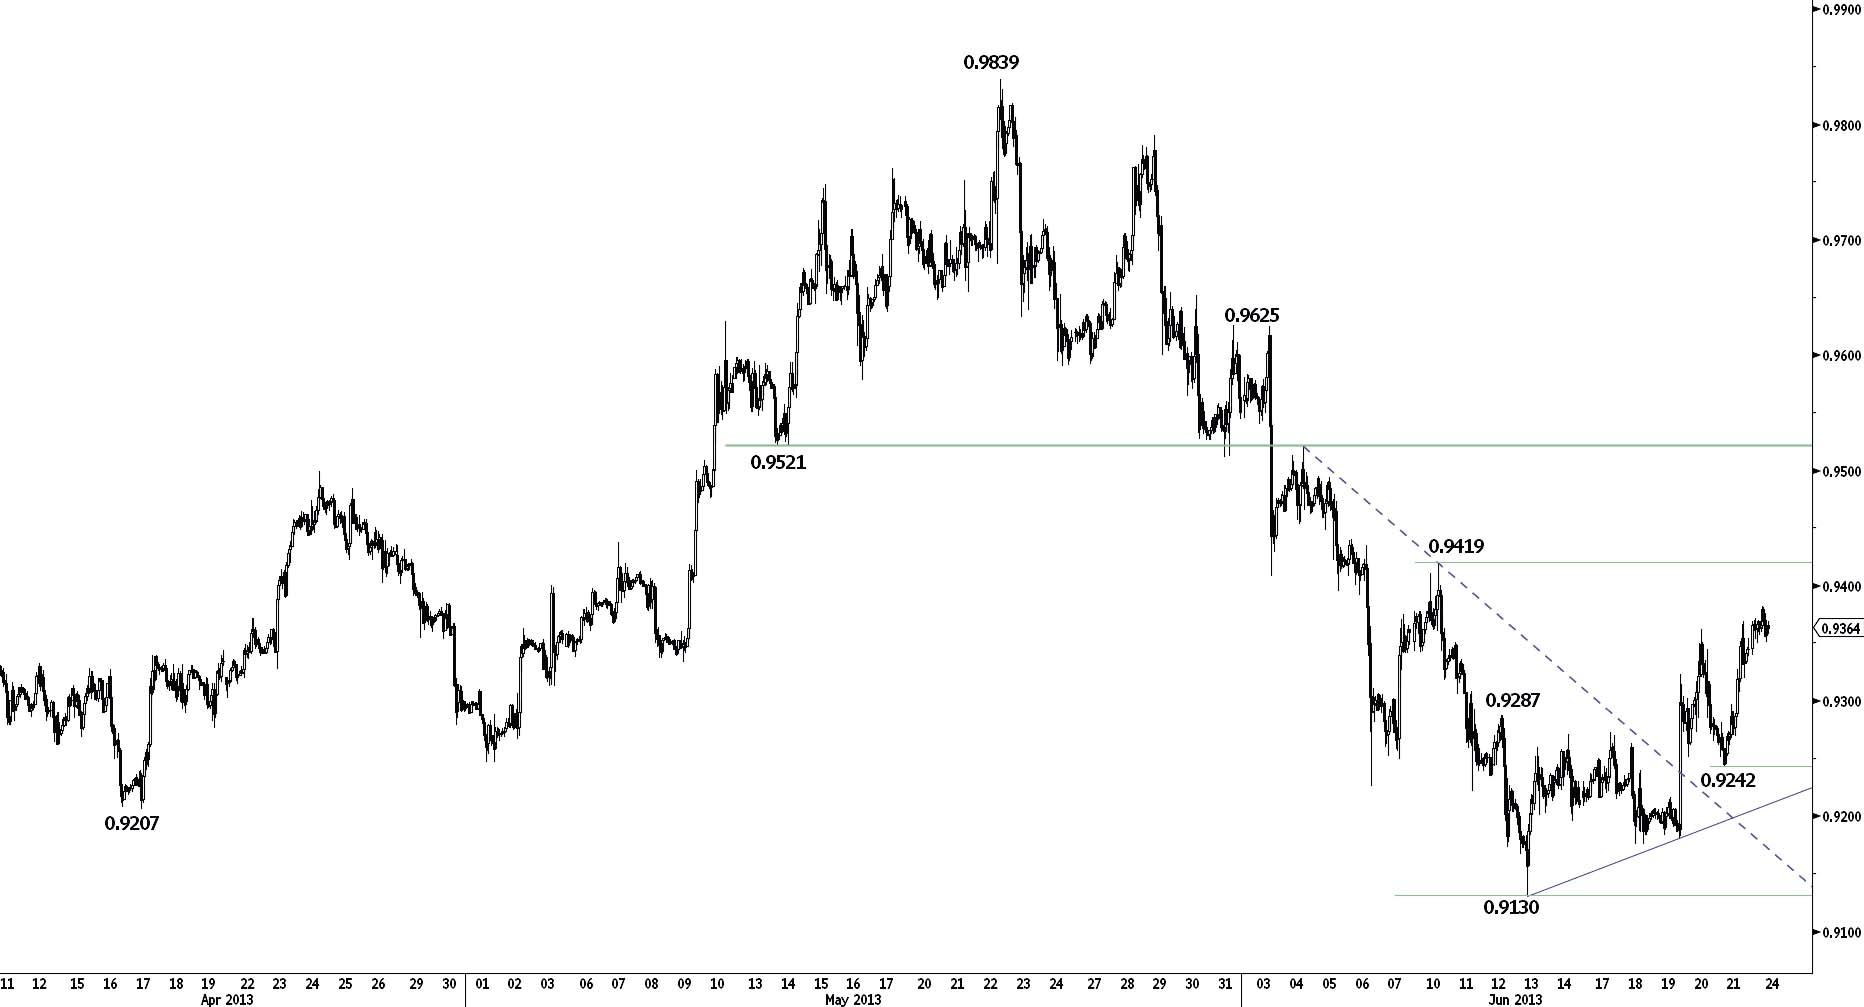
USD/CHF's bounce gained some upside momentum last Friday. Monitor the resistance at 0.9419. Another resistance lies at 0.9521. Hourly supports lie at 0.9242 and 0.9176 (18/06/2013 low).
In the longer-tern, a medium-term sideways move between the key supports at 0.9022 (01/02/2013 low) and 0.8931 (24/02/2012 low) and the key resistances at 0.9972 (24/07/2012 high) and 1.0067 (01/12/2010 high) is expected. Given the short-term overextended decline, a new phase of strength is likely in the next weeks.
Await fresh signal.
USD/CAD
The key resistance at 1.0447 has been breached.
USD/CAD continues to rise sharply, moving above the key resistance area between 1.0421 (29/05/2013 high) and 1.0447 (04/06/2012 high). Hourly supports are at 1.0440 (intraday low) and 1.0363 (21/06/2013 low).
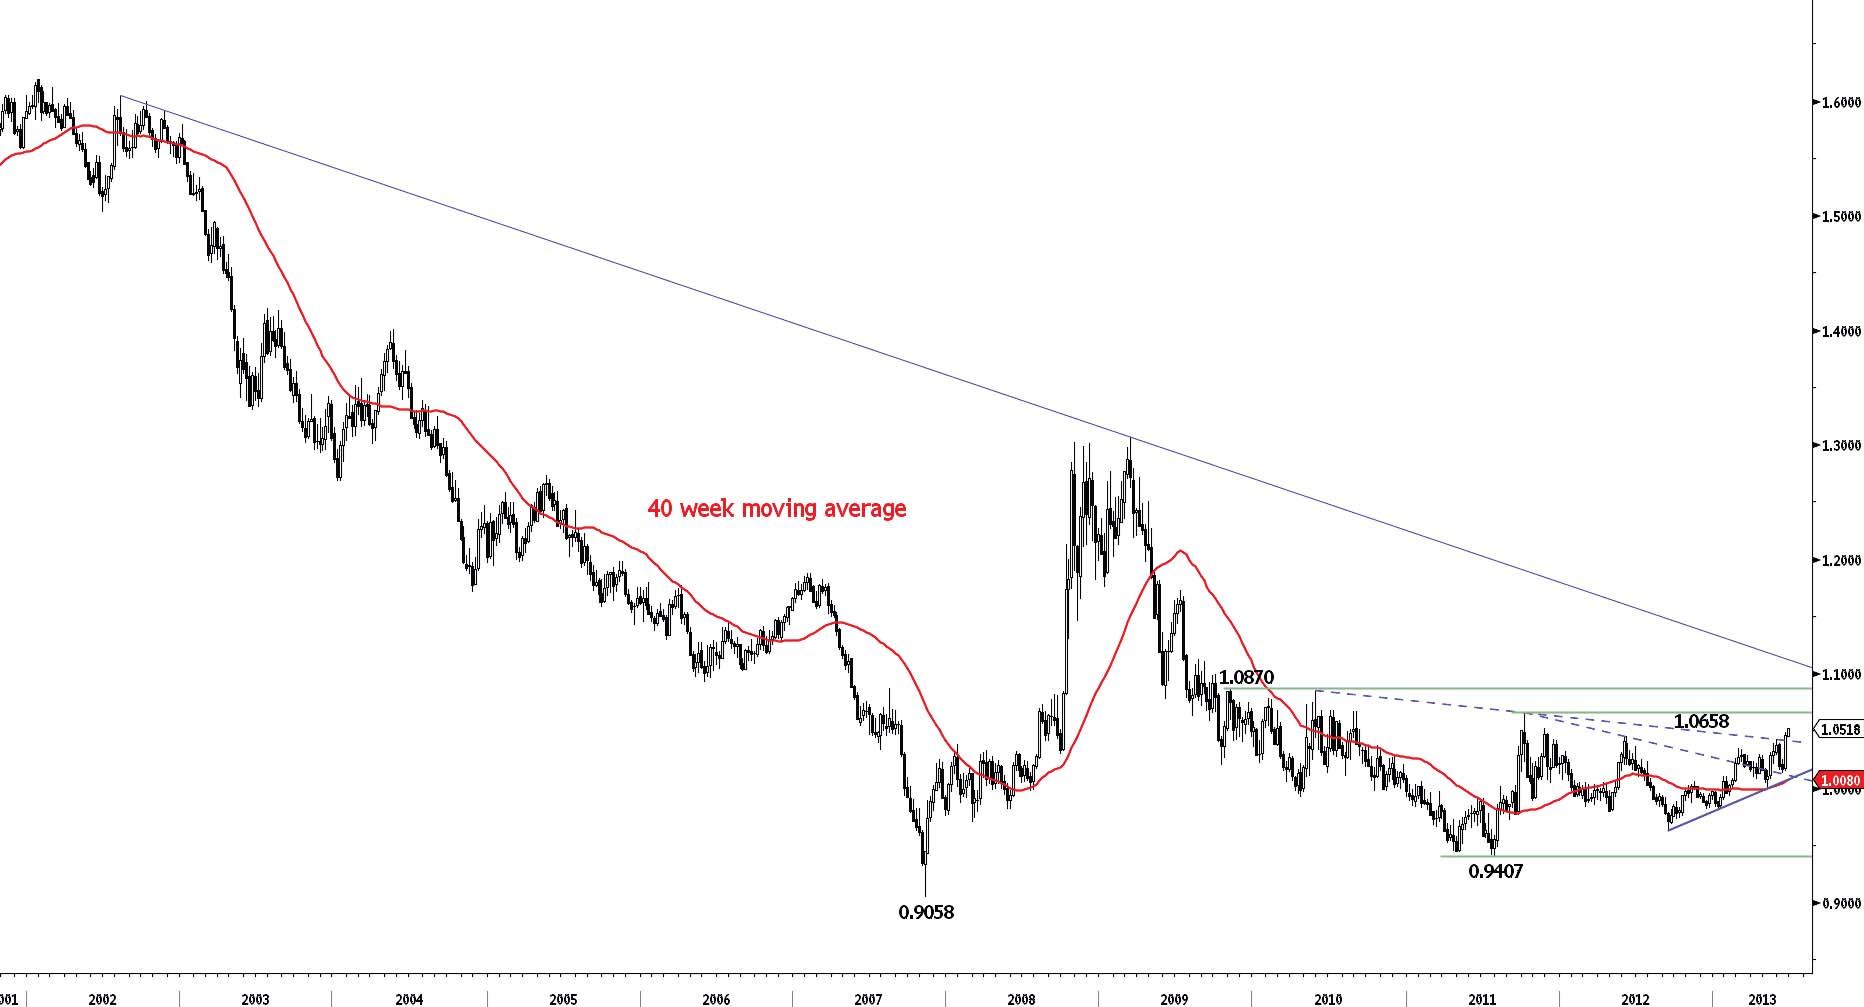
In the longer-term, the technical improvements (see broken declining trendlines) calls for a test of the long-term declining trendline (see also the key resistance at 1.0870 (02/11/2009 high)). We favour a bullish bias as long as the support at 1.0137 (14/06/2013 low, see also the rising trendline from 0.9633 (14/09/2012 low) in a daily chart) holds. An initial key resistance lies at 1.0658 (04/10/2011 high).
Following strategy constraints, we had to close our long strategy for profits.
Our strategy has been stopped for profits.
AUD/USD
Challenging its recent low.
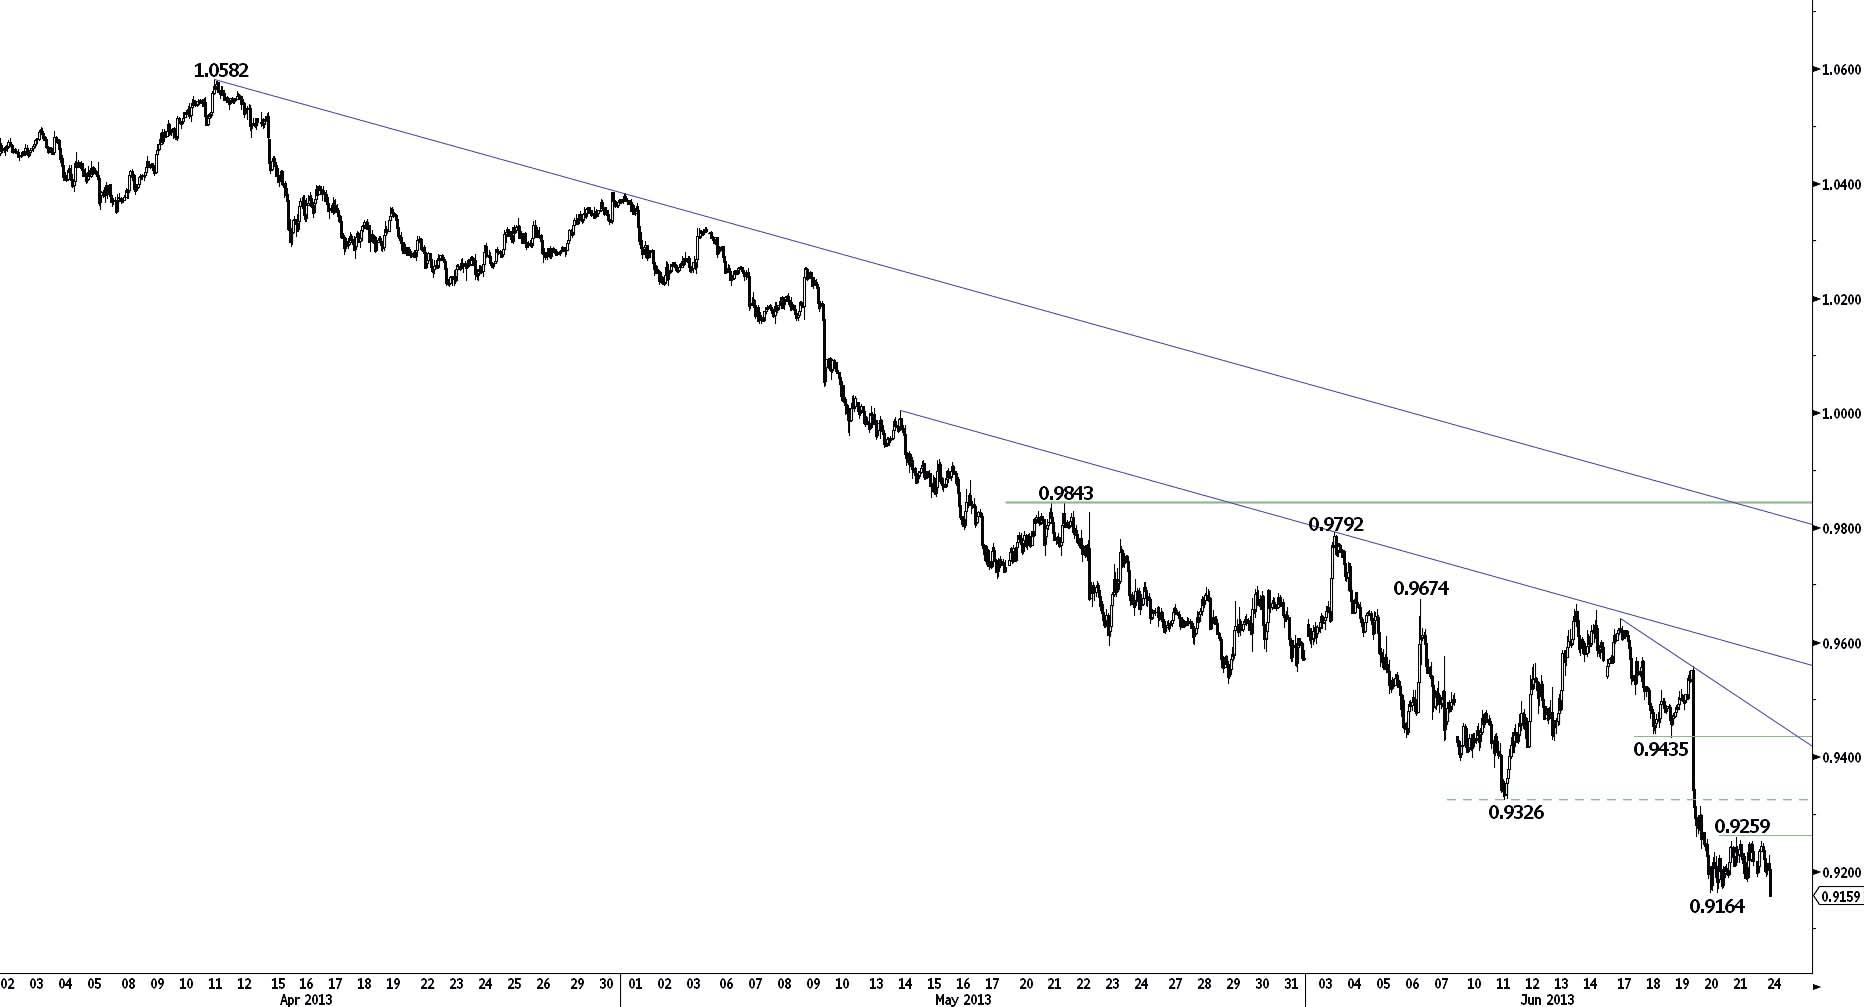
AUD/USD is challenging its recent low at 0.9164. Hourly resistances are at 0.9259 and 0.9313 (20/06/2013 high).
In the medium-term, the break of the key support at 0.9388 (04/10/2011 low) opens the way for a further medium-term decline. The break to the downside out of the long-term symmetrical triangle (see the daily chart) suggests a move towards 0.8236. Key supports are at 0.8771 and 0.8067.
Short 2 at 0.9321, Objs: 0.8820/0.8332, Stop: 0.9321 (Entered: 2013-06-19).
GBP/JPY
Challenging the resistance at 152.03.
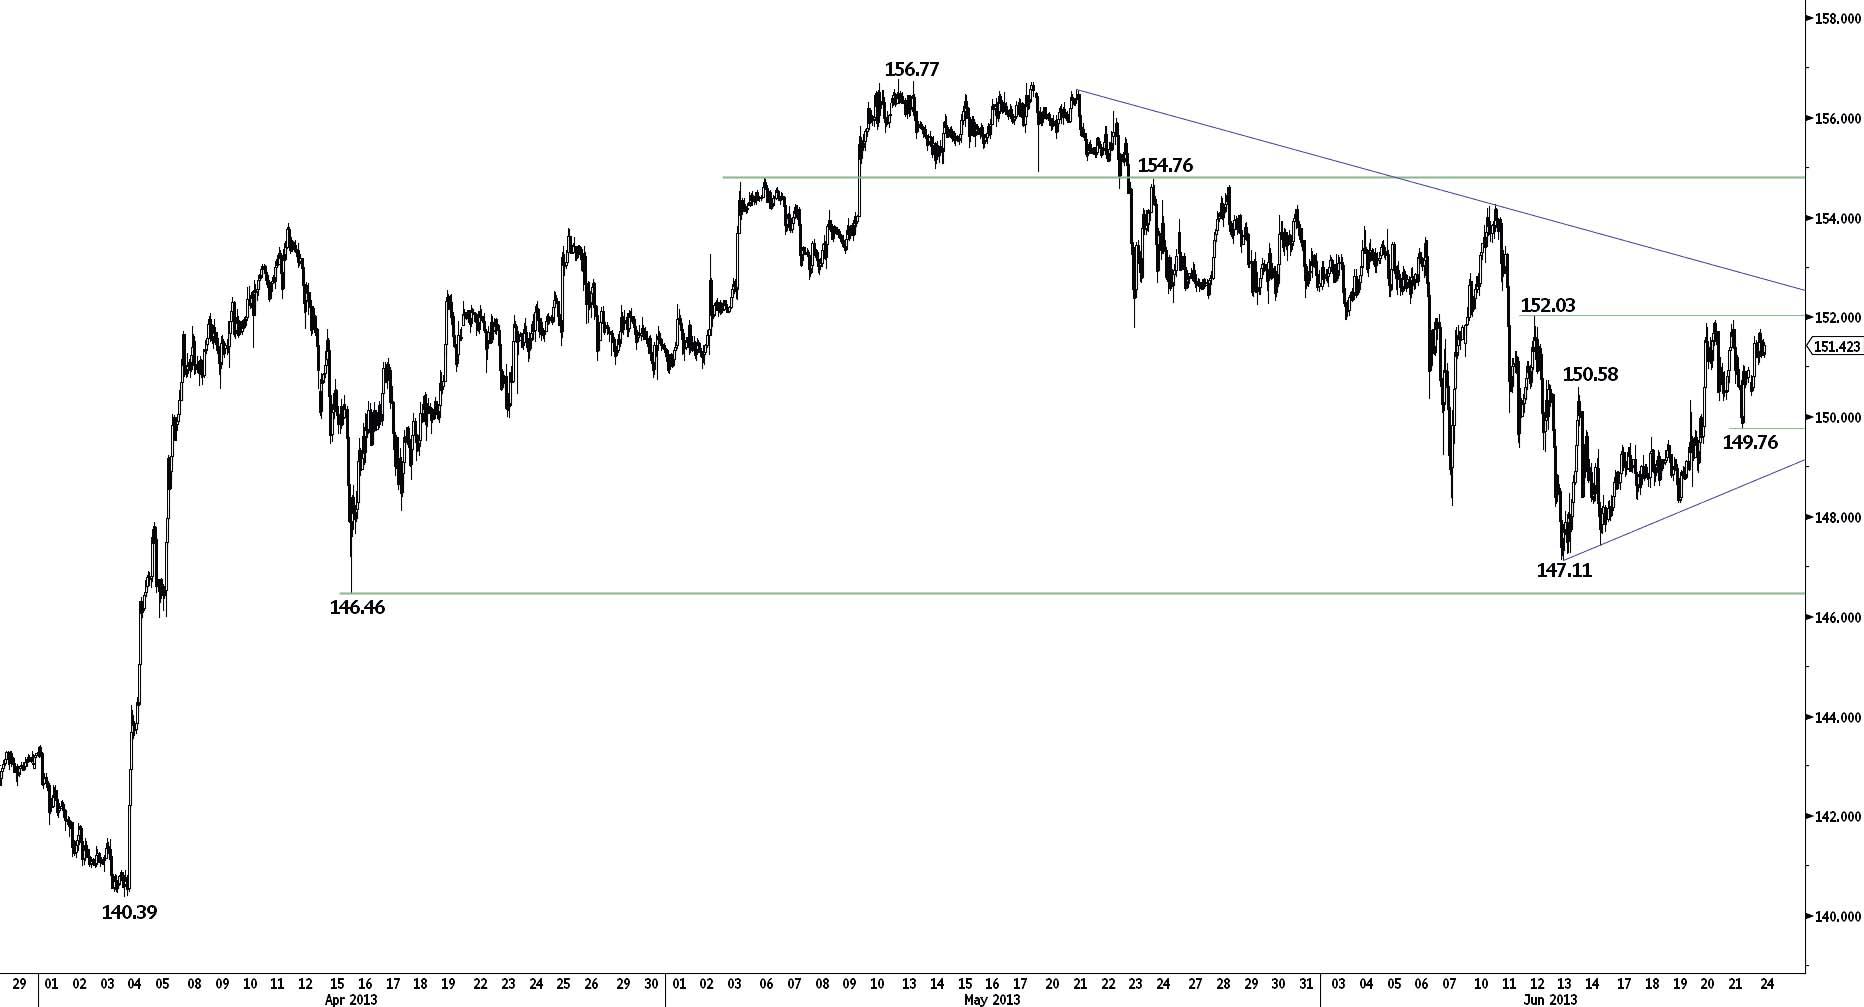
GBP/JPY is challenging the resistance at 152.03. Another resistance is given by the declining trendline (around 152.75). Hourly supports are given by 149.76 and the rising trendline (around 148.85).
In the longer-term, further strength towards the strong resistance at 163.09 (07/08/2009) is likely as long as the key support area between 146.46 (16/04/2013 low) and 145.88 (15/03/2013 high) holds. We do not expect a break of this resistance in the coming months though.
Await fresh signal.
EUR/JPY
Challenging its declining trendline.
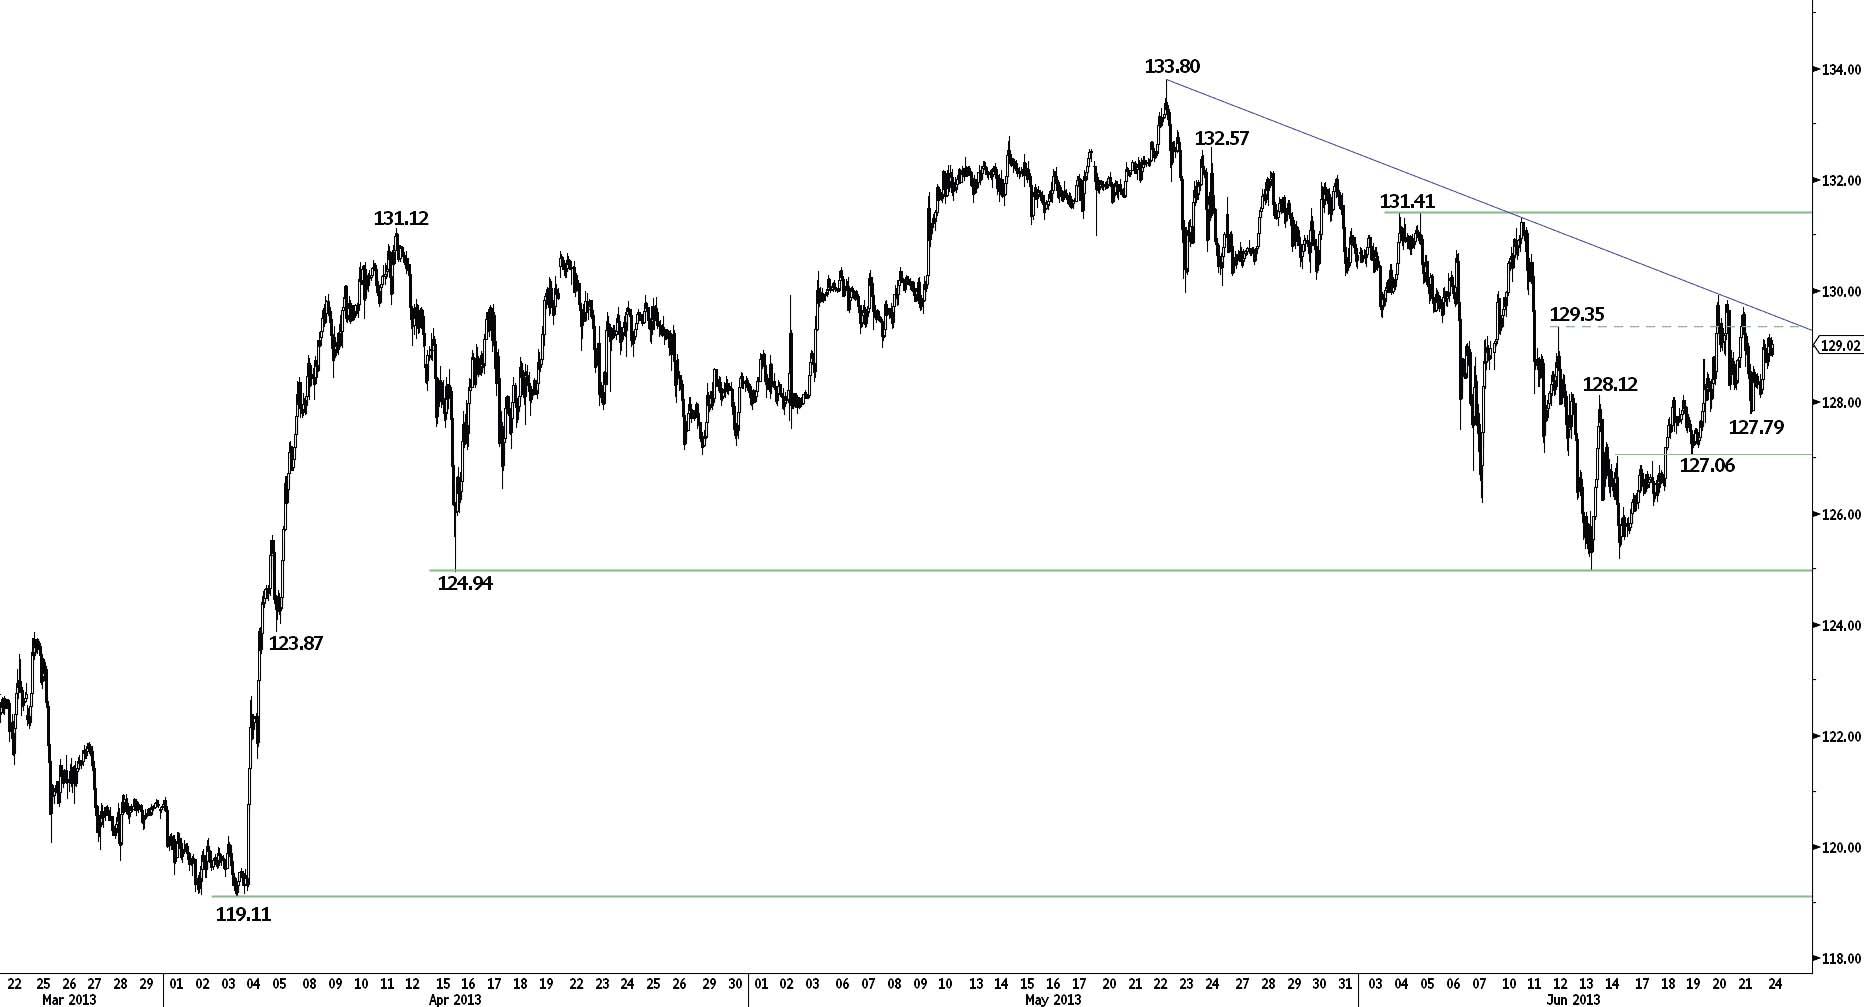
EUR/JPY has broken the resistance at 128.12, validating an hourly double-bottom. A move towards the key resistance at 131.41 is likely. Monitor the test of the declining trendline (around 129.55). Hourly supports are at 127.79 and 127.06.
In the longer-term, further strength towards the strong resistance at 139.22 (05/06/2009 high) is likely as long as the support at 124.94 (16/04/2013 low) holds. We do not expect a break of this resistance in the coming months though.
Await fresh signal.
EUR/GBP
Monitor the short-term rising trendline.
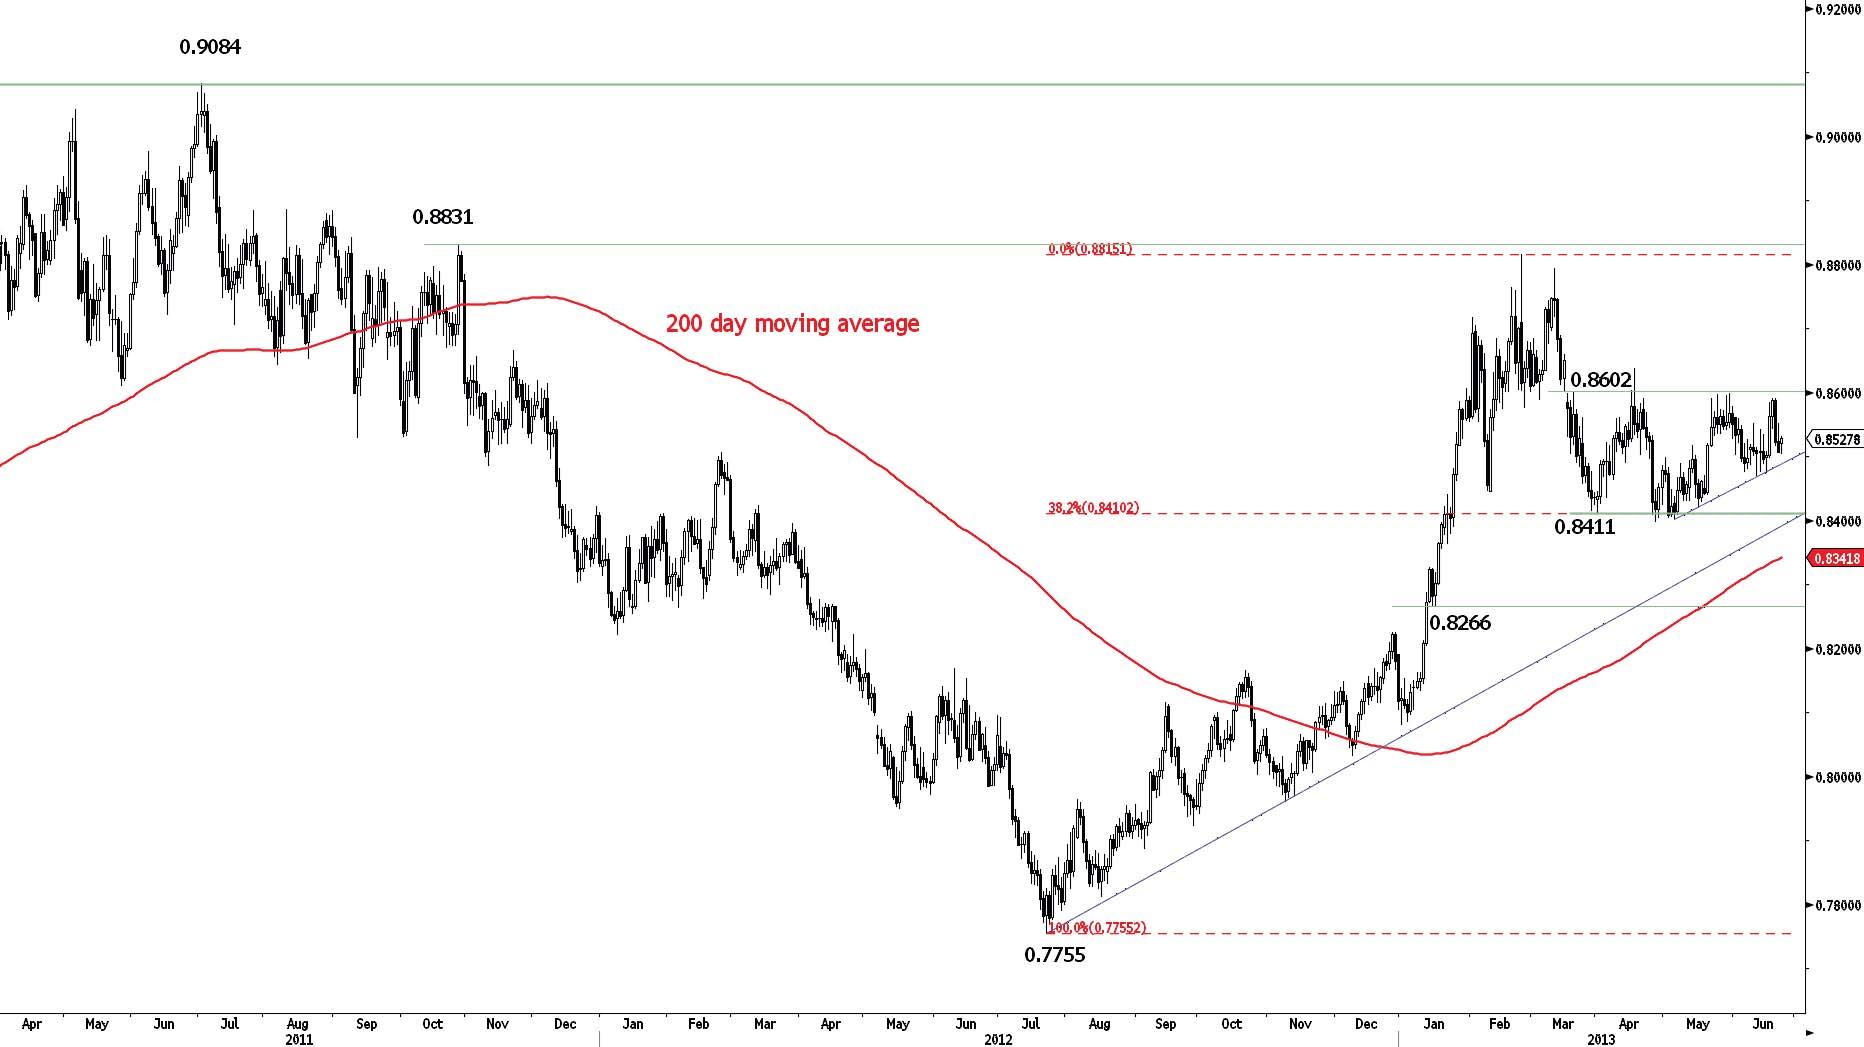
EUR/GBP has faded near its key resistance at 0.8599 (30/05/2013 high). However, the shortterm rising trendline has thus far acted as support. An initial support lies at 0.8504 (intraday low). An hourly resistance is at 0.8553 (intraday high).
From a longer-term perspective, the recent inability to make any significant new lows below the support at 0.8411 and the break of the shortterm declining trendline favour a base formation. Therefore monitor the resistance area between 0.8597 (24/05/2013 high) and 0.8637 (17/04/2013 high).
Buy stop 3 at 0.8602, Objs: 0.8645/0.8776/0.8990, Stop: 0.8559.
EUR/CHF
Moving sideways.
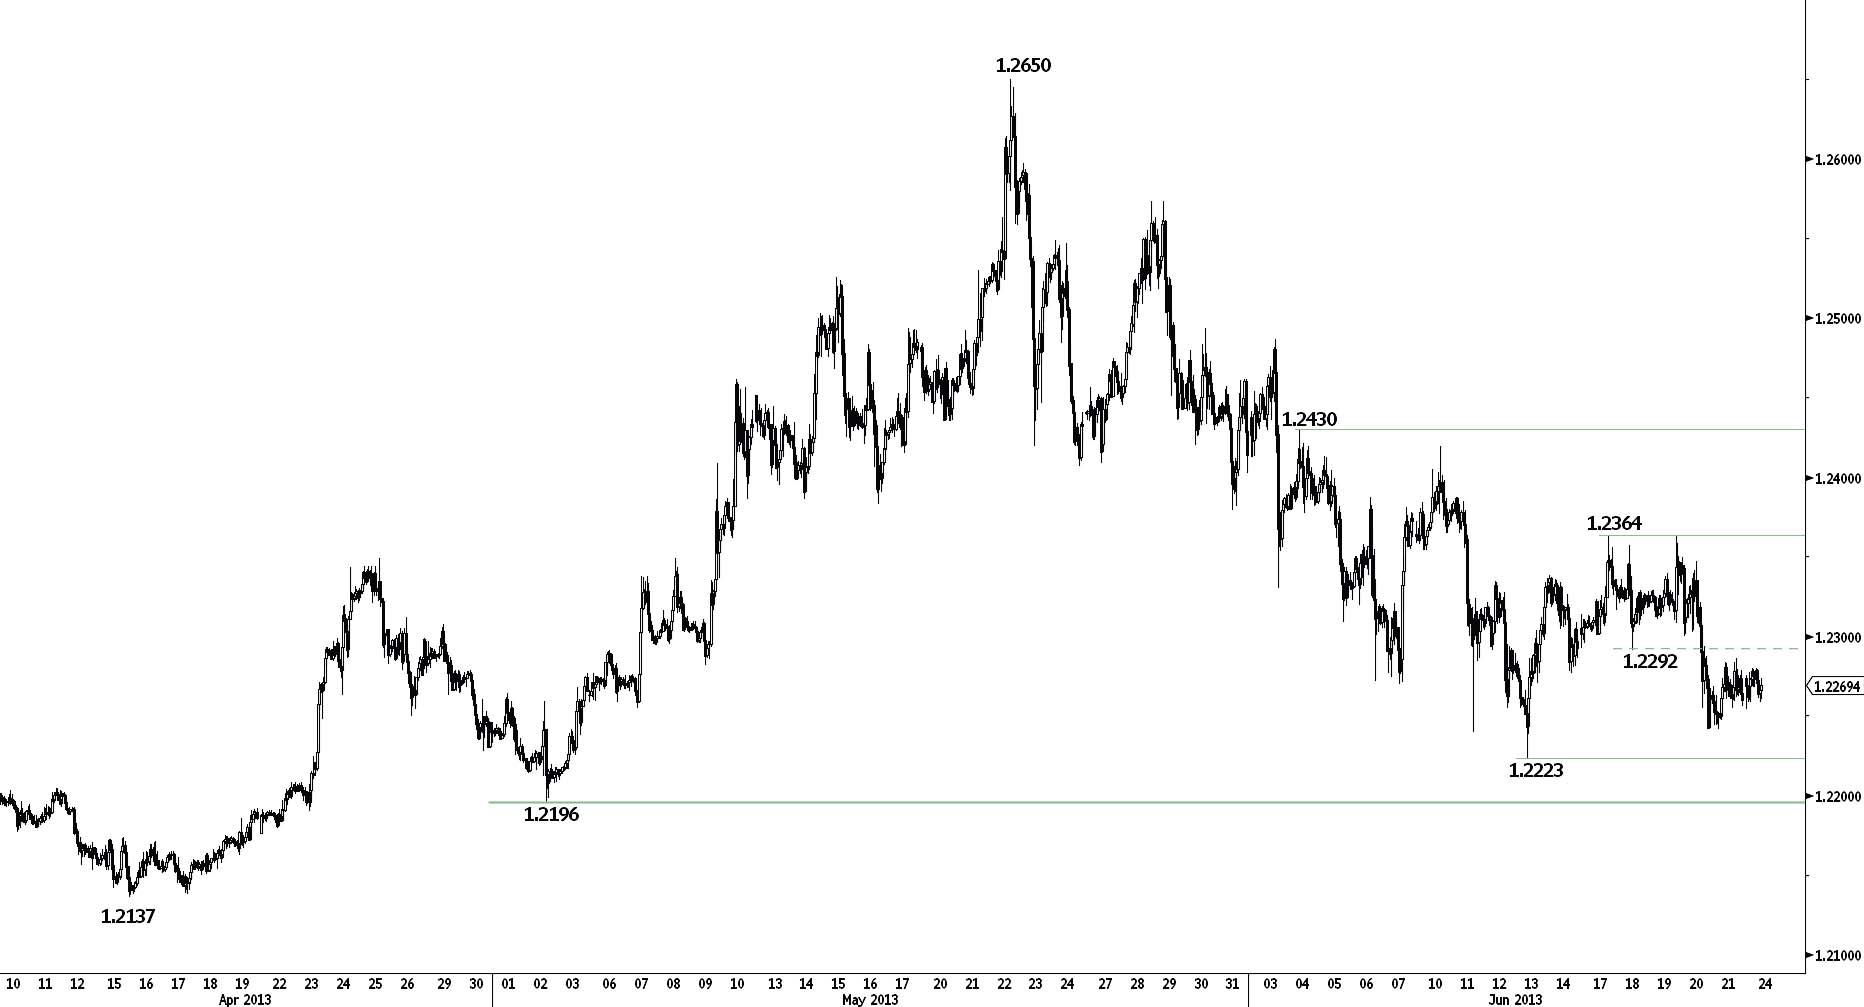
EUR/CHF is moving sideways between the support at 1.2223 and the resistance at 1.2364. An initial resistance can be found at 1.2301 (intraday low).
In September 2011, the SNB put a floor at 1.2000 in EUR/CHF, which is expected to hold in the medium-term. We generally favour further longer-term upside for EUR/CHF towards the psychological threshold at 1.30.
Long 3 at 1.2329, Objs: 1.2660/1.2985/1.3195, Stop: 1.1998 (Entered: 2013-01-23).
GOLD
Weak bounce thus far.
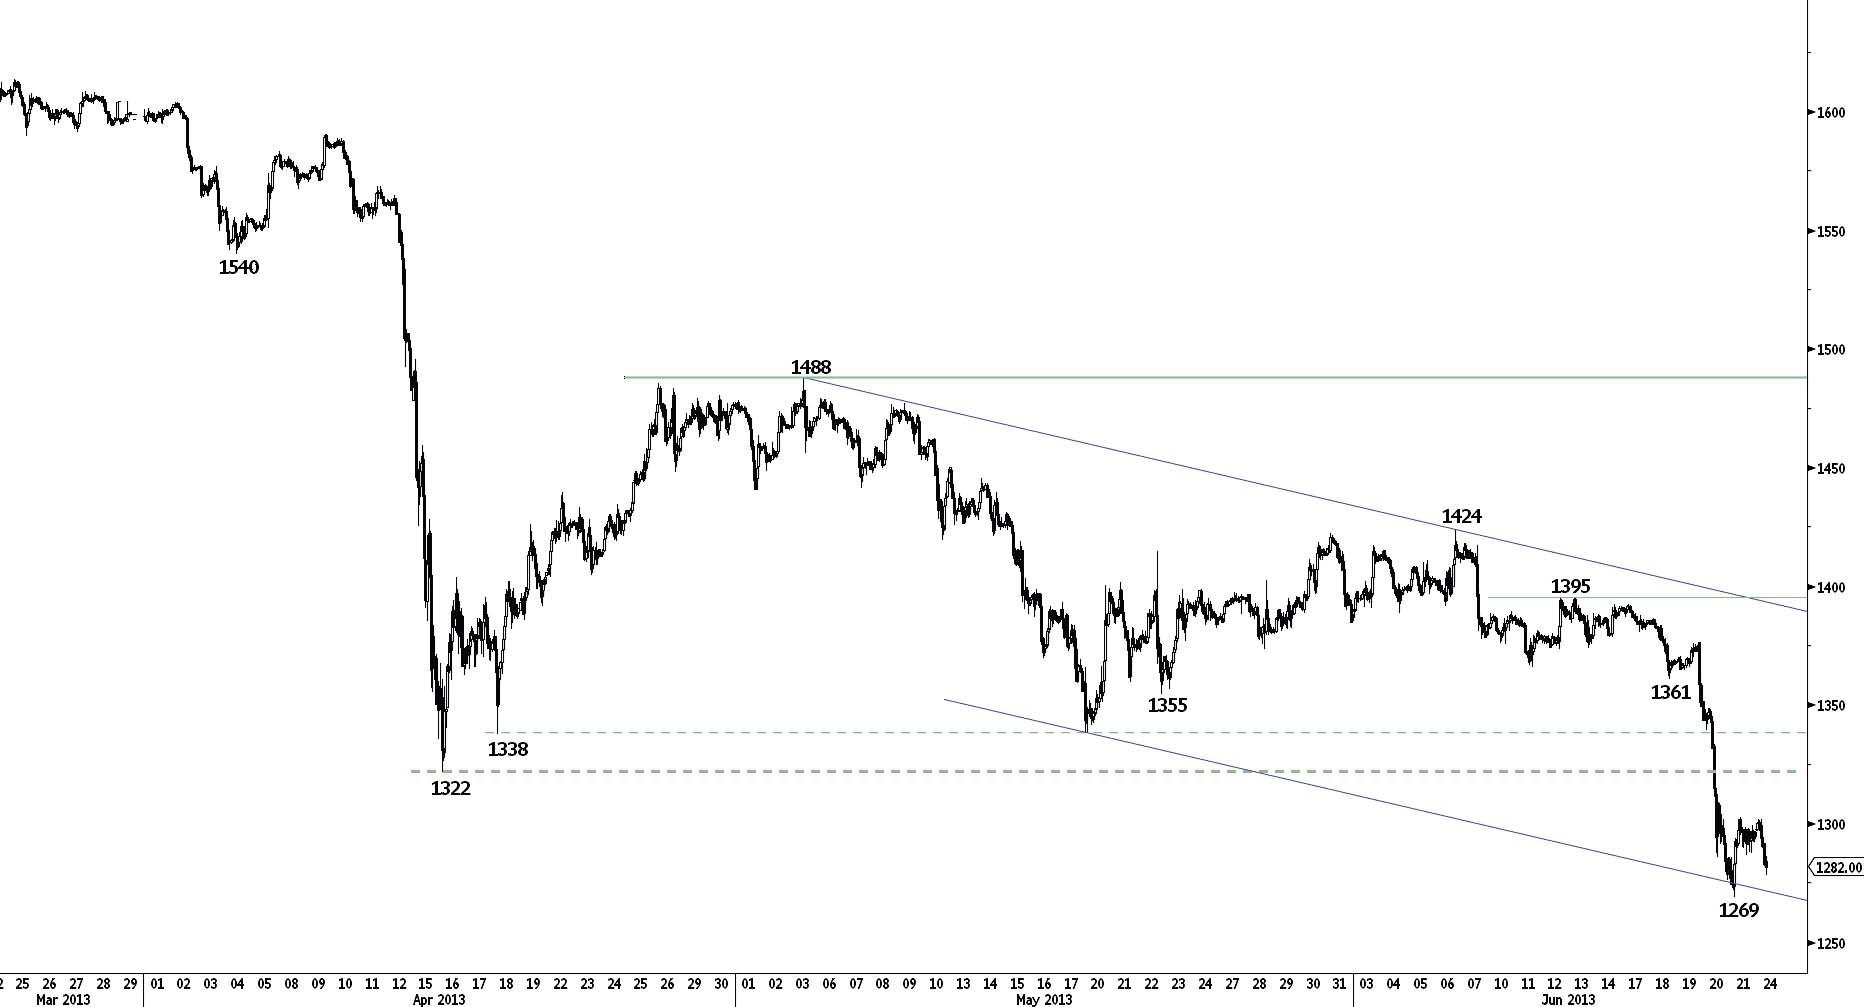
Gold has broken its key support at 1322, making fresh 2.5 years lows. The recent bounce has created an hourly support at 1269. An hourly resistance is at 1309 (intraday high). The shortterm technical configuration is negative as long as prices remain below the resistance at 1322.
In the medium-term, gold reached the implied downside risk at 1287 implied by the break of the long-term horizontal range defined by the support at 1523 (29/12/2011 low) and the resistance at 1803 (08/11/2011 high). A key support can be found at 1157 (28/07/2010 low).
Await fresh signal.
SILVER
Challenging the key support at 19.48.
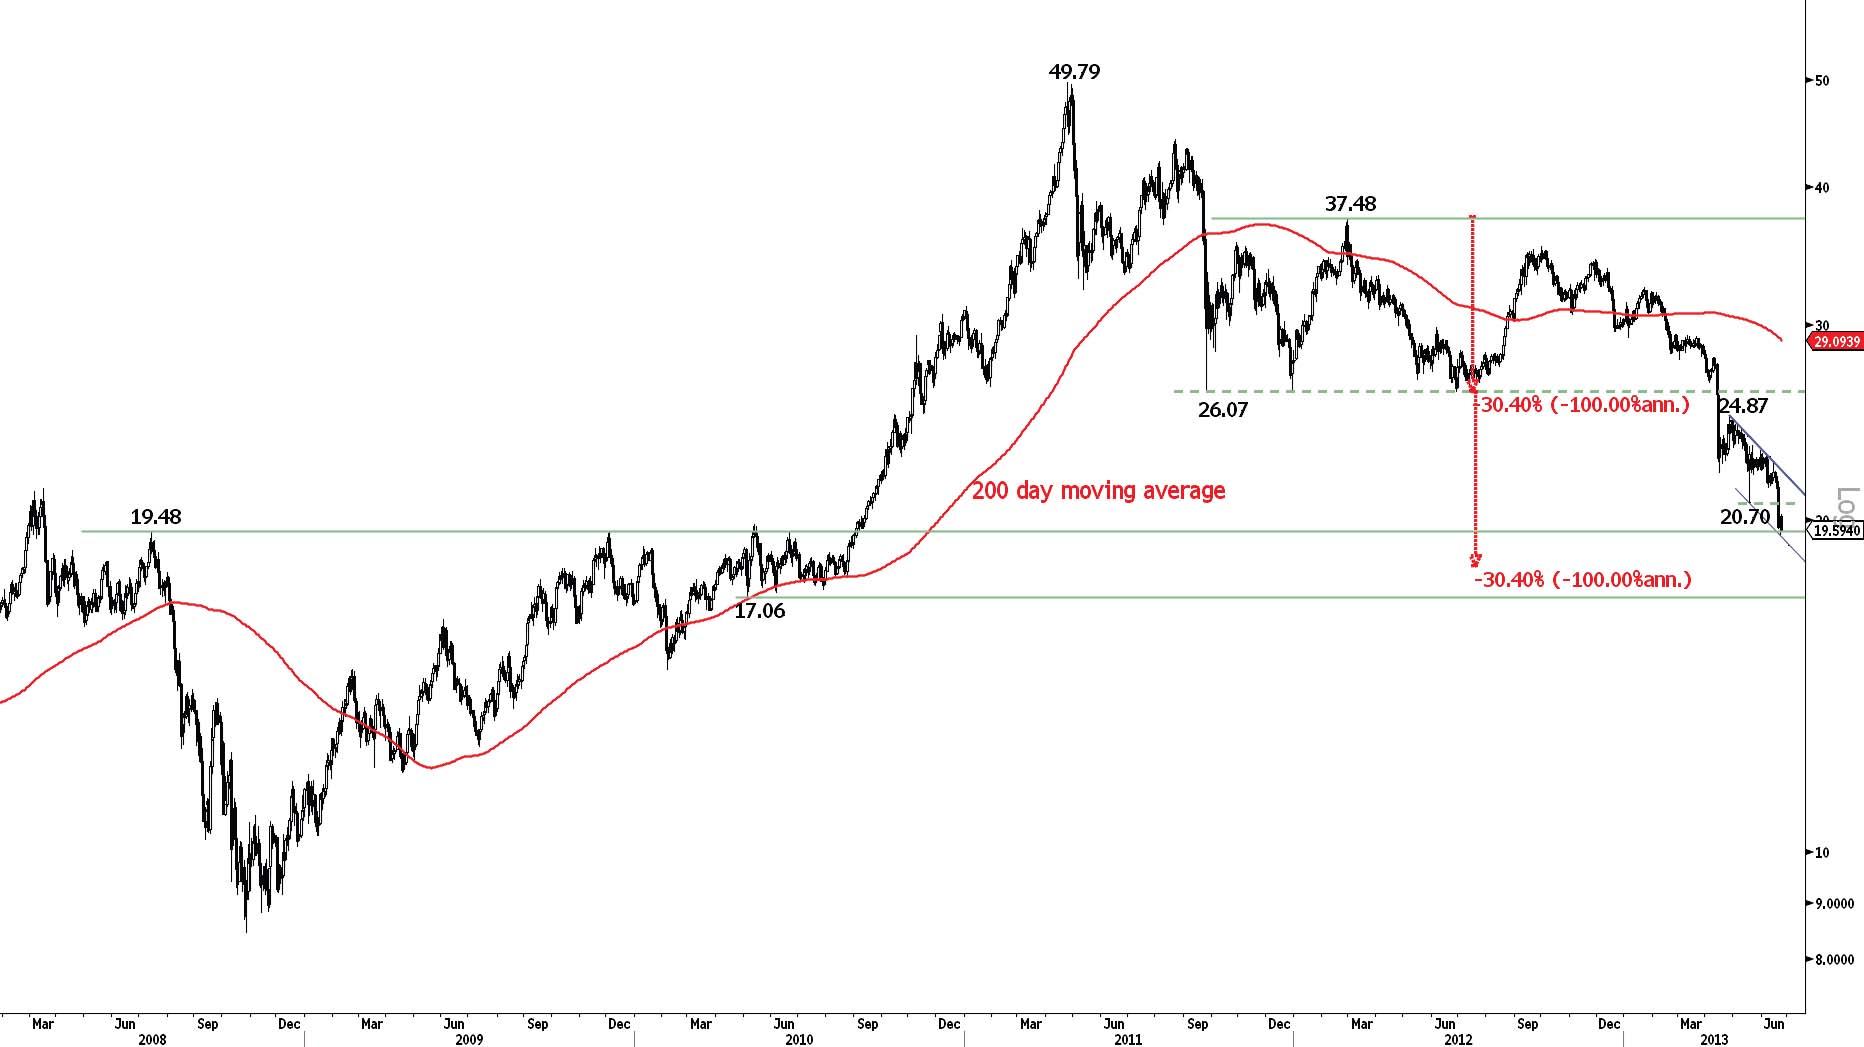
Silver has broken the key support at 20.70, which opens the way for a further decline. Hourly resistances can be found at 20.24 (intraday high) and 20.70.
In the medium-term, the downside risk implied by the break of the strong support at 26.07 (26/09/2011 low) is 18.13 (see red arrows). Monitor the test of the key support at 19.48 (15/07/2008 high). Another significant support can be found at 17.06 (05/05/2010 low).
Await fresh signal.
No information published constitutes an offer or recommendation, to buy or sell any investment instrument, to any transactions, or to conclude any legal act of any kind whatsoever. The information published and opinions expressed are provided by MIG BANK for personal use and for purposes only and are subject to change without notice. MIG BANK makes no representations (either expressed or implied) that the information and opinions expressed are accurate, complete or up to date. In particular, nothing contained constitutes financial, legal, tax or other advice, nor should any investment or any other decisions be made solely based on the content. You should obtain advice from a qualified expert before making any investment decision. All opinion is based upon sources that MIG BANK believes to be reliable but they have no guarantees that this is the case. Therefore, whilst every effort is made to ensure that the content is accurate and complete, MIG BANK makes no such claim. MIG BANK disclaims, without limitation, all liability for any loss or damage of any kind, including any direct, indirect or consequential damages. MIG BANK and/or its board of directors, executive management and employees may have or have had interests or positions on, relevant securities. All material produced is copyright to MIG BANK and may not be copied, e-mailed, faxed or distributed without the express permission of MIG BANK.
Recommended Content
Editors’ Picks
AUD/USD posts gain, yet dive below 0.6500 amid Aussie CPI, ahead of US GDP

The Aussie Dollar finished Wednesday’s session with decent gains of 0.15% against the US Dollar, yet it retreated from weekly highs of 0.6529, which it hit after a hotter-than-expected inflation report. As the Asian session begins, the AUD/USD trades around 0.6495.
USD/JPY finds its highest bids since 1990, approaches 156.00

USD/JPY broke into its highest chart territory since June of 1990 on Wednesday, peaking near 155.40 for the first time in 34 years as the Japanese Yen continues to tumble across the broad FX market.
Gold stays firm amid higher US yields as traders await US GDP data

Gold recovers from recent losses, buoyed by market interest despite a stronger US Dollar and higher US Treasury yields. De-escalation of Middle East tensions contributed to increased market stability, denting the appetite for Gold buying.
Ethereum suffers slight pullback, Hong Kong spot ETH ETFs to begin trading on April 30

Ethereum suffered a brief decline on Wednesday afternoon despite increased accumulation from whales. This follows Ethereum restaking protocol Renzo restaked ETH crashing from its 1:1 peg with ETH and increased activities surrounding spot Ethereum ETFs.
Dow Jones Industrial Average hesitates on Wednesday as markets wait for key US data

The DJIA stumbled on Wednesday, falling from recent highs near 38,550.00 as investors ease off of Tuesday’s risk appetite. The index recovered as US data continues to vex financial markets that remain overwhelmingly focused on rate cuts from the US Fed.
