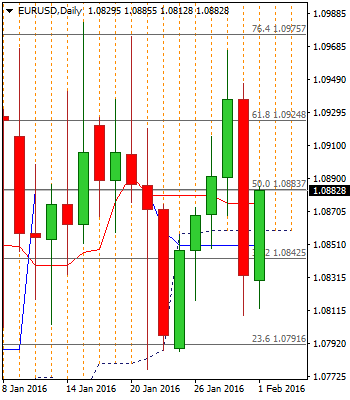
The Euro trades in near-term recovery mode, off fresh low at 1.0808, posted on last Friday’s sharp fall.
Upside attempts probe above daily Ichimoku cloud base at 1.0860, former support, below which Friday’s descend closed.
Pivotal resistance at 1.0880 zone, daily Tenkan-sen line / 30SMA, is tested and sustained break here is required to trigger stronger recovery, towards the upper side of short-term 1.0776/1.0983 congestion.
Otherwise, bearish setup of daily MA’s and daily indicators in neutrality territory, would signal limited recovery action.
Also, weak near-term technicals would maintain pressure for retest of 1.08 handle and possible extension to key 1.0776 support, on early upside rejection.
However, prolonged congestion is seen as favored near-term scenario, while the price holds within established short-term trend. The notion is supported by long-legged January’s candle, which signals indecision.
Res: 1.0906; 1.0925; 1.0966; 1.1006
Sup: 1.0860; 1.0839; 1.0808; 1.0776

GBPUSD
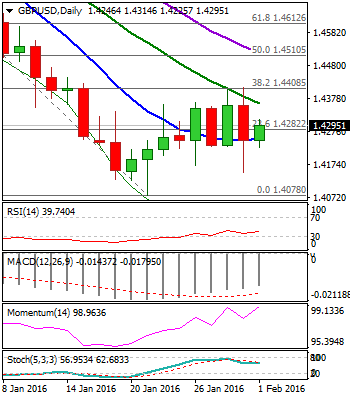
Cable spent last week in a choppy trading, unable to break out of congestion, established between 1.4147 and 1.4411. On weekly chart, the second consecutive long-legged Doji candle was left, suggesting hesitation and no direction in short-term trading.
However, larger timeframes maintain firm bearish tone and suggest resumption of larger downtrend, on completion of near-term consolidation phase.
The notion is supported by the third consecutive strong bearish monthly close, which suggests extension of bear-leg from 1.5928, June 2015 lower top.
Falling daily 20SMA capped the upside attempts for now and currently lies at 1.4362, marking initial barrier, ahead of 1.4411, congestion top and Fibonacci 38.2% of 1.4943/1.4078 descend, sustained break of which would trigger further recovery and expose next significant barrier at 1.4520, falling daily 20SMA.
Res: 1.4320; 1.4362; 1.4411; 1.4510
Sup: 1.4225; 1.4171; 1.4147; 1.4078

USDCAD
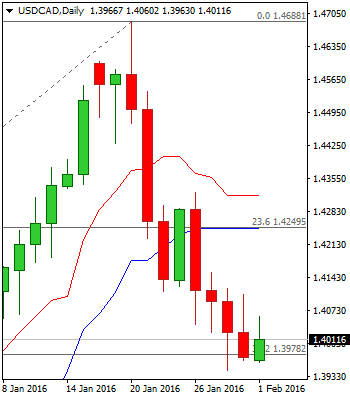
The pair remains at the back foot, following past week’s extension of the pullback from 1.4688 peak, which extended the second leg from 1.4323 lower top, to fresh three-week low at 1.3945. Friday’s trading closed marginally below pivotal 38.2% retracement of larger 1.2829/1.4688 ascend at 1.3978, closing in red candle with long upper shadow, which signaled persisting downside pressure. Also, the second weekly close in long red candle, with past week’s candle having long upper shadow, confirming negative stance, while the month ended in green, but with very long upper shadow of monthly candle.
All these suggest persisting bearish pressure for eventual attack at next pivotal supports at 1.3800, higher base and 1.3730, top of rising daily Ichimoku cloud.
Near-term price action consolidates within narrow range, with initial barrier at 1.4120, last Thu/Fri highs and Fibonacci 23.6% of 1.4688/1.3945 pullback, being intact for now.
Formation of daily 10/20SMA’s bear-cross at 1.4230, where also Fibonacci 38.2% retracement level lies, marks a breakpoint for extended recovery, in case of sustained break higher.
Res: 1.4060; 1.4154; 1.4199; 1.4230
Sup: 1.3963; 1.3945; 1.3900; 1.3800

AUDUSD
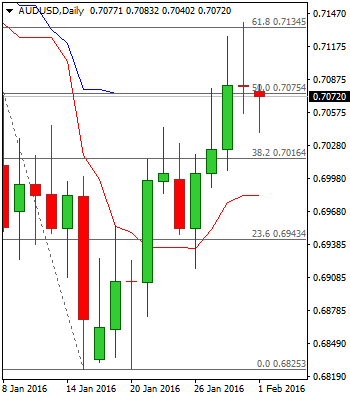
The pair came under pressure and returned below 0.71 handle, on pullback from Friday’s recovery peak at 0.7139, where daily 100SMA / Fibonacci 61.8% of 0.7325/0.6825 downleg, capped rally.
Recovery stall was signaled by long legged daily Doji on Friday and daily slow Stochastic turning sideways, just under overbought territory.
Bids lay at 0.7000 zone, where daily 10/20SMA’s bull-cross was formed and corrective easing should be ideally contained above here.
Bullish close for the second consecutive week, with north-heading weekly indicators, show room for further extension of corrective upleg from 0.6825 base. Daily close above 0.7139 high, to expose thin daily Ichimoku cloud, spanned between 0.7200 and 0.7215 and signal possible extension towards key 0.7325 lower top of 31 Dec.
Conversely, return below 0.7000 handle, would signal lower top formation and shift focus towards key 0.6825 base.
Res: 0.7083; 0.7100; 0.7139; 0.7200
Sup: 0.7040; 0.7000; 0.6969; 0.6917

The information contained in this document was obtained from sources believed to be reliable, but its accuracy or completeness cannot be guaranteed. Any opinions expressed herein are in good faith, but are subject to change without notice. No liability accepted whatsoever for any direct or consequential loss arising from the use of this document.
Recommended Content
Editors’ Picks
AUD/USD failed just ahead of the 200-day SMA

Finally, AUD/USD managed to break above the 0.6500 barrier on Wednesday, extending the weekly recovery, although its advance faltered just ahead of the 0.6530 region, where the key 200-day SMA sits.
EUR/USD met some decent resistance above 1.0700

EUR/USD remained unable to gather extra upside traction and surpass the 1.0700 hurdle in a convincing fashion on Wednesday, instead giving away part of the weekly gains against the backdrop of a decent bounce in the Dollar.
Gold keeps consolidating ahead of US first-tier figures

Gold finds it difficult to stage a rebound midweek following Monday's sharp decline but manages to hold above $2,300. The benchmark 10-year US Treasury bond yield stays in the green above 4.6% after US data, not allowing the pair to turn north.
Bitcoin price could be primed for correction as bearish activity grows near $66K area

Bitcoin (BTC) price managed to maintain a northbound trajectory after the April 20 halving, despite bold assertions by analysts that the event would be a “sell the news” situation. However, after four days of strength, the tables could be turning as a dark cloud now hovers above BTC price.
Bank of Japan's predicament: The BOJ is trapped

In this special edition of TradeGATEHub Live Trading, we're joined by guest speaker Tavi @TaviCosta, who shares his insights on the Bank of Japan's current predicament, stating, 'The BOJ is Trapped.'